JOGMEC's approach for critical metals and efforts for stable supply - JOGMEC Oct 9, 2018 - IRTC

Page created by Chester Thompson
 
CONTINUE READING
JOGMEC's approach for critical metals and efforts for stable supply - JOGMEC Oct 9, 2018 - IRTC
JOGMEC's approach for critical metals and
       efforts for stable supply

              Yoshihiro Kojima
                  JOGMEC
                  Oct 9, 2018
JOGMEC's approach for critical metals and efforts for stable supply - JOGMEC Oct 9, 2018 - IRTC
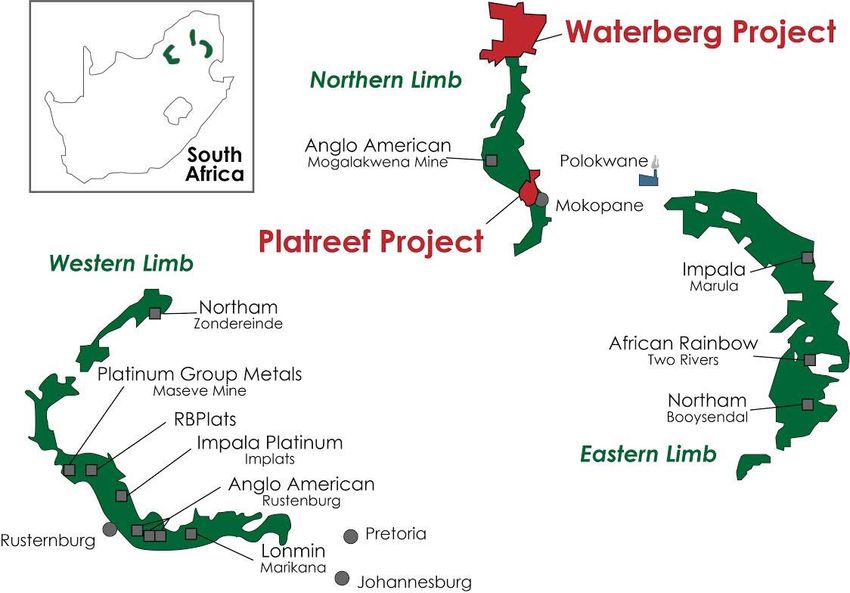
1

Today’s Presentation

1. JOGMEC’s Activity/ Function for
Stable Supply on Metals

2. China’s Influence on Global Metal
Market from the view point of
Japanese Economy
JOGMEC's approach for critical metals and efforts for stable supply - JOGMEC Oct 9, 2018 - IRTC
2

Today’s Presentation

1. JOGMEC’s Activity/ Function for
Stable Supply on Metals

2. China’s Influence on Global Metal
Market from the View Point of
Japanese Ecnomy
JOGMEC's approach for critical metals and efforts for stable supply - JOGMEC Oct 9, 2018 - IRTC
Natural Resources in Japan                                     3

                                   • Since Japan has few
                                     domestic natural
                                     resources, Japan
                     100%
                                     depends on imports
                             Tin     for almost all of its
                   100%              crude oil, natural gas,
           99.3%                     non‐ferrous metals
                          Copper
   99.6%                             and minerals.
              Coal

     Oil
JOGMEC's approach for critical metals and efforts for stable supply - JOGMEC Oct 9, 2018 - IRTC
The Importance of Metals for Japanese Industry                                                                           4
      In, 48.7%
     Ga, 44.9%
 Mo, 16%
 REE, 14.8%
  Li, 14.0%
 Pt, 13%                                                       • Japan has high‐tech
 Pd, 12.8%※
 Ti, 12.1% ※                                                     industries which utilize many
 Co, 9.9% ※
 Ni, 8%                                                          types of metals; especially
 Ge, 7.7%
 Sn, 7.6%                                                        rare metals and REE.
 V, 7.5%
 W, 7.3%                                                       • GDP of Japan is almost 6% in
 Nb, 7.1%
 Mg, 4.8%                                                        the world. Most of rare
 Sb, 4.7%
 Cu, 4.2%                                                        metals are above the
 Fe, 3.9% ※
 Mn, 3.7% ※                                                      percentage.
 Zn, 3.4%
 Al, 3.3%
 Ag, 3.1%
 Pb, 2.5%                                                Iron, Base metals
 Zr, 2.0%                                                Rare metals
 TiO2, 1.7%                                              Precious metals
 Au, 1.5%                                                Rare earth elements

                  0%           10%               20%               30%                40%               50%             60%
Source: World Metal Statics 2015(WBMS), Mineral Commodity Summaries 2015(USGS), INDUSTRIAL RARE METALS No.130(アルム出版社)
                            Percentage of Consumption: Japan/World (2017)
JOGMEC's approach for critical metals and efforts for stable supply - JOGMEC Oct 9, 2018 - IRTC
JOGMEC, Who We Are                                                         5
• Japan Oil, Gas and Metals National Corporation (JOGMEC), an
  incorporated administrative agency, is established by the
  Japanese government.
• The principal role of JOGMEC is to seek a stable supply of natural
  resources for Japanese industry as an agency implementing natural
  resource policies under jurisdiction of METI.

Since 1963                                                         Since 1967
 Metal Mining Agency of Japan              Japan National Oil Corporation
           (MMAJ)                                     (JNOC)
     February 2004

             Japan Oil, Gas and Metals National Corporation
                                (JOGMEC)
                                               Coal & Geothermal units added
JOGMEC's approach for critical metals and efforts for stable supply - JOGMEC Oct 9, 2018 - IRTC
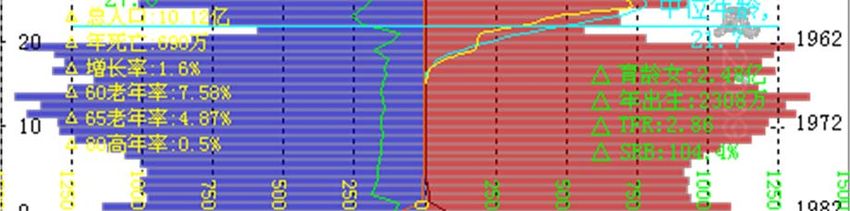
Organization of JOGMEC                                 6
Headquarter: Tokyo
• Metals Strategy & Exploration Unit
• Metals & Coal Financial and Environment Unit
• Stockpile Unit
• Oil & Gas Upstream Business Unit
• Oil & Gas Upstream Technology Unit
• Geothermal Resource Development Dept.
Two research centers in Japan
• Metals Technology Center
• Technology & Research Center (oil and gas)
Worldwide network
• 13 overseas offices gathering relevant information
JOGMEC's approach for critical metals and efforts for stable supply - JOGMEC Oct 9, 2018 - IRTC
Early‐Stage Overseas Exploration                                                                           7
• Take early‐stage risks to promote overseas explorations
• Program
   – Typical joint venture style exploration
       • Farming into an exploration project held by a foreign
         company, then transferring JOGMEC’s contractual interest
         to a Japanese company
• Target commodities
                                   H                                                                       He
   – Base metals (Cu, Zn,...)      Li   Be                                         B    C    N    O   F    Ne
                                   Na Mg                                           Al   Si   PP   S   Cl   Ar
   – Rare metals                   K
                                   K    Ca Sc    Ti   V   Cr Mn Fe
                                                                Fe Co Ni Cu Zn Ga Ge As Se Br              Kr
                                   Rb Sr     Y   Zr Nb Mo Tc Ru Rh Pd Ag Cd        In   Sn Sb Te      I    Xe
     (Ni, Co, REE, Li, ...)        Cs Ba La      Hf Ta W Re Os     Ir   Pt Au Hg   Tl   Pb   Bi   Po At Rn
                                   Fr Ra Ac      Rf Db Sg Bh Hs Mt Ds Rg

                                             La Ce Pr Nd Pm Sm Eu Gd Tb Dy Ho Er Tm Yb Lu
                                             Ac Th Pa     U Np Pu Am Cm Bk    Cf   Es Fm Md No Lr
JOGMEC's approach for critical metals and efforts for stable supply - JOGMEC Oct 9, 2018 - IRTC
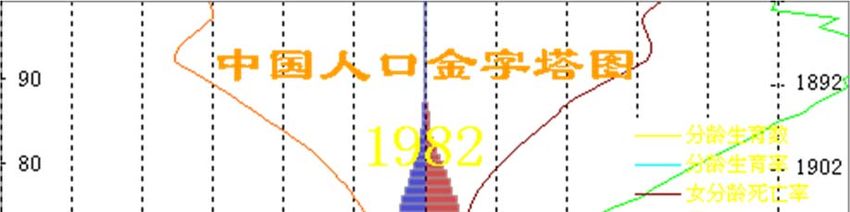
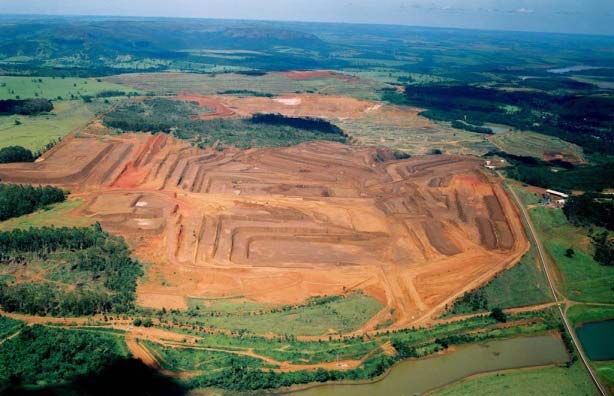
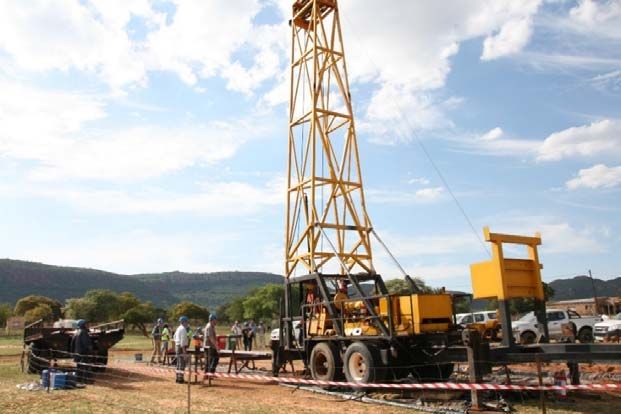
Discovery at Waterberg – for safe and low‐cost operation   8

Waterberg Outline
• Exploration started in 2009, Discovery in 2011
• Impala Platinum participated in the project in 2017
• Resources (cut‐off grade 2.5 g/t):
  [Indicated] 24.8 Miloz 3PGMs+Au [Inferred] 10.8 Miloz
3PGMs+Au
• Prill Split : Pd 61%, Pt 30%, Au 8%, Rh 1%+ Cu, Ni
JOGMEC's approach for critical metals and efforts for stable supply - JOGMEC Oct 9, 2018 - IRTC
Support Programs for Advanced‐Stage Projects       9

• Financial assistance to Japanese companies for
  overseas mineral explorations or development
  projects
• Programs
   – Financing for overseas explorations
   – Funding part of the equity capital
   – Guaranteeing the liabilities
Financial Assistance                                                              10
 Mt. Weld REE mine                   • Sojitz and JOGMEC agreed to provide a total
                                       of US$ 250M through loan and equity to
                                       Lynas’s Mt. Weld REE mine on March 2011.
                                     • 8,500 tonnes/year of REE products can be
                                       delivered to Japan.
                                     • First REE products were shipped in March
                                       2013.

                                                      JOGMEC            Sojitz

                                                   Investment

                                                         Japan Australia
                                                         Rare Earths B.V.
                                                                    Financing
                                                                    (Loan & Equity)

                                                                Lynas
      Mount Weld Rare Earths Concentration Plant
Financial Assistance                                                                 11
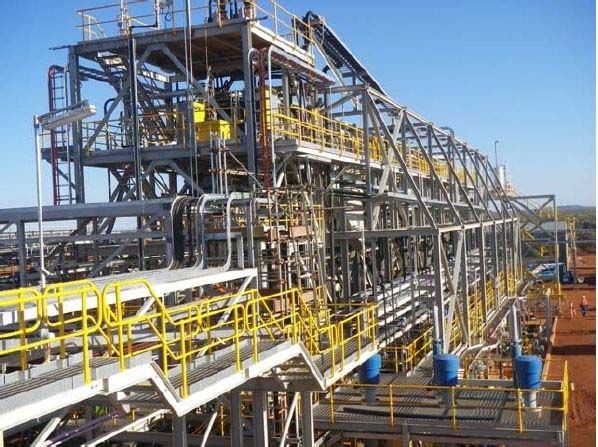
 Araxá Niobium mine              • Japanese group (JFE Steel, Nippon Steel, Sojitz
                                   & JOGMEC) acquire 10% stake in CBMM on
                                   March 2011 by investing US$ 1.3B.
                                 • CBMM owns Araxá niobium mine, refining
                                   plant & metallurgical facilities.
                                 • CBMM produces over 80% of global supply.
                                 • Reserves of Araxá mine is equivalent to over
                                   200 years of world demand.

                                     JOGMEC     Sojitz   JFE      NSC       POSCO   NPS

                                                               Investment

                                            Japanese SPC                    Korean SPC
                                               10%                  5%

     Aerial View of Araxá mine                  CBMM
Re‐evaluation of Criticality Matrix                  12

                                      • Refers to EU’s
                                        model
                                      • Adjusts for
  Supply Risk

                                        Japanese
                                        industries
                                      • Data used is
                                        2012.
                                      • Now updating

                Economic Importance
13

Today’s Presentation

1. JOGMEC’s Activity/ Function for
Stable Supply on Metals

2. China’s Influence on Global Metal
Market from the View Point of
Japanese Economy
Chinaʼs share in            ・In last 10 years, Chinese Cu
Copper                      consumption expanded by 8 million ton.
consumption                 ・On the other hand, ex-China shrunk
                            ・Chinaʼs share is about 50%

     kt               Refined Cu Consumption
25,000

                                                                   Others
20,000
                                                                   Russia
                                                                   Italy
15,000
                                                                   Korea

10,000                                                             Japan
                                                                   Germany

 5,000                                                             USA
                                                                   China
     0
          2006 2007 2008 2009 2010 2011 2012 2013 2014 2015 2016
Chinaʼs share in                      ・In last 10 years, Chinese Zn
Zinc consumption                      consumption expanded by 3.5 million ton.
                                      ・On the other hand, ex-China shrunk

     kt                          Zinc Consumption
16,000

14,000
                                                                                        Others
12,000
                                                                                        Belugium
10,000                                                                                  Germany
 8,000                                                                                  Japan

 6,000
                                                                                        India
                                                                                        Korea
 4,000
                                                                                        USA
 2,000
                                                                                        China
    0
          2006   2007   2008   2009    2010   2011   2012   2013   2014   2015   2016
Chinaʼs share in          ・In last 10 years, Chinese Lead
Lead                      consumption expanded by 2.4 million ton.
                          ・On the other hand, ex-China consumption
consumption               grew only 800 k ton.

    kt
                           Lead Consumption
 12,000

 10,000                                                            Others
                                                                   Japan
  8,000
                                                                   UK
                                                                   Germany
  6,000
                                                                   Korea
  4,000                                                            India
                                                                   USA
  2,000
                                                                   China

     0
          2006 2007 2008 2009 2010 2011 2012 2013 2014 2015 2016
China’s Share of Base Metal Consumption (2017)

Refined Copper                        Aluminum                             Lead
 【World】23,460Kt(Cu t)                    【World】59,190Kt            【World】11,480Kt(Pb t)

              50.3%                                 53.9%                          41.3%

                         Zinc                                   Nickel
                  【World】14,213Kt(Zn t)                     【World】1,910Kt(Ni t)

                                 49.0%                                  40.3%
・The peak of total population
Maturing China’s Economy and
                                                                                         will come in 2030; 1.4billion
Society                                                                                  people.
Decreasing Working‐age Population                                                        ・ But that of working-age
                                                                                         population already peaked in
      million people                                                                     2010.
   2,000                                                                                                                                                       100%
   1,800                                                                          Peak of working‐age                                                          90%
   1,600                                                                          population                                                                   80%
   1,400                                                                                                                                                       70%
            % of working‐age population [RHS]
   1,200                                                                                                                                                       60%
   1,000                                                                                                                                                       50%
    800                                                                                                                                                        40%
    600                                                                                                                                                        30%
    400                                                                                                                                                        20%
    200                                                                                                                                                        10%
       ‐                                                                                                                                                       0%
            1950
                   1955
                          1960
                                 1965
                                        1970
                                               1975
                                                      1980
                                                             1985
                                                                    1990
                                                                           1995
                                                                                  2000
                                                                                         2005
                                                                                                2010
                                                                                                       2015
                                                                                                              2020
                                                                                                                     2025
                                                                                                                            2030
                                                                                                                                   2035
                                                                                                                                          2040
                                                                                                                                                 2045
                                                                                                                                                        2050
                     age 15‐59 (working‐age population)                                                age 0‐14                    age over 60

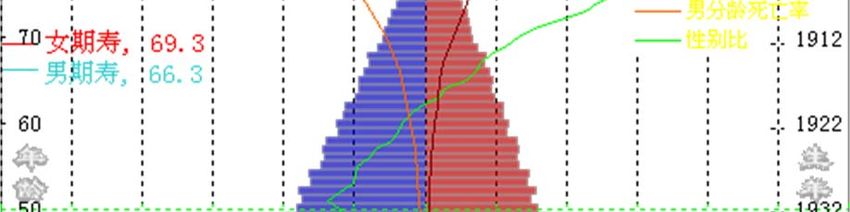
                                                                                                   Source: World Population Prospects, UN, 2015
・Ending one-child policy was too late
                              to stop decreasing working-age
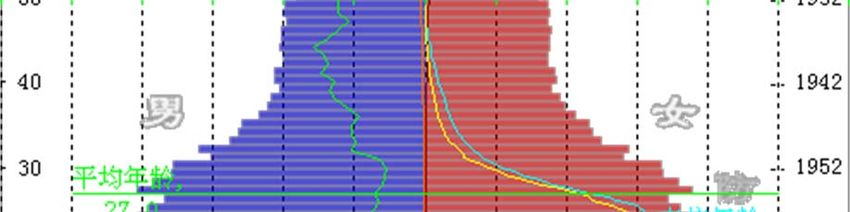
China’s Age Pyramid to 2050   population.
                              ・Many people hesitate to have the 2 nd
                              child because of weak social welfare.

     Age                                                The year
                                                        of birth
Cu Refinery Capacity in China   ・Cu Refinery capacity in
                                 China expands to
     kt
                                 11million ton in 2018
12,000
11,000
10,000
 9,000
 8,000
 7,000
 6,000
 5,000
 4,000
 3,000
 2,000
 1,000
      0

                                                       25
source: CRU
Summary                                        21
• JOGMEC is a governmental agency seeking to
  stable supplies of natural resources for Japan.
• The impact of China’s growth in metal
  consumption affect to metal market.
• Economic tie between Japan and China is very
  strong, China’s economic and social change would
  give effect on Japan’s material industry.
• Mine development takes 10 – 15 years, we should
  imagine future economy/society in the world
  in order to keep stable supply of metals.
26

Thank you for your attention!!

           Yoshihiro Kojima

     Kojima‐yoshihiro@jogmec.go.jp
You can also read