Per Block Vulnerability Index - Juan Daniel Oviedo Arango Director National Administrative Department of Statistics
←
→
Page content transcription
If your browser does not render page correctly, please read the page content below
Per Block
                       Vulnerability Index

              Juan Daniel Oviedo Arango
                                       Director
National Administrative Department of Statistics

          8th IMF Statistical Forum, November 17th, 2020
I N F O R M A C I Ó N   P A R A   T O D O S

General context

                                        •   Provide statistical information and build tools.
           Inter-institutional
           group                        •   Facilitate decision-making for the line ministries to create effective policies in the COVID-19
                                            emergency.

                                        •   Age and comorbidity conditions that represent greater frailty in patients who acquire COVID-19.
           Vulnerability to
           COVID-19                     •   Population: Age over 60 years; comorbidities; cohabitation conditions

                                        •   Construction of the index from the identification and selection of 13 variables.

           Vulnerability index          •   Sources: 2018 National Population and Housing Census, and administrative records.

                                        •   Groups generated by k-means method.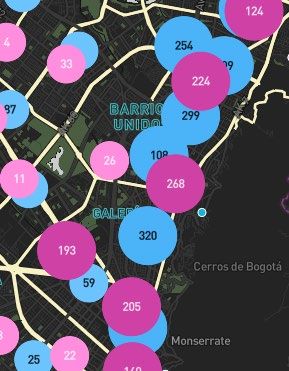
I N F O R M A C I Ó N   P A R A   T O D O S

                                                    General definitions

                                                    Population over 60 years old
Who are the most vulnerable
to Covid-19?                                        Population with comorbidities

Population that, due to its demographic
characteristics and health conditions,                              Ischemic
may have more complications in case of            Hypertension
                                                                   Cardiopathy
                                                                                 Lung Conditions       Diabetes   Cancer

getting COVID-19.
                                                    Population in the following cohabitation
                                                    conditions:
                                                          Overcrowded population

                                                          Older adults in single-person households

                                                          Older adults cohabiting with youth (20-29)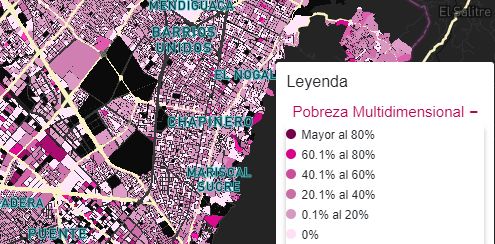
I N F O R M A C I Ó N     P A R A   T O D O S

Inputs

  NPHC -2018                                                                  Unique Database of Health
                                                                              Affiliation- BDUA
  National Identification
  Archive– ANI
                                          Identification document
                                                                              Individual health care delivery
  Civil Birth Registry RCN                                                    records -RIPS

     Population over 60 years old                                   Population with comorbidities

     Overcrowded population

     Older adults in single-person households

     Older adults cohabiting with youth (20-29)
I N F O R M A C I Ó N   P A R A   T O D O S

Variables included in the analysis

                                          A review of the behavior of the virus in other countries*
                                          and in Colombia at the time the index was constructed
                                          made it possible to identify and select the 13 variables
                                          that were included in the analysis.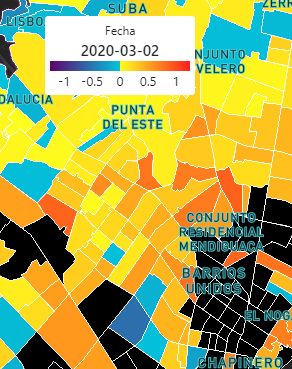
I N F O R M A C I Ó N    P A R A   T O D O S

1.     Comorbidities: diseases that, due to their effect on the immune system of individuals, generate complications after
       infection with the virus. Five associated diseases were identified, with each one of them a variable defined as the
       proportion of people in the block with the comorbidity is constructed. These are:

     1.1. Hypertension                              1.2 Diabetes                                 1.3 Ischemic
                                                                                                 Cardiopathy

                             1.4 Chronic Lung                                1.5 Cancer
                                  Disease
I N F O R M A C I Ó N P A R A T O D O S
2. Adult population: proportion of individuals of 60 years and
older in the block level.
3. Overcrowding:
3.1 Proportion of households with more than 3 people per room.
3.2 Proportion of households with more than 3 people per sleeping
room.
4. Population density: ratio between the number of people
counted and the area in square meters.I N F O R M A C I Ó N P A R A T O D O S
5. Intergenerational risk: proportion of households 6. Persons 60 years of age and older in
in which highly contagious population groups live with single-person households
people aged 60 or older.
Number of households on the block with a single
person 60 years of age or older.
5.1 High risk: adults 60 years of age or older, living
together with population between 20 and 29 years of
age, identified as the group with the highest rate of
infection.
7. Persons 60 years of age and older in non-
family households:
5.2 Medium risk: adults 60 years of age or older, living in
Number of households on the block in which a
the second most contagious group, between 30 and 59 person 60 years of age or older lives, in which there is
years of age. no family nucleus, and the members of the household
are not related.I N F O R M A C I Ó N P A R A T O D O S
Conformation of groups
The exercise consisted in grouping the blocks of the municipal seats, according to the chosen variables at the block level. To achieve it,
we consolidated a data base that has 407,277 rows, which represent all the blocks in municipal seats of the country.
Persons 60
Over 60 years
Adults 60 High Medium years of age
Population Overcrowding Overcrowding Ischemic old in single-
years and intergenera intergenera- Diabetes EPOC Cancer and older in
Density in rooms in bedrooms Hypertension Cardiopathy person
older -tional risk tional risk non-family
households
households
0.023 0.219 0.025 0.034 0.189 0.064 0.023 0.030 0.046
- - 15 3
0.009 0.073 - - 0.049 - - - 0.024 -
0.111 0.111 -
0.030 0.167 0.167 - 0.222 0.111 - - - -
- - -
0.065 0.067 - 0.025 0.126 0.034 - 0.017 0.050 -
- - -
0.053 0.186 - - 0.071 0.071 0.116 0.047 0.023 0.070 0.023 -
-
0.035 0.355 - - 0.087 0.130 0.197 0.079 0.039 0.039 0.079
2 -I N F O R M A C I Ó N P A R A T O D O S
Classification method
Objective
To differentiate the characteristics present in the
data in the form of groups, through a measure of
homogeneity in the observations.
How is it achieved?
Applying a training algorithm in search of a partition
of the set of n observations in K subsets.I N F O R M A C I Ó N P A R A T O D O S Centroides
Grupo 0 Grupo 1 Grupo 2 Grupo 3 Grupo 4
Densidad poblacional 0.049 0.074 0.038 0.063 0.051
Ordinality criteria Adultos mayores de 60 0.264 0.183 0.279 0.220 0.115
Hacinamiento en cuartos 0.003 0.010 0.001 0.006 0.012
Hacinamiento en dormitorios 0.007 0.026 0.003 0.017 0.030
First, the maximum value of each of the Riesgo intergeneracional alto 0.029 0.030 0.028 0.030 0.022
variables in each centroid is obtained, a
label is assigned, and the number of Riesgo intergeneracional medio 0.063 0.057 0.058 0.063 0.039
maxima in each of the groups is counted.
Hipertensión 0.179 0.155 0.173 0.171 0.103
It is then established that the group with Diabetes 0.053 0.050 0.048 0.054 0.033
the greatest vulnerability is the group with 0.025 0.018 0.024 0.021 0.011
Cardiopatía isquémica
the highest number of maximums; in the
EPOC 0.032 0.032 0.033 0.034 0.021
event of a tie, it is resolved at random.
Cáncer 0.053 0.039 0.053 0.045 0.025
Mayores de 60 años en hogares
21.41 3.14 55.96 8.40 0.36
unipersonales
Mayores de 60 años en hogares
1.08 0.21 2.49 0.43 0.06
no familiares
Número de máximos 3 1 4 3 2I N F O R M A C I Ó N P A R A T O D O S
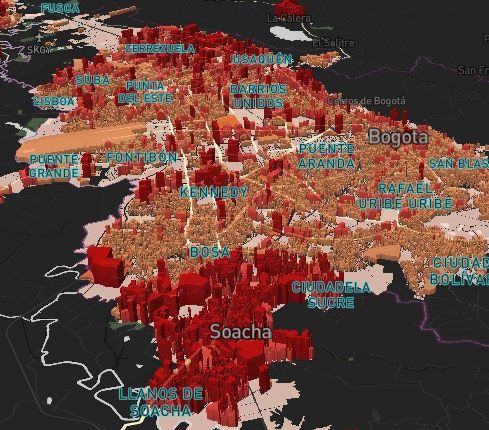
Per block Vulnerability Geovisor
Multi dimensional Number of facilities (medical
Poverty Index centers and hotels)
Geospatial information platform, in which you can identify
the vulnerability of the environment, neighborhood or
block, to the phenomenon of contagion by COVID-19
http://visor01.dane.gov.co/visor-vulnerabilidad /
Percentage of older adults Mobility IndexI N F O R M A C I Ó N P A R A T O D O S Geovisualization of vulnerability Groups by levels of vulnerability at the block level. Diagrams and filters by territorial levels. Enable layers, transparencies, and 3D views. Video tutorial, methodological note and shapefile download.
I N F O R M A C I Ó N   P A R A   T O D O S

Conclusions

   All municipalities have groups with high and low vulnerability; however, this label does not
   necessarily represent greater risk.
   The variables that entered the model are demographic and comorbidities, most of which are
   related to the elderly; the population that in general is the most vulnerable to the Covid 19 ,
   and it is presumed that by having greater prevalence of these variables, the area is more
   vulnerable.
   Due to the evolution of the pandemic, it is recommended that other identified comorbidities
   be included.
I N F O R M A C I Ó N   P A R A   T O D O S

Pivot Post-Covid: an evidence-based approach to tackle the uncertain

      How can the Data Stewardship approach foster an appropriate transition from an
      emergency/urgency situation to the post-Covid scenarios?
      What are the main challenges regarding the strengthening of our work on experimental
      statistics?
      How did the data needs, under an ongoing data revolution, evolved during the Covid-19
      pandemic? And how did NSO’s adapt to remain fit for purpose.
Per Block
Vulnerability Index
8th International Monetary
Fund Statistical Forum
November 17th, 2020You can also read