REGULAR UPDATES # 26 JUNE 2 2021 - Kraft Analytics Group
←
→
Page content transcription
If your browser does not render page correctly, please read the page content below

R EGULAR UPDATES # 26
     JUNE 2 2021
BACKGROUND
              In KAGR’s 26 th update to the “Future of Live Events & Sports: The Re-Emergence of Fans Post
              Covid-19”. we explore the impact of vaccination rollout on market behaviors and fan demand.
              We continue to closely track how our framework1 for understanding Fan Demand is impacted
              based on market-specific factors, venue initiatives, and fan avidity. We have sifted through all
              the noisy data to bring you insights on how live events and sports will be different because of
              the COVID-19 pandemic.

              June 2 2021: Update Overview

              Several markets opened for 100% capacity for NBA and NHL playoffs. To instill fan confidence
              and safety, some professional teams have established vaccinated sections, including the Brooklyn
              Nets who established price differences between non-vaccinated sections. NFL demand remains
              high in several markets, including Las Vegas where the Raiders are driving strong secondary
              market activity. As capacity increases and new products (i.e., vaccinated sections) are introduced,
              we remain focused on defining: which fans will attend, what do they expect when they return,
              and how has their willingness to pay changed?

              In this update we explore:
                                  • Relationship between KAGR Fan Demand Index and vaccination
                                    rates by market
                                  • Sell-through trends for the NBA Playoffs between 2019 and 2021

                                                                                                                    1
1 See Figure 5 on page 6 “KAGR Fan Demand Framework”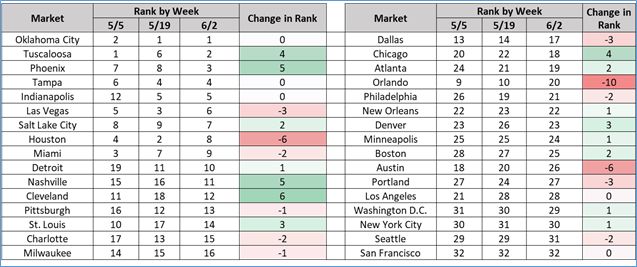
MARKET ANALYSIS
               The KAGR Fan Demand Index remained flat (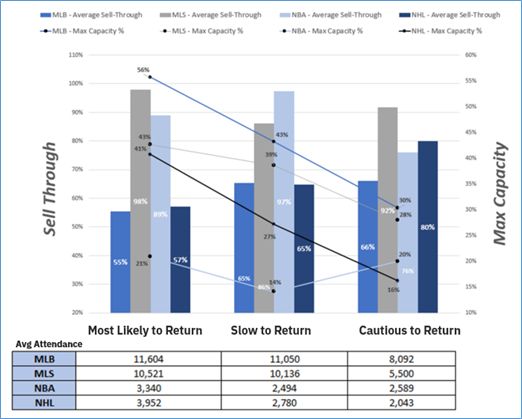
Specific markets insights include:

            • Negative Change: Slow to Return to Cautious to Return
                    o Seattle dropped to Cautious to Return with a decrease in economic mobility
                      (-4%) and minimal dining and entertainment activity compared to other
                      markets. Seattle professional teams including the Mariners, Sounders, and
                      Storm are also taking a cautious approach to increasing fan capacity. Outside of
                      sports, many of Seattle’s big summer events remain canceled or have opted for
                      virtual for the second year in a row.

KAGR FAN DEMAND INDEX CHANGES: WEEK-OVER-WEEK REVIEW
The overall KAGR Fan Demand Index increased less than 1% week-over week. Oklahoma City retained
the top spot and Cleveland (+6) had the largest week-over-week jumps. Orlando dropped 10 spots
week-over-week. Notable market highlights include:
              • Positive Fan Demand Index changes:
                     o Cleveland (+6): dining and entertainment activity increased by
                       30% and recent confirmed COVID-19 cases decreased by 29%
                     o Phoenix (+5): dining and entertainment activity increased by 18%
                     o Nashville (+5): dining and entertainment activity increased by
                       25% and economic mobility is up 4%
              • Negative Fan Demand Index changes:
                     o Orlando (-10): dining and entertainment activity decreased by 3%
                       and economic mobility3 is down 10%
                     o Houston (-6): economic mobility3 is down 9%

             FI GURE 2. KAGR FAN DEMAND INDEX RANKINGS BY MARKET

                                                                                                         3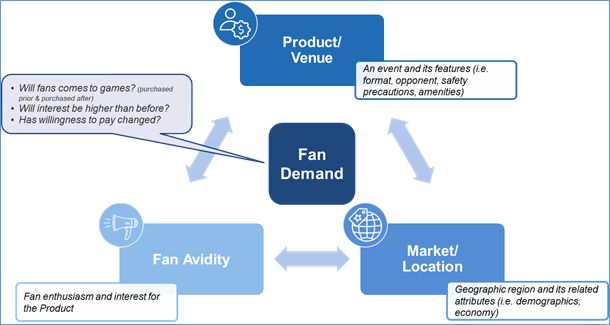
FAN AVIDITY AT A GLANCE
This week we look at sell-through trends across markets for MLB, NBA, NHL, and MLS teams. We also explore
year-over-year difference in NBA playoffs between 2019 and 2021.

MLB, MLS, NBA, AND NHL SELL-THROUGH TRENDS

In Figure 3, we examine sell-through over the past two weeks including the first five home games for MLS clubs
prior to the international break. Like other leagues, MLS sell-through has come out strong. As the season
continues and capacity restrictions loosen further, we will track whether MLS can sustain this demand.

               FIGURE 3. MLB, MLS, NBA* AND NHL REGULAR SEASON SELL-THROUGH
                   ACROSS KAGR MARKET GROUPINGS (MAY 17 2021-MAY 26 2021)

                      * The Boston Celtics and Chicago Bulls are omitted from the Slow to Return groupings due to data inconsistencies.

                •    MLS clubs exceed (+5%) the strong sell-through rate set by the NBA and is on average
                    48% greater than MLB and 37% greater than the NHL. The MLS allowed capacity
                    (through May 28th) is significantly greater than indoor venues (NBA and NHL) and
                    slightly below that of outdoor MLB stadiums

                •    MLB continues to be challenged as the season progress, falling back on average 5% over
                    the last two weeks, with Most Likely to Return and Slow to Return markets sliding
                    back 15% respectively. Despite this trend, Cautious to Return markets did increase by
                    14%, in part due to strong demand for New York Yankees and Washington Nationals
                    during this two-week time period

                                                                                                                                          4
FIGURE 4. NBA PLAYOFF SELL-THROUGH: 2019 vs 2021
(as of MAY 26 2021)
• On average, sell-through for the opening games of the 2021 NBA Playoffs is down 12%
compared to those for the 2019 NBA Playoffs. Specific market highlights include:
o Most Likely to Return (Milwaukee Bucks, Phoenix Suns, Utah Jazz):
Sell-through is down 11%
Maximum capacities for games (through 5/28) averaged 86%
o Slow to Return (Boston Celtics, Denver Nuggets, Los Angeles Clippers, Los Angeles
Lakers, Philadelphia 76ers):
Sell-through is down 8%
Maximum capacities for games (through 5/28) averaged 40%
o Cautious to Return (Brooklyn Nets, Golden State Warriors, New York Knicks):
Sell-through is down 17%
Maximum capacities for games (through 5/28) averaged 66%; with both New
York teams at 80% or above
As the NBA and NHL playoffs drive forward with many markets now close to 100%, we will continue to
keep a close eye on sustained demand. In the coming weeks, we will be looking to dig deeper into the
demographics and behaviors of those fans returning for both NBA and NHL playoffs as well as regular
season match-ups:
• Will we again see a spike in pent up demand and then see numbers trail off?
• Which markets and leagues will see the most sustained impact from the
pandemic?
• How can clubs and leagues use data, analytics, and innovative strategies to
mitigate long term impact?
5Looking for MORE?
What fan demand questions are you looking to answer? We would love to hear from
you.
We welcome your feedback and questions. Please share with us at
FutureSportsandEvents@kagr.com.
FIGURE 5. KAGR FAN DEMAND FRAMEWORK
6You can also read