Recirc Ready- a diet concept for RAS solutions - Saskia Kröckel-researcher nutrition Skretting ARC - Büsumer ...
←
→
Page content transcription
If your browser does not render page correctly, please read the page content below
Recirc Ready- a diet concept for RAS solutions
      Saskia Kröckel- researcher nutrition Skretting ARC
                    Büsumer Fischtag 2017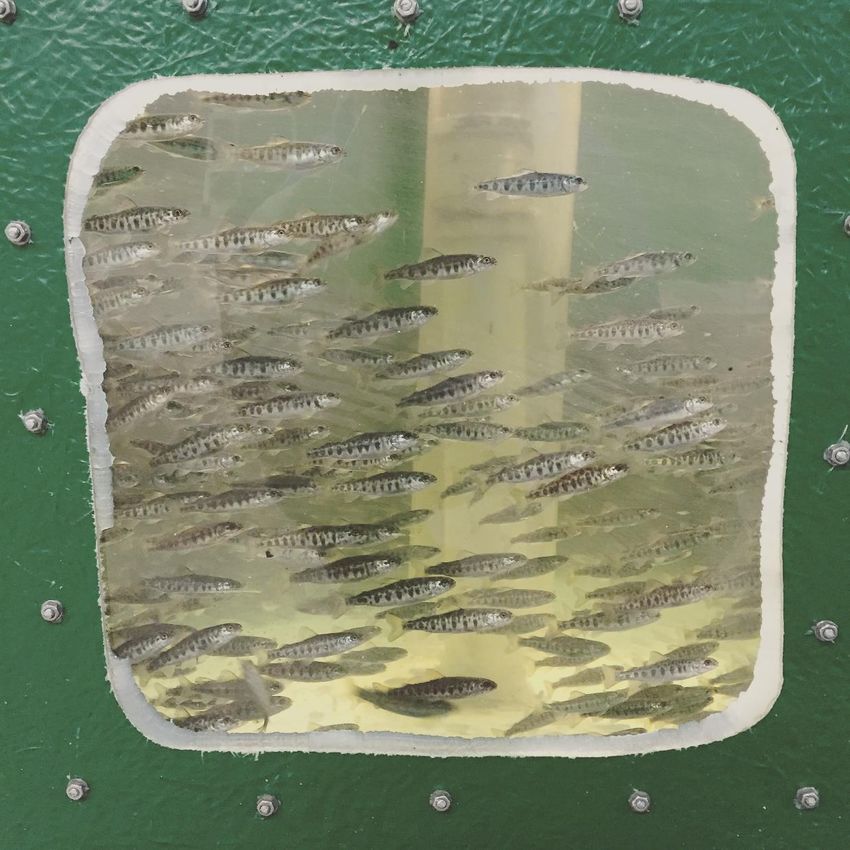
Table of content

    1   Background

    2   Smolt farming now and future

    3   The product

    4   Research towards Recirc ready

    5   Feedback

    6   Efficiency model freshwater

    7   What's next?

2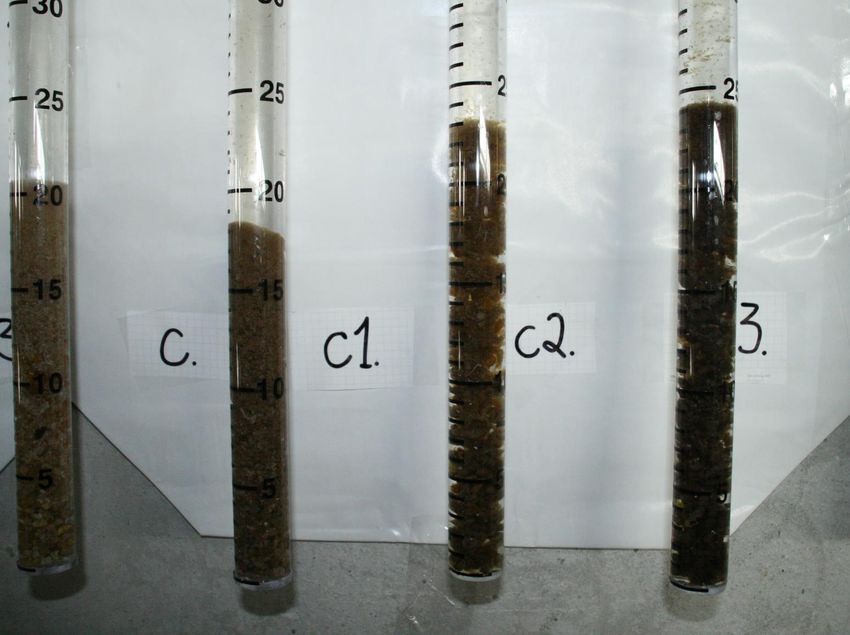
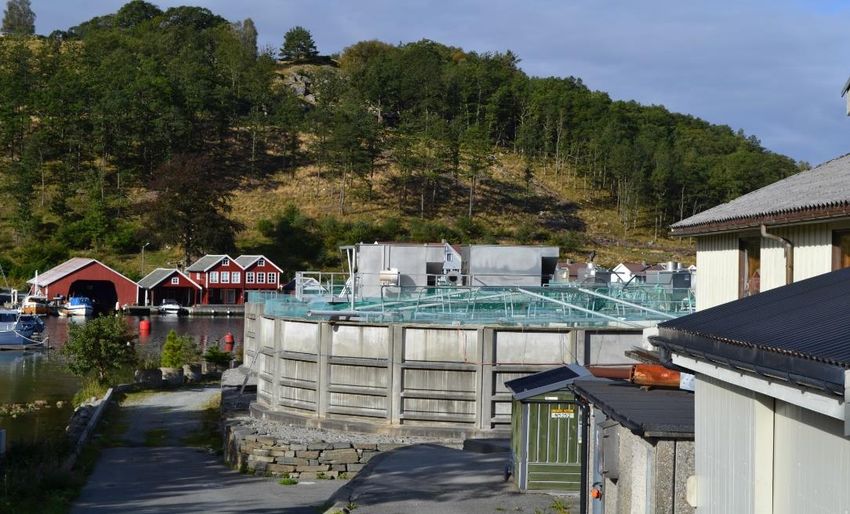
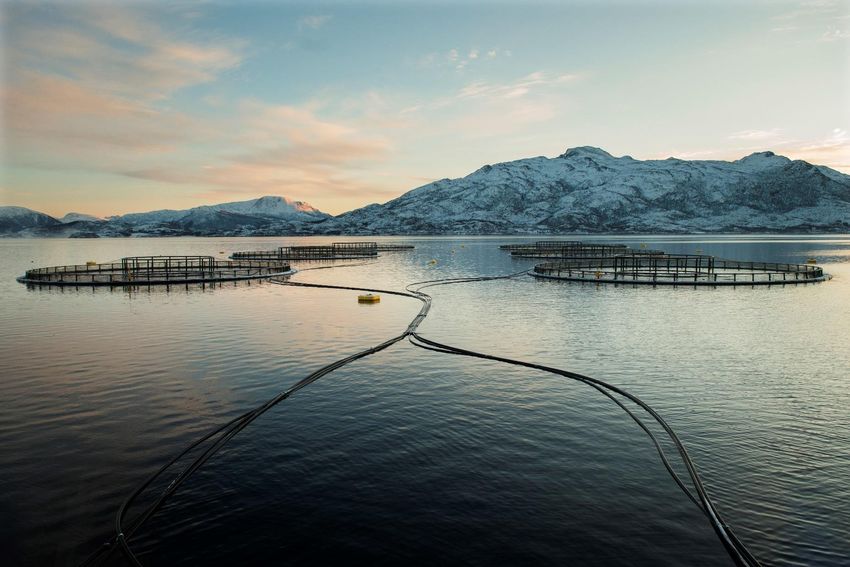
This is Norwegian salmon farming until today
Background
• Land-based salmon hatcheries and smolt production sites using
  recirculated aquaculture systems (RAS) increase rapidly
    •   Sea lice control (reduced exposure time)
    •   Maximum allowed biomass in sea cages is used more efficiently
    •   Better overall economy (control)

• Sludge capture and treatment
    •   Stricter government regulation in terms of handling
    •   Sludge as a resource (energy, fertilizer, spinn of products)
    •   Phosphorus-recapture: Limited resource, don’t waste.

5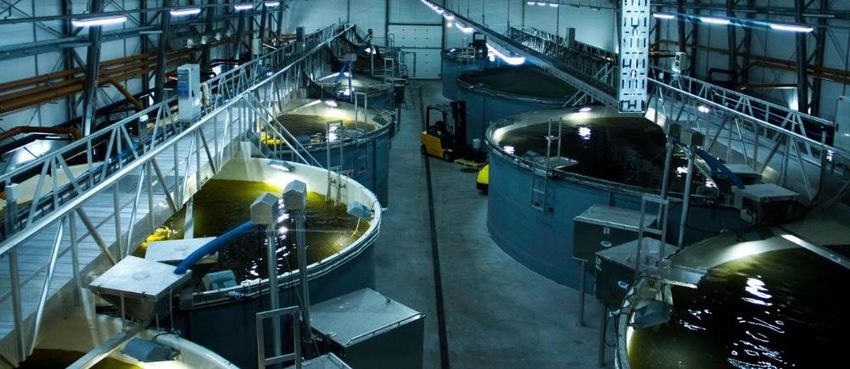
Potential
Change of scale
    •   2008: large RAS 2 MT of feed/day, 250-400 m3 fish tanks
    •   2016: large RAS 20 MT of feed/day, 750-1000 m3 fish tanks

Norway
• Total feed production (2016): 40.000 MT feed of which 11.000 MT for RAS
• Total market potential (2020): 76.000 MT feed of which 45.000 MT for RAS

6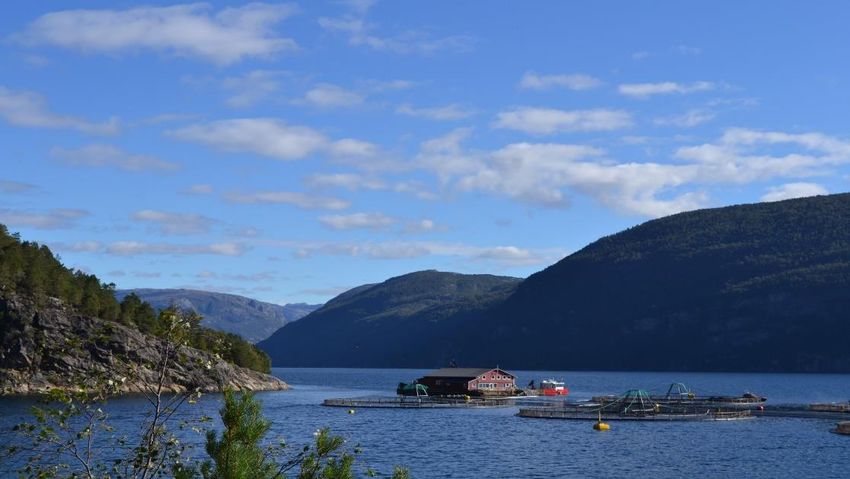
Market development RAS vs FTS 2016
                                                                      % of total market
Volume (MT)
40 000                                                                            70.0

                        Total market   RAS     % RAS
35 000                                                                            60.0

30 000
                                                                                  50.0

25 000
                                                                                  40.0
20 000
                                                                                  30.0
15 000

                                                                                  20.0
10 000

 5 000                                                                            10.0

    0                                                                             0.0
              Norway   UK              Chile           Canada   Australia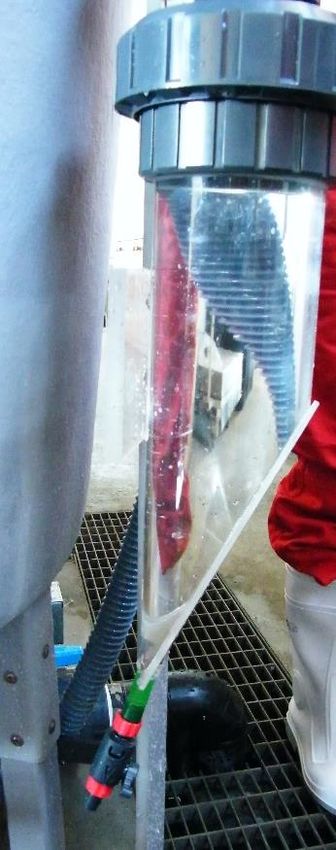
Market development RAS vs FTS 2020
Volume (MT)                                                               % of total market
80 000                                                                                 90.0
                       Total market   RAS           % RAS
70 000                                                                                 80.0

                                                                                       70.0
60 000

                                                                                       60.0
50 000
                                                                                       50.0
40 000
                                                                                       40.0
30 000
                                                                                       30.0

20 000
                                                                                       20.0

10 000                                                                                 10.0

    0                                                                                  0.0
              Norway      UK                Chile           Canada   Australia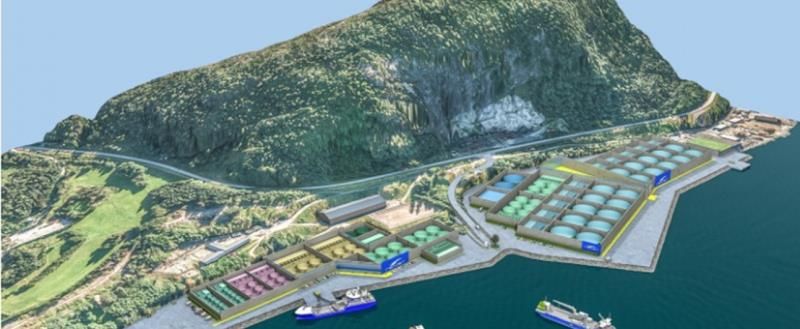
2. Smolt farming future

9
Smolt farming- some examples
14 mill smolt
average size
200g
10 mill smolt average size 300g
5 mill smolt
average size 150g
20 mill postsmolt average size 1000g
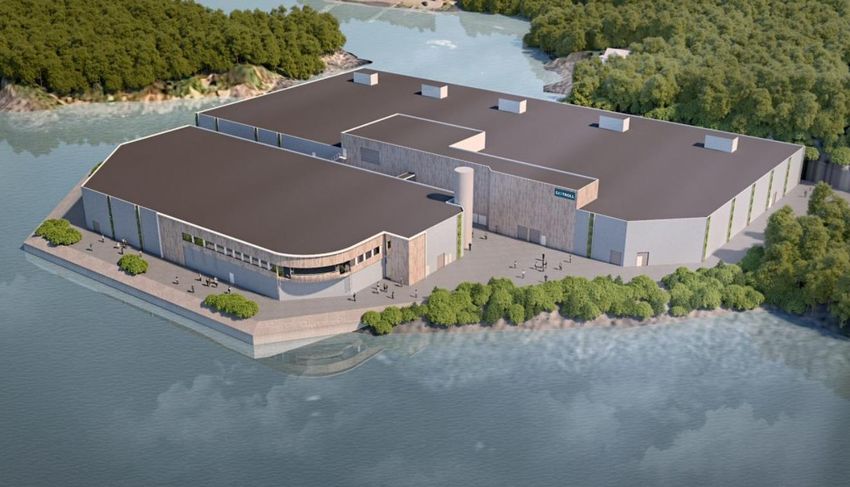
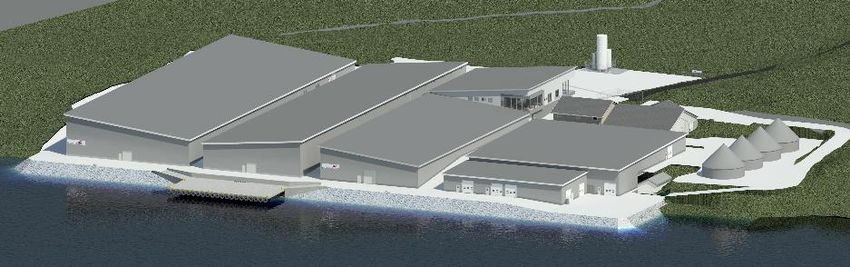
10The targeted segment
Recirculation Aquaculture System
Trends: Moving in the direction of Smolt factories. A few initiatives on full
cycles on land.
Location: Evenly distributed along the coast. Almost all farms with direct
11 access to the sea.Market trend
Smolt prod in
freshwater Shorter time in
sea cages
RAS (0-250 g)
Postsmolt in
Smolt prod in seawater
freshwater Shorter time in
RAS (100- sea cages
RAS (0-100 g) 250/500/750/1
000 g)
Grow out in
Smolt prod in
seawater
freshwater
RAS (100 g – Full cycle on land
RAS (0-100 g)
5.5 kg)
RAS: Recirculation aquaculture system.3. The product 13
The product: Recirc ready
Goal:
To provide the customer with the best possible solution in order to optimize land based
production with high quality smolt as a result.

                                          • First introduced in the market in 2009

                                          • Benefits compared to standard feeds:
                                               •   Improved faeces quality
                                               •   More effective mechanical filtration
                                               •   Reduced load of nutrients to the bio filter

14
4. Research towards 15
Stabilize faeces to improve water quality
• Why?
• «bigger & more stable feces» = better removal in drum filter
• Less faeces= Less leaching = better bio filter efficiency

• Brinker & Koppe et al. 2005; Brinker et al. 2007
• Usage of binders in diets for trout
     •   Trout were fed a control diet and a diet with a indigestible binder
     •   Binders varied in viscosity and concentration
     •   Trials were evaluated based on feces stability, feces scoring, turbidity

16
Results: Size distribution
Pore size of
mechanical filters
Control
Cumulative volume percent
Diet A
Brinker 2007
Particle size (µm)Turbidity measurements • Faeces collected from 1day of feeding • Water + faeces volume adjusted to 500 ml • Placed in 1L non transparent dark brown bottles • Mixing 1 turn and sedimentation for 10 min • Turbidity reading 2 cm below surface • Repeated for 3 days
Turbidity (NTU – nephelometric turbidity unit)
Mean and SD after 3 days sampling

                                     30
                                                                                   b
           NTU 10 min after mixing
                                               b   b   b                               a               b
                                     25
                                          ab               a
                                                                       a                           a
                                     20
                                                               a   a       a               a
                                                                               a
                                     15                                                        a
                                     10

                                     5

                                     0
Faeces scoring system
2 3 4
1
5 6 7 8Faeces score
Average and standard deviation for 6 samples
9
8
7
Faeces score
6
5
4
3
2
1
0
G
Q
G
M
l
J
+M
B
C
D
H
I
+H
%
P
%
%
ol
H
H
3
tr
3
1
C
C
e
0.
0.
le
0.
on
bl
b
G
G
G
K
ta
ta
M
H
H
+S
+S
le
le
le
M
C
ab
ab
ab
St
St
St
All diets with faeces stabilization had a faeces score ≥ 7Evaluation of faeces quality
• Sedimentation columns
X 16
Fine particles %
c
m
X 16 Bigger particles%Proportion
Andel (%) %
10 %
20 %
30 %
40 %
50 %
60 %
70 %
80 %
90 %
100 %
0%
Ko
nt
ro
ll
B
St C
ab
le
M D
St G
0.
Faeces column data
ab
le 3
H %
St
ab G
l 0.
e 3 %
H
G
0.
1
%
H
I
J
K
L
M
N
O
QDocumentation
• RAS (GMA Büsum, single units)
• 2.5 mm feed:
• A: Control
• B: Nutra RC
• 40 trout/tank (1 tank per system)
• 52 g start weight
• 7 weeks
• 8.5% water exchange per day
• No difference in growth and feed intakePhosphorus accumulation
12
PO4
10
Control RC
8
PO4 [mg/L]
6
4
2
0
1 2 3 4 5 6 7
Week
26Nitrogen metabolits
4.0
3.0 NO2-N
NH4-N 3.5 Kontrol
Control
NO2-N [mg/L]
NH4-N [mg/L]
2.5 Control
Kontrol 3.0
2.0 RC
RC 2.5 RC
RC
1.5 2.0
1.0 1.5
0.5 1.0
0.0 0.5
1 2 3 4 5 6 7 0.0
1 2 3 4 5 6 7
Week Week
300
250 Kontrol
Control NO3
NO3-N [mg/L]
200 RC
RC
150
100
50
0
1 2 3 4 5 6 7
27
Week5. Feedback 28
Customer feedback
• Cleaner tanks and more transparent water
• Reduced demand for cleaning of mechanical filters
• Lower and more stable nitrite levels

             Atle Gjøsang
             Grieg Seafood Trosnavåg
Key elements for the customer
Feed
• Digestibility As high Sludge
as possible • Faeces quality Large
• Physical quality As particles in order to
high as possible ensure effective removal
• Cadmium and zinc through the mechanical
Reduced level filtration
• Less need for
flushing and
cleaning of the bio
Bio filter filters.
• Stable levels of • More stable water
ammonium, nitrite and quality conditions.
nitrate. • Models to estimate
• Low levels of organic levels of Phosphorous,
material to ensure high nitrogen and particulate
Animation credit: Akva Group
bio filter activity organic carbon.
• Optimal composition of
micro ingredients
306. Efficiency model freshwater 31
Model calculates

                   Nutrients in
                     faeces

                                  Dissolved
                                  nutrients
Model steps
Development of
protein and fat in
whole body based
on growth
performance
Calculation of amount of Nutrient used
Feed composition & and released
digested & retained nutrients
digestibility during the
and undigested nutrients
(optimized diet) production time
In data Out data
Feed uptake and
growth from growth
model (AQUASIM)Different feed regimes
Standard feed RC
Nitrogen Carbon Phosphorus Nitrogen Carbon Phosphorus
(kg) (kg) (kg) (kg) (kg) (kg)
Faeces 715 5980 492 Faeces 714 5988 492
Filterable 500 4186 343 Filterable 624 5237 429
faeces faeces
Dissolved 2239 9428 112 Dissolved 2241 9430 112
Total 2954 15408 604 Total 2955 15418 604
Return after 2454 11222 261 Return after 2331 10181 175
filtration filtration
∆ nitrogen = - 123 kg
∆ carbon = - 1041 kg
∆ phosphorus = - 86 kg
347. Whats next? 35
Skretting ARCs role in RAS research
• RAS has been focus area long time
• Top priority for R&D
• Soon: own test facilities
       •   Speed up process for having ready new solutions for the market

     Ilaks.no

36
Thanks for your attention! 37
You can also read