Doubling Zalando by 2020 - Keynote Capital Markets Day 2018 - Zalando Corporate

Page created by Andre Norris
 
CONTINUE READING
Doubling Zalando by 2020 - Keynote Capital Markets Day 2018 - Zalando Corporate
Doubling
  Zalando by 2020

        Keynote
Capital Markets Day 2018

        Rubin Ritter

        June 5, 2018
Doubling Zalando by 2020 - Keynote Capital Markets Day 2018 - Zalando Corporate
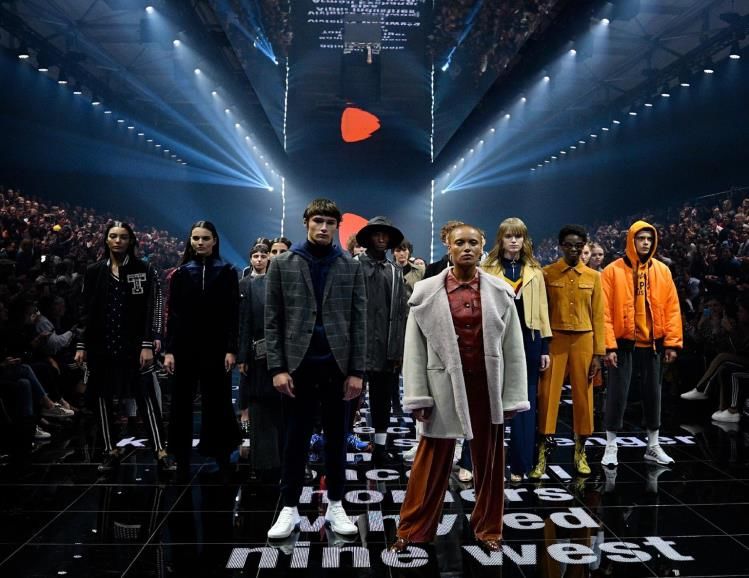
10 amazing years: from an online shoe store to
       Europe’s leading online fashion platform

2
Doubling Zalando by 2020 - Keynote Capital Markets Day 2018 - Zalando Corporate
We constantly adjust our strategy to take our customer proposition to the next level

                                                                         Platform Strategy
                                                    Operational
                           Market & Category        Excellence
                              Expansion
       Market Entry
                                                                            Leveraging
                                                      Building a           infrastructure
                                Fashion             scalable core        beyond wholesale
           Shoes               for Europe
        for Germany

          2008                  2010+                  2013+                Since 2015

3
Doubling Zalando by 2020 - Keynote Capital Markets Day 2018 - Zalando Corporate
Zalando is targeting a massive market opportunity with great potential
                                due to an ever increasing online penetration

              Fashion & Lifestyle (Europe)                                                                                        Consumer Electronics (USA)

                Fashion
                                                              Beauty
                                                                                          Home
                                                                                         Textiles
                                                                                                                                                          41%
                  13%                                              7%                      7%
    1)   Source: Euromonitor International, May 2017, 2017 values based on actuals and estimates; fixed exchange rates. Fashion data incl. apparel and footwear, bags and luggage, jewelry and
4        watches. Beauty data incl. beauty and personal care. Home data incl. home textiles and window covering. All market figures for Europe (excl. Russia) inclusive of sales tax.
Doubling Zalando by 2020 - Keynote Capital Markets Day 2018 - Zalando Corporate
This continued shift from offline to online leads to
        long-term ambition of 5% market share…

                                   Total home textiles market                                    ~ €30bn
                                   Europe
                                                                                                                        Additional
                                                                                                                       opportunities

    ~ 5%                           Total beauty market                                           ~ €80bn
                                   Europe

                                   Total fashion market                                        ~ €420bn
                                   Europe                                                                              Total fashion
                                                                                                                      online potential
                                   2017(a): ~13% online penetration                               ~ €55bn
                                   2022(e): ~30% online penetration                               >€120bn
                                                                                                                       > €120bn

                            1)   Source: Euromonitor International, June 2017, 2017 values based on actuals and
5                                estimates; fixed exchange rates. Fashion data incl. apparel and footwear, bags and
                                 luggage, jewelry and watches. Beauty data incl. beauty and personal care. Home
                                 data incl. home textiles and window covering. All market figures for Europe (excl.
                                 Russia) inclusive of sales tax.
Doubling Zalando by 2020 - Keynote Capital Markets Day 2018 - Zalando Corporate
…and the mid-term goal to double our company by 2020

GMV in €bn                                            ~€10bn GMV
 12
                                                      ~2 x

                                                                         #1
                                                                      FASHION
 6
                                                                    DESTINATION

  0
      2009 2010 2011 2012 2013 2014 2015 2016 2017 2018 2019 2020

      6
Doubling Zalando by 2020 - Keynote Capital Markets Day 2018 - Zalando Corporate
Today, we dive deeper into the core business as the biggest driver of our growth

                                         Zalando Group

     Fashion Store        Lounge / Offprice              zLabels        Emerging Businesses

      Assortment         Demand Generation         Digital Experience      Convenience

7
Doubling Zalando by 2020 - Keynote Capital Markets Day 2018 - Zalando Corporate
Assortment:
                 We offer our customers anything relevant in fashion

                   Assortment expansion
                   supported by Partner Program
    Assortment

                   Driving traffic through an
                   unique assortment mix

                   Launch of new adjacent
                   (sub-)categories

8
Doubling Zalando by 2020 - Keynote Capital Markets Day 2018 - Zalando Corporate
Demand generation:
        We are the top-of-mind fashion destination for the European Consumer

                   Localized merchandizing, product,
     Demand        onsite content and pricing
    Generation

                   Data-driven marketing
                   steering and top-of-mind brand

                   Expansion to new adjacent
                   countries

9
Doubling Zalando by 2020 - Keynote Capital Markets Day 2018 - Zalando Corporate
Digital experience:
                      We aim to build a fully personalized on-site experience

                         Continued optimization based on
                         research and testing
 Digital Experience

                         Next generation digital experience

                         Customer desire to shop mobile
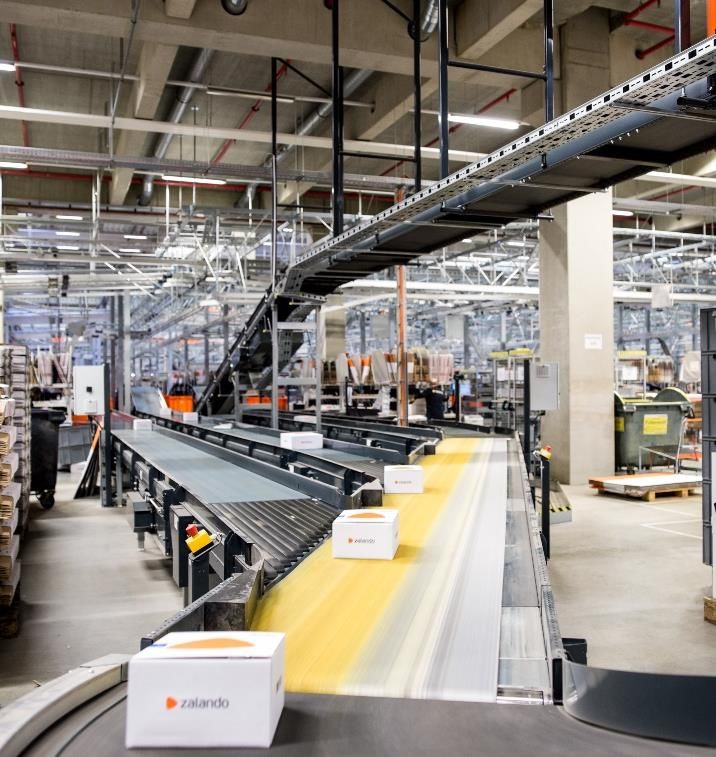
10
Convenience:
      We offer our customers an unmatched level of convenience tailored to fashion

                    Expansion of delivery & return
                    proposition
     Convenience

                    Acceleration of Zalando Fulfillment
                    Solutions

                    Innovation in payment services

11
Value proposition translates into strong traffic levels and high organic traffic share

                                       Site visits                                                Share of organic traffic1

    in                                                                   ~6x every     in %                                   ~2.2bn site visits
billions                                                               European p.a.                                              “for free”

    3                                                               2.6bn                                                83%
                                                                                          85%

                                                                                          80%
    2
                     1.4bn                                                                75%
                                                                                                70%
    1                                                                                     70%

                                                                                          65%

    0                                                                                     60%
                     2014              2015             2016        2017                        2014    2015     2016     2017

 12     1)   Direct type-ins, CRM, Social Media and SEO channels.
Enhanced value proposition leads to larger and more engaged customer base

                                  Active customers                                                                                                         GMV per active customers1

   in                                                                                ~5% of 420m                               in €                                                                        ~23% of
millions                                                                              population                                                                                                          spending2

25 25                                                                        23.1m                                            300 300
                                                                                                                                                                                                  252€
20 20                                                                                                                         250 250

                        14.7m                                                                                                 200 200                   188€
15 15
                                                                                                                              150 150
10 10
                                                                                                                              100
                                                                                                                                      100
 5    5
                                                                                                                                50
                                                                                                                                      50
 0    0                                                                                                                           0
                        2014              2015              2016              2017                                                                       2014              2015            2016    2017

          1)   Defined as the transactional revenue (incl. VAT and transactional volume of Partner Program) after cancellations or returns divided by the number of orders.
     13   2)   Those customers shopping on Zalando spend in total on average around 1,100€ for fashion p.a.; source: Zalando, external onlin e survey, country DE, November 2016. Sample
               description: size = 1,976; non Zalando customers = 70%, Zalando customers = 30%.
We are building a growth engine through a large ever-active customer base

                                                                               Total GMV per cohort1 and order year

                                                                                                                                   2017   Insight #1:
                                                                                                                                          We acquire bigger cohorts over
                                                                                                                                          time
                                                                                                                            2016
                                                                                                                            2016          (2017 cohort contributed ~25%
                                                                                                                                          more than 2014 cohort)
                                                                                2015
                                                                                2015
    GMV from
    2014 cohort                     2014

                                    2013
    GMV from                         -
   earlier cohorts                  2008
Order year
                                     2014                                        2015                                       2016   2017

    14   1)   “Cohort“ refers to customers grouped by the calendar year in which they first placed an order with Zalando.
We are building a growth engine through a large ever-active customer base

                                                                               Total GMV per cohort1 and order year

                                                                                                                                   2017   Insight #2:
                                                                                                                                          Customer churn goes down
                                                                                                                                          over time
                                                                                                                            2016
                                                                                                                            2016          (reduced by ~25% from 2014
                                                                                                                                          to 2016)
                                                                                2015
                                                                                2015
    GMV from
    2014 cohort                     2014

                                    2013
    GMV from                         -
   earlier cohorts                  2008
Order year
                                     2014                                        2015                                       2016   2017

    15   1)   “Cohort“ refers to customers grouped by the calendar year in which they first placed an order with Zalando.
We are building a growth engine through a large ever-active customer base

                                                                               Total GMV per cohort1 and order year

                                                                                                                                   2017
                                                                                                                                          Insight #3:
                                                                                                                                          Spending of old cohorts grows
                                                                                                                            2016
                                                                                                                            2016          continuously over time
                                                                                2015
                                                                                2015
    GMV from
    2014 cohort                     2014

                                    2013
    GMV from                         -
   earlier cohorts                  2008
Order year
                                     2014                                        2015                                       2016   2017

    16   1)   “Cohort“ refers to customers grouped by the calendar year in which they first placed an order with Zalando.
We are building a growth engine through a large ever-active customer base

                                                                               Total GMV per cohort1 and order year

                                                                                                                                   2017
                                                                                                                                          Customer experience drives
                                                                                                                            2016
                                                                                                                            2016          lifetime value over many years

                                                                                2015
                                                                                2015
    GMV from
    2014 cohort                     2014

                                    2013
    GMV from                         -
   earlier cohorts                  2008
Order year
                                     2014                                        2015                                       2016   2017

    17   1)   “Cohort“ refers to customers grouped by the calendar year in which they first placed an order with Zalando.
Today our teams show you how we push our value proposition
                             to double again by 2020

     Assortment       Demand Generation    Digital Experience     Convenience

18
DISCLAIM ER

Certain statements in this communication may constitute forward looking statements. These statements are based on assumptions that are believed to be reasonable at the
time they are made, and are subject to significant risks and uncertainties. You should not rely on these forward-looking statements as predictions of future events and we
undertake no obligation to update or revise these statements. Our actual results may differ materially and adversely from any forward-looking statements discussed in this
presentation due to a number of factors, including without limitation, risks from macroeconomic developments, external fraud, inefficient processes at fulfillment centers,
inaccurate personnel and capacity forecasts for fulfillment centers, hazardous material / conditions in production with regard to private labels, lack of innovation capabilities,
inadequate data security, lack of market knowledge, risk of strike and changes in competition levels.

19
You can also read