XSI - Xeneta Shipping Index August 2021
←
→
Page content transcription
If your browser does not render page correctly, please read the page content below
XSI® - Xeneta Shipping Index August 2021
XSI ® - August 2021
XSI ® - Global
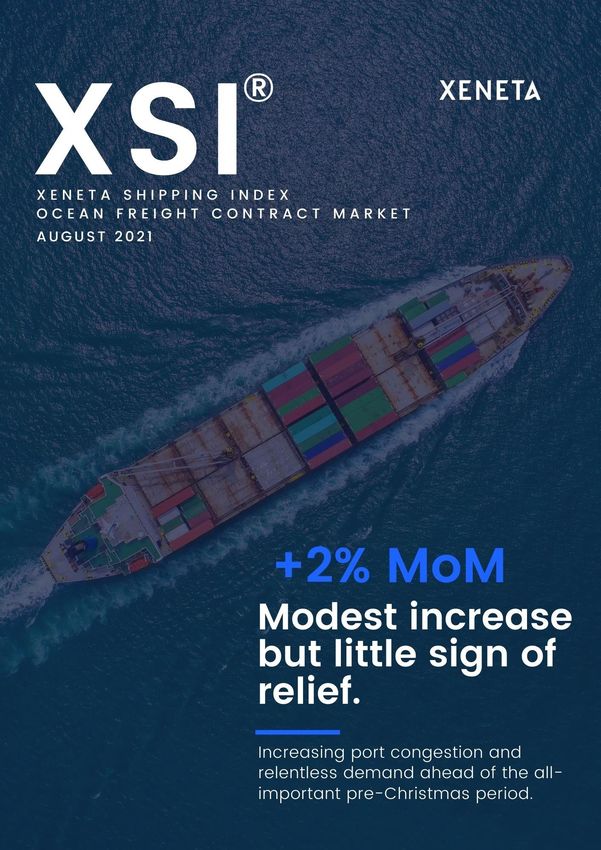
The global XSI ® increased by a modest 2.2% in August to 204.89 points. The month-on-month
gain was much lower than the figure of 28.1% reported in July. However, year-over-year the
index is up 85.5% and has risen by 80.3% since the end of 2020. While the increase in August
was comparatively low compared to previous months, the index has reached yet another all-
time high, with further gains not out of the question in the months ahead.
Fig 1: XSI ® - Global
XSI® - Xeneta Shipping Index July 2021XSI ® - Europe Imports / Exports
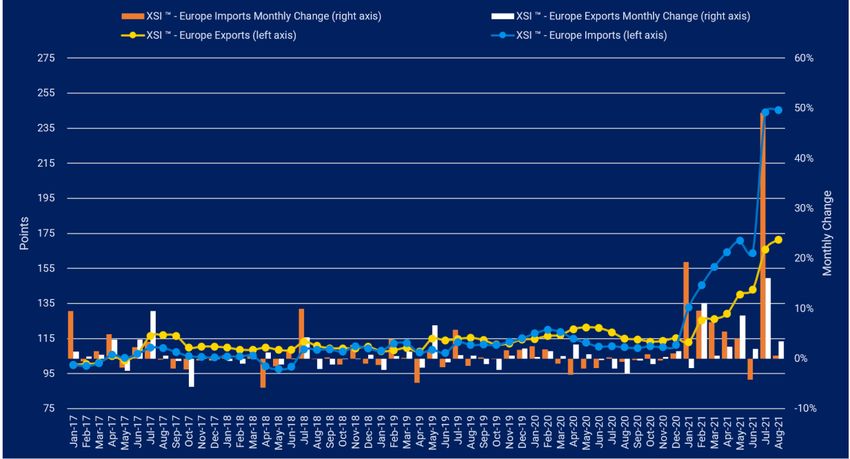
European imports on the XSI ® rose by 0.5% percent in August to 245.30 points. This marks the
ninth increase in the last 12 months and takes the benchmark to 123.0% higher than the
equivalent period of last year. Since the end of 2020, the index has risen by 120.5%. Meanwhile,
exports rose by 3.4% in Aug-21 to 171.43. Like imports, while this represents a reduction in the
pace of growth compared to the previous month, it still represents a new all-time high. The
index is also now 49.1% higher than this time last year and has appreciated by 48.8% since
Dec-20.
The continued woes facing the European trades show no signs of abating with reported
delays of up to a month between the Far East and North Europe. A result of port congestion, a
round trip is now taking approximately 100 days to complete. Subsequently, Maersk recently
advised its customers that wait times at Antwerp are already up to 10 days, with increased
delays at all North European hub ports. Similarly, the CEO of Hapag-Lloyd, Rolf Habben
Jansen, reiterated this point with investors, indicating voyage delays had tripled in the first
half of this year, compared to the same period of 2020. With landside infrastructure simply
overwhelmed and vessels facing prolonged waiting times, boxes are being tied up for
increasingly long periods. The impact has been a breakdown in schedules and shippers have
been advised by the Danish carrier to book containers at least 4 weeks before the winter
holiday season.
Fig 2: XSI ® - Europe Imports / Exports
XSI® - Xeneta Shipping Index August 2021XSI ® - Far East Imports / Exports
Far East imports on the XSI ® increased by a further 0.8% in Aug-21 to 145.46 points. This
represents the fifth consecutive monthly increase and ensures the benchmark is 50.5% higher
than the same period of last year. Compared to the end of 2020, it has risen by 50.9%. Exports
also rose this month, jumping by 2.5% to 256.52. The index continues to reach new all-time
highs and is a whopping 115.3% higher than in Aug-20, while it has appreciated by 103.1% since
the end of last year.
In further signs that elevated rates are filling the coffers of carriers, OOIL recorded a net profit
of $2.8bn for the half-year, representing its best results in the group’s history. Although OOIL
indicated the outlook remains positive, it would not be drawn into making predictions,
suggesting it was impossible to foresee how the market will develop beyond early 2022.
Meanwhile, Zim reported a net profit of $888m in the second quarter, with its profits higher
than the accumulated total recorded over the past five years, a further indication as to how
drastic the turn of events has been. Off the back of the healthy results, the Israeli line is now
eyeing up acquisition opportunities as it looks to expand. Echoing other CEOs, Eli Glickman
suggested exceptionally high freight rates were unlikely to improve soon, with congestion and
higher profits for carriers here to stay.
Fig 3: XSI ® - Far East Imports / Exports
XSI® - Xeneta Shipping Index August 2021XSI ® - US Imports / Exports
US imports on the XSI ® increased by an additional 2.1% in Aug-21 to 199.69 points. Year-on-
year, the benchmark is up 67.2% and is 63.4% higher than at the end of 2020. Meanwhile,
exports rose by 0.6% month-on-month to 105.75. While less severe than US imports, the export
index is still up 16.8% compared to the same period of 2020 and has risen by 19.1% since the
end of last year.
Elsewhere, yet another major shipper has committed to chartering its own vessels to alleviate
supply chain disruptions. Walmart has experienced significant growth during the pandemic,
with US sales expected to be up around 12% for the full year. To ensure the company can
continue to meet this strong demand, the retail giant will utilize the chartered vessels
specifically for its own goods. The disruption can be seen at major ports, with 75% of ships
calling the Port of Los Angeles forced to anchor up in July. However, this figure is reportedly
increasing, as is the number of days held up, which currently stands at 5 days.
Fig 4: XSI ® - US Imports / Exports
XSI® - Xeneta Shipping Index August 2021XSI® - Xeneta Shipping Index August 2021
XSI® Public Indices Report METHODOLOGY

    •    Rates delivered from freight forwarders and shippers
    •    Based on long-term contracts only = any contract that is valid for longer than
         88 days
    •    Rates pulled from Xeneta’s ocean freight platform of +280m contracted rates
    •    Indices based on an aggregation of trade-weighted corridors
    •    Indices rates surcharges are based on all-in CY/CY pricing methodology
    •    Global index is a combination of worldwide trade-weighted corridors not
         limited to US, Europe and Far East indices

Learn More About Xeneta
Learn more about Xeneta and get ocean freight visibility with a freight spend
analysis on your major trade lanes. Find out where you can optimize your freight
procurement strategy and stay one step ahead of the market no matter the current
rate and capacity conditions. Contact Us Here.

DISCLAIMER

The monthly XSI® Public Indices report gives an indication of the global market movements for the long-term contract
market in the container shipping industry focusing on the biggest regions in the world.

Xeneta does not recommend price setting on this market report as it is based on an aggregation of trade-weighted
uncorrelated corridors. If you are interested in index-based contracting, we recommend our XSI® index-linked
contracting product. For more information, please contact us via www.xeneta.com.

          XSI® - Xeneta Shipping Index                                                               August 2021
Xeneta is the leading ocean and air freight rate benchmarking, market analytics platform
and ocean container rate index, Xeneta Shipping Index (XSI®). Xeneta’s powerful reporting
and analytics platform and data density provides liner-shipping stakeholders the insights
they need to understand current and historical market behavior – reporting live on market
average and low/high movements for both short and long-term contracts. Xeneta’s data is
comprised of over 280 million contracted container rates and covers over 160,000 global
trade routes. Xeneta is a privately held company with headquarters in Oslo, Norway and
regional offices in New York and Hamburg. To learn more, please visit www.xeneta.com.
NOTE: The XSI® public indices reports are based on long-term contracts only.
© 2021 Xeneta AS
XSI® - Xeneta Shipping Index August 2021You can also read