Australian Actuaries Climate Index shows a lull in extreme events but a persistent trend in overall climate
←
→
Page content transcription
If your browser does not render page correctly, please read the page content below
Australian Actuaries Climate Index shows a lull in extreme events
but a persistent trend in overall climate
15 July 2020
• The weather has largely returned to typical levels in Australia after a period of extremely
destructive bushfires and storms.
• While the record-breaking extreme high temperatures, dryness and rainfall of the summer have
subsided, a clear long-term trend towards an increasing frequency of extreme weather remains.
• The overall index value for Australia breaks no records in terms of its magnitude, but it is the 19th
consecutive season that has a positive index value for the country as a whole.
• This shows that while extreme weather events do not occur every season, a long-term trend
towards a more extreme climate can be observed.
The Australian Actuaries Climate Index 1 reflects the return to relative normality that we have seen in
the weather over the past season. However, this normality exists within long term trends that signal
an increase in extreme weather. We are observing cyclical weather patterns superimposed on a
long-term increase in several key measures in comparison to the reference period of 1981 to 2010.
The overall index has not been negative for Australia as a whole since 2015, as can be seen in
Figure 1. These increasing trends can be seen particularly strongly in the measures of extreme high
temperature and sea level. Australia has not experienced a below reference period average
extreme high temperature since the spring of 2012, as shown in Figure 2, though the value for the
latest season is close to the reference period average for the first time in several years. The sea level
index has not experienced a below reference period average value since the summer of 2016, as
shown in Figure 3. A positive index means higher measures including extreme temperatures and
higher sea levels.
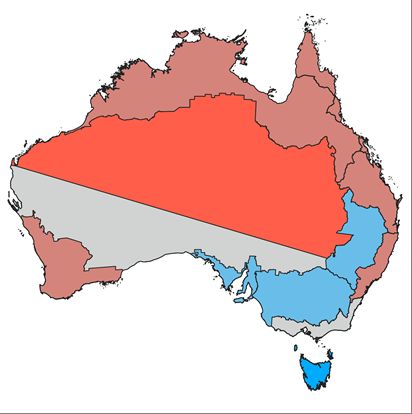
In the Autumn of 2020, multiple regions experienced the first below average extreme high
temperature value in many years. These include the Central Slopes, the Murray Basin, the South &
Southern Western Flatlands (East) and the Southern Slopes (Tasmania), which cover parts of south
eastern Australia (see Figure 4). This aligns with the below average maximum temperatures
observed in the south eastern parts of the country by the Bureau of Meteorology 2.
Extreme rainfall was below the reference period average for most of the country, especially the
north western parts of Australia. Parts of the southeast did experience above reference period
average extreme rainfall. Ex-tropical cyclone Esther struck Victoria on the 5th March, bringing with it
the largest amount of rainfall for March since 1929 3. This is reflected in the index as the 5th highest
extreme rainfall value ever for the Murray Basin region. Consecutive Dry Days was below the
reference period average overall and in most regions, also reflecting an increase in rainfall.
As a whole, Australia experienced the 5th highest sea level value ever and the 17th consecutive
positive value. Sea level tends to fluctuate less dramatically in response to weather cycles than
many of the other index values, instead being influenced by overall sea level rise, storm patterns
and astronomical high tides. The sea level index drove the increase in the overall index this season.
The return to relative normality in weather metrics in Autumn was influenced by the El Niño–
Southern Oscillation (ENSO) and Indian Ocean Dipole (IOD) remaining neutral. However, there are
some early indicators that a La Nina may form in the Spring of 2020, with the Bureau of Meteorology
1
Use the dropdown menus across the top of the website to access graphs displaying results for Australia or for specific
regions and for the AACI or by specific component.
2 http://www.bom.gov.au/climate/current/season/aus/summary.shtml
3 https://watchers.news/2020/03/06/melbourne-flood-march-5-2020/
Page 1 of 5estimating the likelihood at 50%, or twice the normal likelihood 4. This would result in above average
Winter and Spring rainfall in Australia, particularly in the eastern and northern parts of the country. It
is also possible that this increase in rainfall would continue into the Summer.
“The Actuaries Institute recognises that climate change is expected to have major environmental,
economic and social impacts, and poses a serious risk to the industries that actuaries advise," said
Actuaries Institute Chief Executive Elayne Grace. "In particular, the Institute has been developing
an understanding of the cyclical weather patterns and monitoring those patterns to provide
insights into the potential links to natural perils,” Ms Grace said.
The Australian Actuaries Climate Index, which measures extreme weather conditions and sea levels
across Australia, and how these vary over time, was launched in November 2018 and is updated
quarterly. The Index shows changes in the frequency, or rate of occurrence, of extreme high and
low temperatures, heavy precipitation, dry days, strong winds and changes in sea levels.
It is collated at the end of each season following the release of data from the Bureau of
Meteorology. The data is collected nationally and grouped into 12 climatically consistent regions.
Each season is compared to the same season in previous years and against a reference period of
1981-2010.
Footnote: References to temperatures, dryness etc. are based on the data underlying the AACI, which tracks
changes in the frequency of extreme high and low temperatures, heavy precipitation, dry days, strong wind
and changes in sea level, mainly concentrating on the 99th percentile of observations.
A link to the AACI is here. Rade Musulin is available for comment.
For media inquiries please contact:
Michelle Innis
P&L Corporate Communications
m +61(0) 414 999 693
About the Actuaries Institute
As the sole professional body for Members in Australia and overseas, the Actuaries Institute represents the interests of the
profession to government, business and the community. Actuaries assess risks through long-term analyses, modelling and
scenario planning across a wide range of business problems. This unrivalled expertise enables the profession to comment on
a range of business-related issues including enterprise risk management and prudential regulation, retirement income policy,
finance and investment, general insurance, life insurance and health financing.
4http://www.bom.gov.au/climate/enso/outlook/
Page 2 of 5 Institute of Actuaries of Australia
Level 2, 50 Carrington Street
SYDNEY NSW 2000
t +61 (0) 2 9239 6100 f +61 (0) 2 9339 6170
actuaries@actuaries.asn.au І www.actuaries.asn.auFigure 1 – Australian Actuaries Climate Index: Overall Index
Figure 2 - Australian Actuaries Climate Index: Extreme High Temperature
Page 3 of 5 Institute of Actuaries of Australia
Level 2, 50 Carrington Street
SYDNEY NSW 2000
t +61 (0) 2 9239 6100 f +61 (0) 2 9339 6170
actuaries@actuaries.asn.au І www.actuaries.asn.auFigure 3 - Australian Actuaries Climate Index: Sea Level
Notes to charts: Red bars indicate a reading which is above the reference period average and blue bars indicate a reading
which is below the reference period average. The black line shows the five-year moving average and provides a robust
measure of how the index and weather extremes are trending over the longer term. Further details on calculation and
interpretation are available in the Design Documentation here.
Page 4 of 5 Institute of Actuaries of Australia
Level 2, 50 Carrington Street
SYDNEY NSW 2000
t +61 (0) 2 9239 6100 f +61 (0) 2 9339 6170
actuaries@actuaries.asn.au І www.actuaries.asn.auFigure 4 - Australian Actuaries Climate Index:
Regions with Below Average Extreme High Temperature Values
Page 5 of 5 Institute of Actuaries of Australia
Level 2, 50 Carrington Street
SYDNEY NSW 2000
t +61 (0) 2 9239 6100 f +61 (0) 2 9339 6170
actuaries@actuaries.asn.au І www.actuaries.asn.auYou can also read