Housing market overview - Produced 07 October 2020 This document provides the latest information available from various sources, with dates ...
←
→
Page content transcription
If your browser does not render page correctly, please read the page content below
Housing market overview
Produced 07 October 2020
This document provides the latest information available
from various sources, with dates varying from June –
September 2020
Contents
Market overview                                                    3
Summary of published price indices                                 4
UK annual house prices – rate of change                            5
Regional all-dwellings annual house price – 12-month % change      6
UK house-price rates of change: types of buyer                     7
UK house-price rates of change: types of dwelling                  8
Number of housing transactions per month                           9
Monthly asking-price trend                                         10
Home asking-price trend (England & Wales)                          11
Average-time-on-market indicator (National)                        12
UK sales volumes by funding status                                 13
UK house-price-to-earnings ratio                                   14

                                                                        2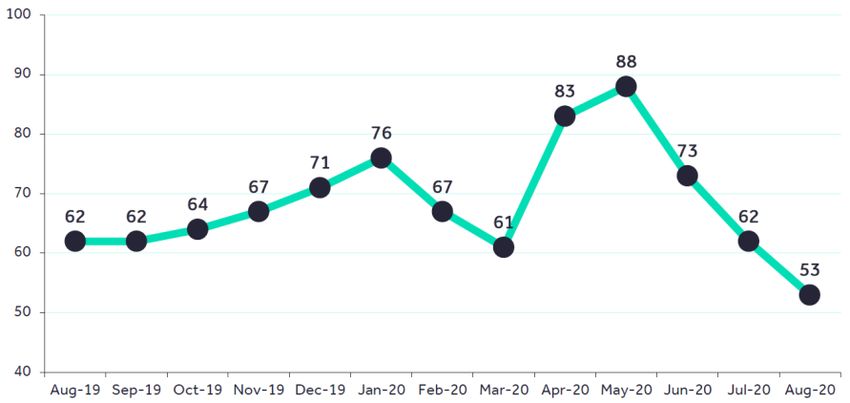
Market overview
Like last month all of our available sources are reporting month-on-month increases in house prices in the range 0.2% to 2.7% (excluding the
latest LSL data, which was not available at time of compilation). And similarly, all of our available sources are recording annual increases ranging
from 2.6% to 7.3%.

Home.co.uk reports that estate agents had another phenomenally busy month in August, taking on even greater amounts of new instructions,
especially in the capital region, east and south east of England. But, fortunately, mortgage approvals have also bounced back to more normal
levels and this will help digest the glut of new stock.

Rightmove reports overall prices have remained steady since they hit a record in July, up by a marginal 0.2% on the month, and up by 5.0%
annually, which is the highest annual growth rate they’ve recorded since September 2016. They say regions outside the south of England have
seen the strongest price jumps, with Yorkshire & the Humber, East Midlands, West Midlands, the north east, north west and Scotland all at new
records.

Halifax says across the last three months they have received more mortgage applications from both first-time buyers and home movers than
anytime since 2008. They say there has been a fundamental shift in demand from buyers, brought about by the structural effects of increased
home working and a desire for more space, while the Stamp Duty holiday is incentivising vendors and buyers to close deals at pace before the
break ends next March.

Nationwide tell us that housing market activity has recovered strongly in recent months. They say mortgage approvals for house purchase rose
from c66,000 in July to almost 85,000 in August - the highest they’ve seen since 2007, and well above the monthly average of 66,000 prevailing
in 2019.

                                                                                                                                                       3
Summary of published price indices
Source website Period covered Monthly change (%) Annual change (%) Average house price Official releases
gov.uk UK house
June ’20 ˄ 2.7 ˄ 3.4 £237,834 16.09.2020
price index
LSL Property
February ’20 ˄ 0.5 ˄ 1.0 £303,189 16.03.2020
Services*
Halifax September ’20 ˄ 1.6% ˄ 7.3% £249,870 07.10.2020
home.co.uk September ’20 ˄ 0.4 ˄ 3.8 £320,190 15.09.2020
Hometrack August ’20 N/A ˄ 2.6 £218,262 28.09.2020
Nationwide September ’20 ˄ 0.9 ˄ 5.0 £226,129 09.2020
Rightmove September ‘20 ˄ 0.2 ˄ 5.0 £319,996 21.09.2020
*August data not available at the time of compiling this report.
4UK annual house prices – rate of change
The average UK house price is
now approaching £250,000 after
September saw a third
consecutive month of substantial
gains. The annual rate of change
will naturally draw attention,
with the increase of 7.3% the
strongest since mid-2016.
Source: Halifax price index
Source: gov.uk price index
5Regional all-dwellings annual house prices – 12-month % change
The best-performing region
is Yorkshire, showing year-
on-year price growth
amounting to an annualised
gain of 8.8%. A more
cautious monthly rise of 0.3%
takes the East of England
(the UK’s worst performing
region) further into positive
growth year-on-year (+1.5%),
although surging supply will
hamper further growth.
Source: home.co.uk price index
Source: gov.uk price index
6UK house-price rates of change: types of buyer
Source: gov.uk price index
…while in the second-stepper sector (three- or four-bedroom homes excluding four-bedroom detached) they
were up by 55%. The first-time-buyer sector of two bedrooms or fewer, although not as strong as the larger
homes sectors, still saw sales agreed up by 36%.
Source: Rightmove price index
7UK house-price rates of change: types of dwelling
Source: gov.uk price index
The trend of up-sizing to a larger home has continued at pace over the past month, leading to record asking
prices in the second-stepper sector, made up of three- or four-bedroom homes. This price record has been
fuelled by buyers looking for more space, including both those who need extra space for their families and those
looking for room to work from home.
Source: Rightmove price index
8Number of housing transactions per month
Source: gov.uk price index
Nationally, sales agreed for the whole year to date are now down by only 5% on the same period last
year. Two regions – the east of England (+4%) and the south east (+1%) – have already overtaken the
number of sales agreed for the same period last year, helped by higher average prices causing the
Stamp Duty holiday to have more of an impact for buyers and sellers in these areas. Unsurprisingly both
Scotland and Wales are in double digit declines as they are still playing catch up from reopening their
housing markets later than England, and are now down by 21% and 16% respectively.
Source: Rightmove price index
9Monthly asking-price trend
Overall prices have remained steady since they hit a record in July, up by a marginal 0.2% on the month, and up
by 5.0% annually, which is the highest annual growth rate recorded since September 2016. Regions outside the
south of England have seen the strongest price jumps, with Yorkshire & the Humber, East Midlands, West
Midlands, north east, north west and Scotland all at new records.
Source: Rightmove price index
10Home asking-price trend for England & Wales Source: home.co.uk price index Few would dispute that the performance of the housing market has been extremely strong since lockdown restrictions began to ease in May. Across the last three months, we have received more mortgage applications from both first time buyers and home movers than anytime since 2008. There has been a fundamental shift in demand from buyers, brought about by the structural effects of increased home working and a desire for more space, while the stamp duty holiday is incentivising vendors and buyers to close deals at pace before the break ends next March. Source: Halifax price index 11
Average-time-on-market indicator – National

The average number of days to agree a sale in London is now 49, a significant 20 days shorter than at this time last year.
Nationally, the average time to secure a buyer has dropped from 62 days in August 2019 to 53 this August.

Source: Rightmove price index

                                                                                                                             12
UK sales volumes by funding status
Source: gov.uk price index
We’re hearing of challenges at all steps of the buying and selling process, including lenders having to deal with a
higher number of mortgage applications and solicitors over their capacity, and we estimate there are nearly
40% more sales currently going through than at this time last year.
Source: Rightmove price index
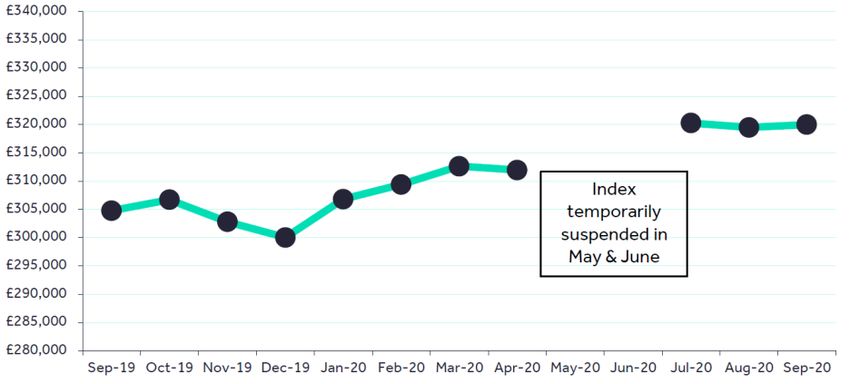
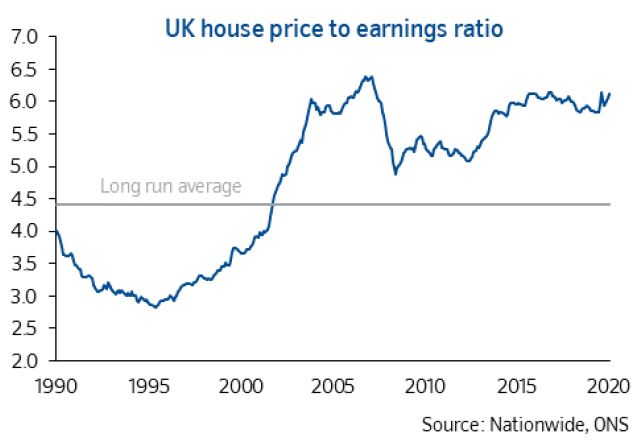
13UK house-price-to-earnings ratio
Younger people were much more
likely to have put off plans than older
people, which may reflect concerns
about employment prospects.
Indeed, most forecasters expect
labour market conditions to weaken
significantly in the quarters ahead as
tighter restrictions dampen
economic activity and the furlough
scheme winds down. While the
recently announced jobs support
scheme will provide some assistance,
it is not as comprehensive as the
furlough scheme it replaces.
Source: Nationwide price index
Source: Nationwide price index
14Did you find this useful?
You can receive this report directly into your inbox each month by signing up at
mms-marketing.co.uk/contact.
Got feedback?
If there’s anything you think we can be doing better with this report we’d love to hear
from you. You can email us at hello@mms-marketing.co.uk with any feedback.
15You can also read