NRas slows the rate at which a model lipid bilayer phase separates: Electronic Supplementary Information (ESI)
←
→
Page content transcription
If your browser does not render page correctly, please read the page content below
Electronic Supplementary Material (ESI) for Faraday Discussions.
This journal is © The Royal Society of Chemistry 2014
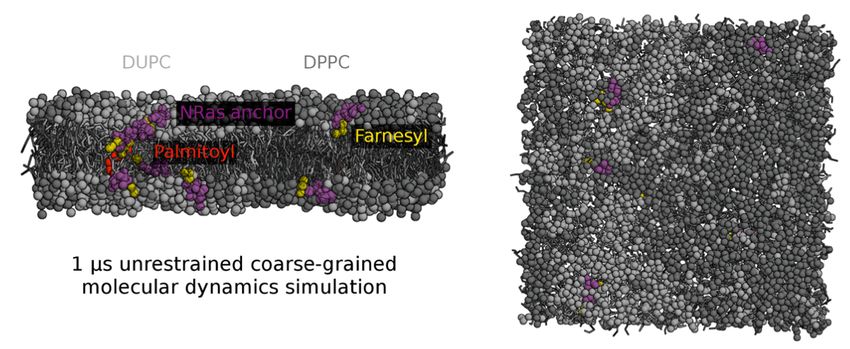
NRas slows the rate at which a model lipid
bilayer phase separates:
Electronic Supplementary Information (ESI)
Elizabeth Jefferys, Mark S. P. Sansom and Philip W. Fowler⇤
Supplementary Methods - Parametrisation of the Farnesyl group
We first retrieved the lowest energy conformer of farnesyl methyl
ether from the PubChem database (CID 5365855). 1 A library of
5 858 low-energy conformations was generated using Confab. 2 The
centre of mass of the three isoprene units in each conformer was
calculated and the angle q between them measured (Fig. S1). The
farnesyl beads were then positioned at the centres of mass of each
isoprene unit in the lowest energy conformer to generate a start-
ing farnesyl structure with a more realistic staggered conformation.
The beads are joined via a harmonic bond of length 3.9 Å and force
constant 50 kJ mol 1 Å 2 to the Cys186 side chain particle in the
palmitoylated NRas anchor model. Eight copies of this dually lipi-
dated construct (four per leaflet) were inserted into a symmetric bi-
layer comprised of 751 DPPC, 450 DUPC and 299 cholesterol and
the system solvated, populated with Na+ and Cl ions to a total
concentration of 0.15 M and subject to 5000 steps steepest descent
energy minimisation.
A series of simulations were carried out using this test system in
order to deduce appropriate parameters for the farnesyl group. In
the Martini model for DUPC, the C4 particle type is used instead
of C1 to mimic the more polar nature of double as compared to sin-
gle bonds. 3 Following this line of thinking, both C3 and C4 beads
were tested for use in the farnesyl model, in addition to a range of
equilibrium bond angles
This test system was also employed to assess the elected method
for modelling carboxymethylation; conversion of C-terminal back-
bone bead from Qa particle type with -1 charge to Na with no net
charge. Two simulations were set up to test this; in one the C-
Department of Biochemistry, University of Oxford, South Parks Rd, Oxford, OX1 3QU, UK. Fax: +44
1865 613 201; Tel: +44 1865 613 200; E-mail: philip.fowler@bioch.ox.ac.uk
1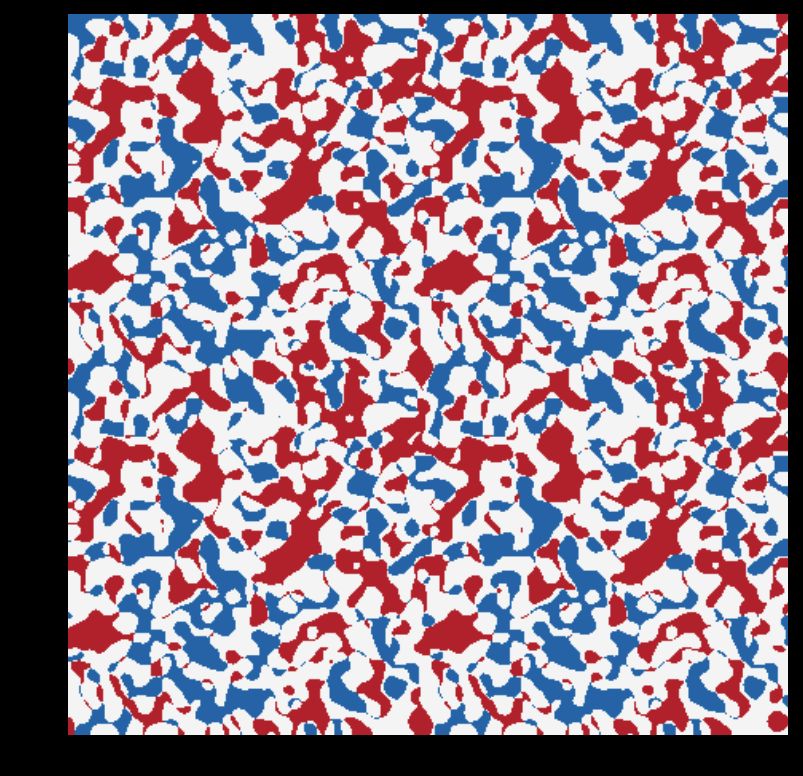
terminus was unmodified whereas in the other it was methylated us-
ing the afore mentioned conversion. The system was simulated for
1 µs, and the angle q in the resulting simulations was measured us-
ing the Python-based MDAnalysis tools. 4 The distributions suggest
that a bond angle of 125 degrees is optimal. Additionally, devel-
opment of AT farnesyl parameters is an important next step, which
would facilitate the examination of farnesylated proteins such as
Ras in more detail.

References
1 E. E. Bolton, Y. Wang, P. A. Thiessen and S. H. Bryant, in Annual Reports in Computational
  Chemistry, American Chemical Society, Washington, 2008, vol. 4, ch. 12, pp. 217–241.

2 N. M. O’Boyle, T. Vandermeersch, C. J. Flynn, A. R. Maguire and G. R. Hutchison, J Cheminfor-
  matics, 2011, 3, 8.

3 H. J. Risselada and S. J. Marrink, Proc Natl Acad Sci U S A, 2008, 105, 17367–72.

4 N. Michaud-Agrawal, E. J. Denning, T. B. Woolf and O. Beckstein, J Comput Chem, 2011, 32,
  2319–2327.

                                                                                             2
a

                        1µs unrestrained molecular dynamics

                   Library of 5,858 low-energy farnesyl
          b              methyl ether conformers                           c    Measure θ

          d   Compare distributions of θ
                                                                 0.08
           0.06         C3-110°                                                C4-110°
                                                                 0.06
                                                                                                             from library
           0.04
                                                                 0.04

           0.02
                                                                 0.02

               0                                                    0
                                                                 0.08
           0.08          C3-115°                                               C4-120°
                                                                 0.06
           0.06

                                                                 0.04
           0.04

           0.02                                                  0.02

              0                                                     0
           0.08                                                  0.08

                        C3-125°                                                C4-125°
           0.06                                                  0.06

           0.04                                                  0.04

           0.02                                                  0.02

               0                                                      0
                   40      60      80   100   120   140   160   180       40    60       80   100      120   140   160      180
                                                                                                    θ (°)

Fig. S1 Procedure for determining Workflow showing how the image processing
techniques are applied to each lipid bilayer. (a) The sparse arrays showing where the
phosphate beads of the unsaturated and saturated lipid species are convolved with a
Gaussian of width 4.1 Å. The difference of these two arrays identifies qualitatively the Lo
and Ld regions. If we identify any pixel with a value > 0 as belonging to the Ld phase
and the remainder the Lo phase, then we generate a mask. Applying the Canny edge
detection algorithm identifies the interface between the two phases. (b) For comparison
an image rendered by VMD of the same data is shown. (c) We can create the surface of
each leaflet by interpolating between the coordinates of the lipid phosphate beads. The
difference of these arrays naturally gives us the thickness of the bilayer. For simplicity
we have not shown the proteins, but a similar procedure can be applied to the coordinates
of their centres of mass to create arrays of their ‘density’.
                                                                                                                                  3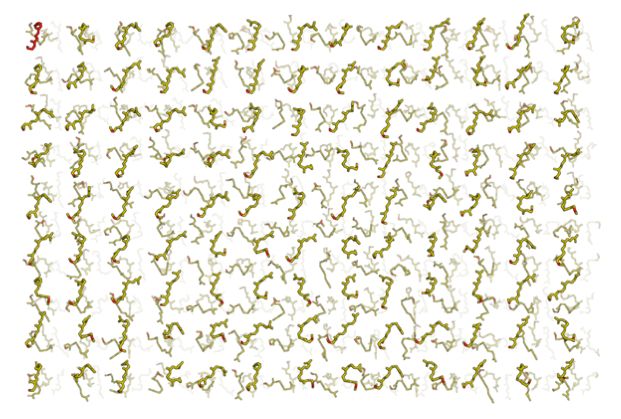
t = 0 µs                    1 µs       2 µs       3 µs        4 µs              5 µs
  a

                                Lo    Ld
                                                                                upper leaflet

                                                                                lower leaflet

  b

                                                                                         sum

                          0.6
         c
                                                                      both leaflets Lo
             Proportion

                          0.4                                         both leaflets Ld

                          0.2
                                                                      leaflets different phases

                           0
                                 0          1   2      3     4    5     Time (µs)

Fig. S2 The 5:3:2 DPPC:DUPC:cholesterol mixture in the second of the three control
bilayer simulations also phase separates and the two leaflets are highly correlated. For
the legend, see Fig. 4. in the main body of the manuscript

                                                                                                 4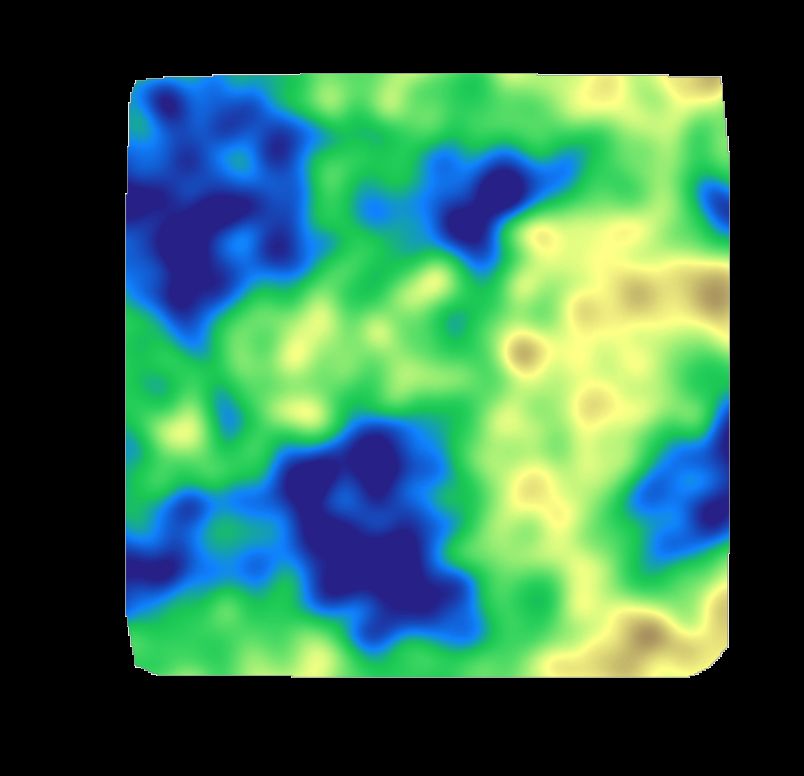
t = 0 µs                    1 µs       2 µs       3 µs          4 µs              5 µs
  a

                                Lo    Ld
                                                                                  upper leaflet

                                                                                  lower leaflet

  b

                                                                                           sum

                          0.6
         c
                                                                        both leaflets Lo
             Proportion

                          0.4                                           both leaflets Ld

                          0.2
                                                                        leaflets different phases

                           0
                                 0          1   2      3     4      5     Time (µs)

Fig. S3 The 5:3:2 DPPC:DUPC:cholesterol mixture in the third of the three control
bilayer simulations also phase separates and the two leaflets are highly correlated. Note
that the stripes have formed left-right, rather than top-down in this case. For the legend,
see Fig. 4. in the main body of the manuscript

                                                                                                   5
Proportion of cholesterol

                                              1
                                                                                           Lo

                                             0.5                       control sim 1

                                                                                           Ld
                                              0
                                                   0   1   2           3         4     5

                                              1
                                                                                           Lo

                                             0.5                       control sim 2

                                                                                           Ld
                                              0
                                                   0   1   2           3         4     5

                                              1
                                                                                           Lo

                                             0.5                       control sim 3

                                                                                           Ld
                                              0
                                                   0   1   2           3         4     5

                                                           Time (µs)

Fig. S4 Cholesterol partitions mainly into the Lo phase. The proportion of cholesterol
that partitions into each phase is show for the three control lipid bilayer simulations. In
all cases, ⇠85 % of cholesterol ends up in the Lo domain after 5 µs.

                                                                                                6
t = 0 µs                  1 µs   2 µs       3 µs       4 µs             5 µs
  a

   b
                        50
        Thickness (Å)

                                                                   both leaflets Lo
                                                                   all lipids
                        40                                         both leaflets different
                                                                   both leaflets Ld
                        30

                             0      1   2      3          4    5         Time (µs)

        c               50
                                                                       both leaflets Lo

                        40                                              all lipids

                                                                         both leaflets Ld
                        30

Fig. S5 The ordered phase is thicker than the disordered phase in the second of the three
control bilayer simulations. For the legend, see Fig. 5. in the main body of the
manuscript

                                                                                            7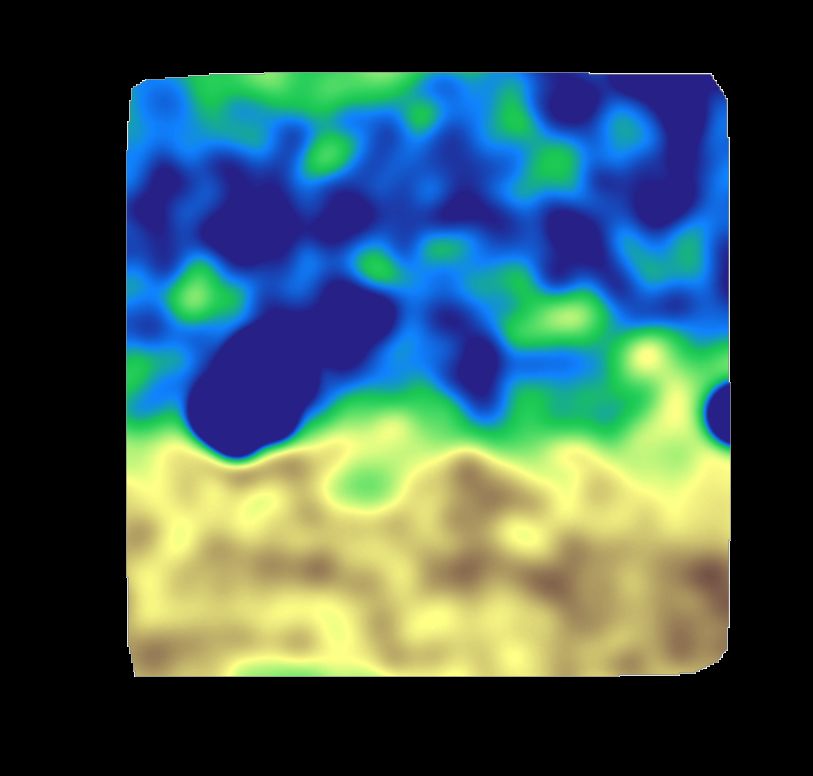
t = 0 µs                  1 µs   2 µs       3 µs       4 µs             5 µs
  a

   b
                        50
        Thickness (Å)

                                                                   both leaflets Lo
                                                                   all lipids
                        40                                         both leaflets different
                                                                   both leaflets Ld
                        30

                             0      1   2      3          4    5         Time (µs)

        c               50
                                                                       both leaflets Lo

                        40                                              all lipids

                                                                         both leaflets Ld
                        30

Fig. S6 The ordered phase is thicker than the disordered phase in the second of the three
control bilayer simulations. For the legend, see Fig. 5. in the main body of the
manuscript

                                                                                            8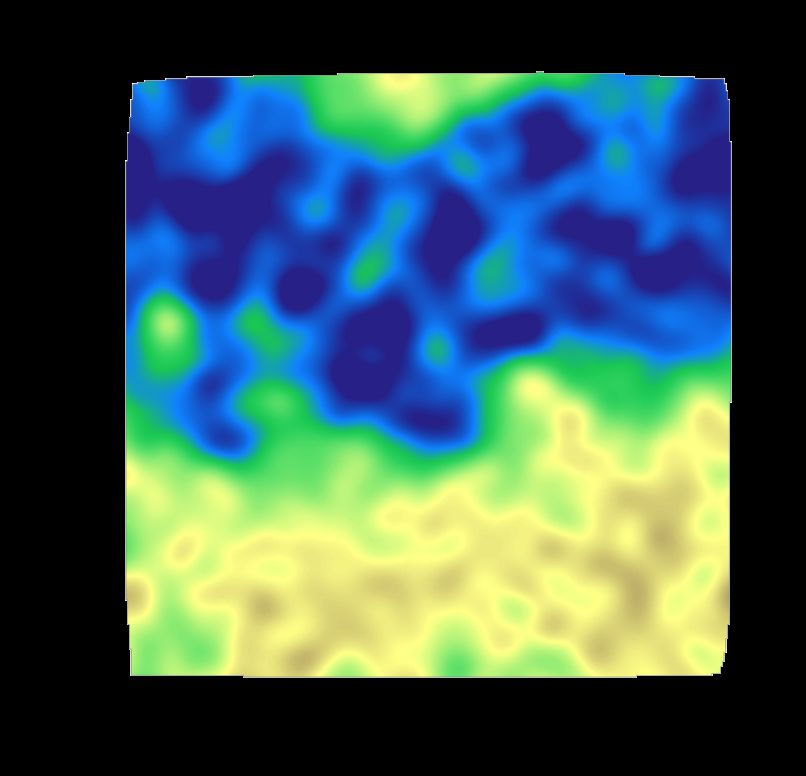
t = 0 µs
  a                     1 µs         2 µs          3 µs          4 µs          5 µs

                                                                                      upper leaflet
                   Lo     Ld

                                                                                      lower leaflet
        t = 0 µs
  b                     1 µs         2 µs          3 µs          4 µs          5 µs

                                                                                      upper leaflet
                   Lo     Ld

                                                                                      lower leaflet
        t = 0 µs
  c                     1 µs         2 µs          3 µs          4 µs          5 µs
                                                                                      upper leaflet
                   Lo     Ld
                                                                                      lower leaflet

Fig. S7 Images from the three simulations with ten NRas proteins in each leaflet. The
ordered and disordered domains are coloured red and blue, respectively, whilst the
proteins are depicted as white circles.

                                                                                                 9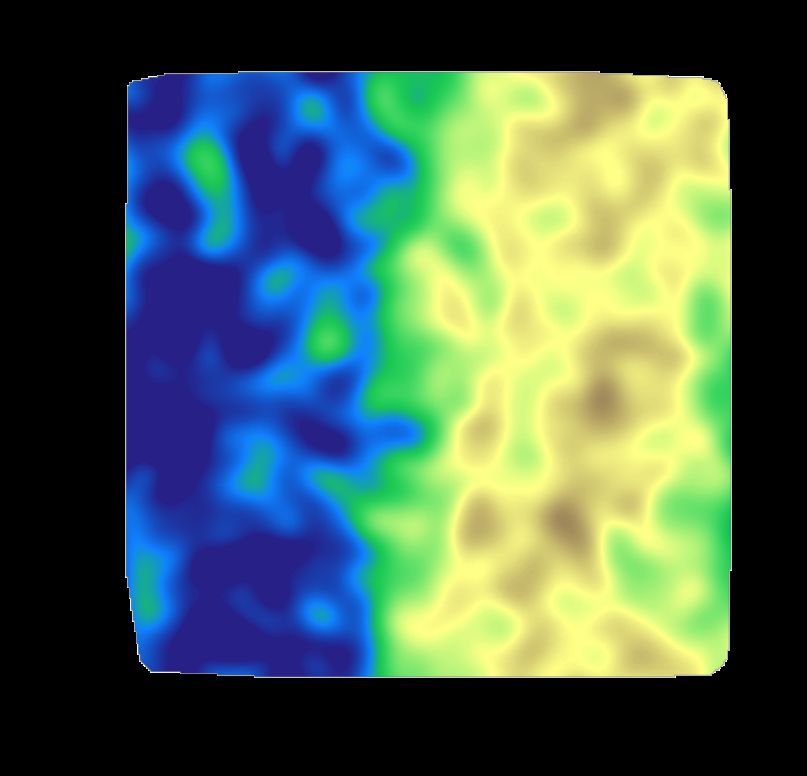
a                                    16384
                 Total length of interface (Å)

                                                                                 + NRas
                                                  8192

                                                  4096
                                                                            Control

                                                  2048

                                                  1024
                                                         0.25         1                   4
                                                                Time (µs)

            b                                    16
             Average domain radius (Å)

                                                  8
                                                                            Control

                                                  4
                                                                               + NRas

                                                  2

                                                  1
                                                      0.25          1                     4
                                                                Time (µs)

Fig. S8 Log-log plots of how (a) the total length of the interface and (b) the average
domain size vary with time. These suggest that there may be two different regimes, with
a boundary at around 2-3 µs.

                                                                                              10
upper leaflet lower leaflet
a 10 10
Ld
Number of NRas
5 5 interface
Lo
0 0
0 1 2 3 4 5 0 1 2 3 4 5
b 10 10
Number of NRas
5 5
0 0
0 1 2 3 4 5 0 1 2 3 4 5
c
10 10
Number of NRas
5 5
0 0
0 1 2 3 4 5 0 1 2 3 4 5
Time (µs) Time (µs)
Fig. S9 NRas localises to the interface between the Lo and Ld domains. A protein is
defined as belonging to one of the two phases if the 20 Å footprint of the protein contains
> 80% of one phase or the other, otherwise it is categorised as interfacial. The first panel
is identical to Fig. 7b in the main body of the manuscript.
11You can also read