Centre for Applied Climate Sciences Climate Outlook Review - Northern Australia November 2020 Authors: Prof Roger C Stone & Dr Chelsea Jarvis - NACP
←
→
Page content transcription
If your browser does not render page correctly, please read the page content below
1

Centre for Applied Climate Sciences

Climate Outlook Review –
Northern Australia

November 2020

Authors: Prof Roger C Stone
& Dr Chelsea Jarvis

2
Overview
This is a review and opinion of various seasonal and other forecast systems
currently available from a range of sources, from Australia and internationally.
La Niña has become fairly well established in the central and eastern Pacific and
the sea-surface temperatures in the Coral Sea are now above normal. For most
of Northern Australia for the coming season and beyond, the various models
(statistical and GCM) are indicating fairly high rainfall probability values for
exceeding the median, especially for the north east. However, as always, we
recommend frequent checking of the situation (from month to month) to make
sure this particular pattern is following this process.
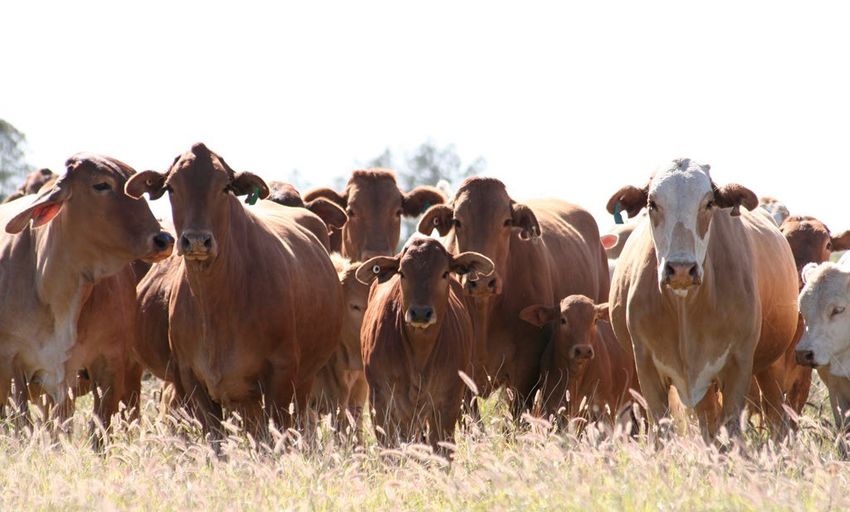
In terms of three-month total rainfall, the SOI phase system for the end of
October shows the SOI phase as “consistently positive”. For this November to
January period, this equates to a relatively high probability (~70-80%
probability or higher) of exceeding of the long-term median rainfall relative to
this time of the year for much of northern and eastern Australia, increasing to
80% to 90% probability of exceeding median rainfall for parts of NE Qld (also
see “the LongPaddock” web site).
The UK Met Office is forecasting above normal rainfall values (60% to 80%
dijof exceeding the long-term median) through, at this stage, to April
probability
2021.
The ECMWF model is indicating 70%-80% probability of exceeding median
rainfall through to at least the end of April 2021 especially for eastern Qld.
The Bureau of Meteorology ACCESS model is indicating a high probability of
‘above average’ rainfall probability values (~80% probability of exceeding the
median) for almost all of Australia.
The MJO is due to cross our longitudes around late November and indirectly
impact our regions.
The average Southern Oscillation Index (SOI) value for the month of October
was close to plus 4.6 (+4.6).
Please note the forecast pasture growth map (Queensland Government: “DES”)
that utilises the integrated SOI phase system and a pasture growth model.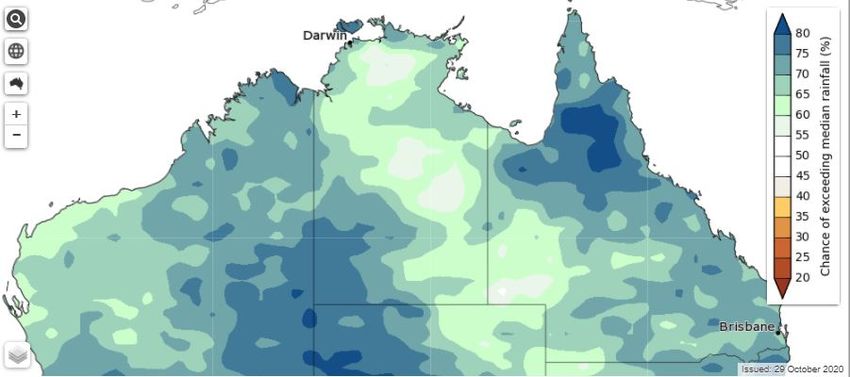
3

Figure 1: The SOI phase system showing the ‘probability of exceeding median rainfall’
values for Australia for the overall period November 2020 to January 2021 based on a
‘Consistently Positive Phase’ SOI pattern during October. Regions shaded darker blue
have 70-90% probability of exceeding median rainfall. Regions shaded lighter blue have
a 60%-70% probability of exceeding median rainfall, relative to this time of the year.
Regions shaded darker grey have 50-60% probability of exceeding median rainfall.

Figure 2: Chances of exceeding median pasture growth for the November 2020 to
January 2021 period (relative to this period of the year). This output integrates
antecedent moisture and forecast rainfall, temperature, within a pasture growth model
and the SOI phase forecast system.
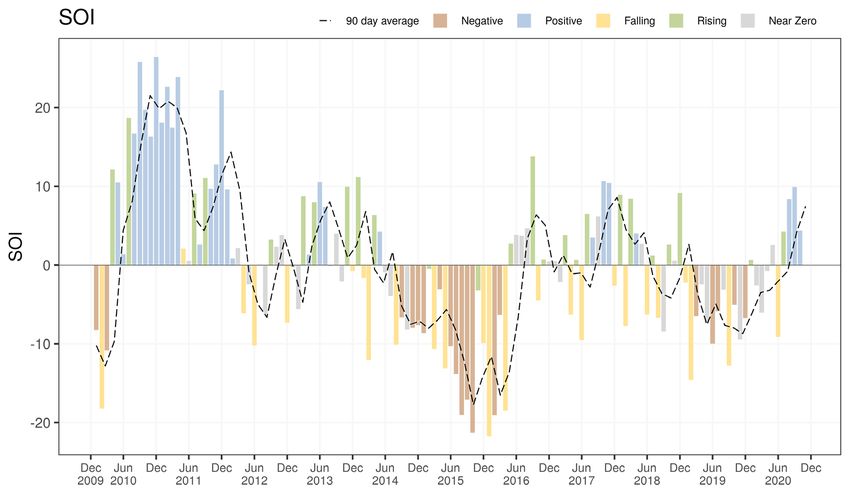
4

The Southern Oscillation Index:

The Southern Oscillation Index (SOI) is an index based on the difference between
surface pressure anomalies between Tahiti and Darwin.
The SOI phases (constructed using principal components and cluster analysis) consists
of five different categories that take into account both rate of change and consistency
in the SOI.

Figure 3: Monthly SOI values since December 2009 – the most recent phase was
‘Consistently Positive Phase’. The most recent 30-day average value to 31 October
2020, was close to plus 4.6 (+4.6).
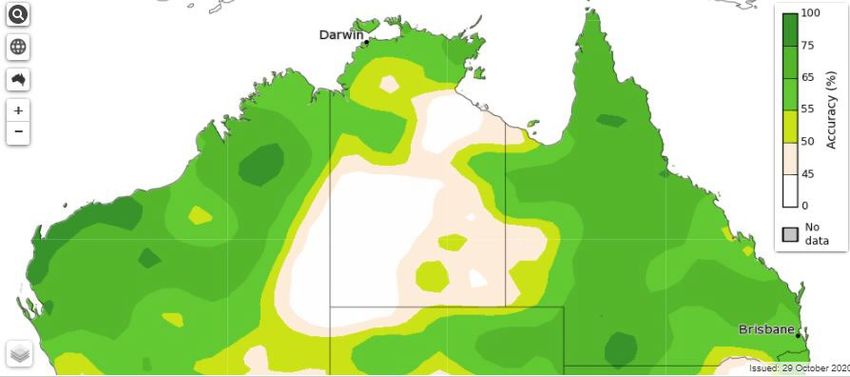
5

Australian Bureau of Meteorology forecasts:

 Figure 4: Bureau of Meteorology Updated Forecast ‘Chance of exceeding
 median rainfall’ probability values for northern Australia for the overall period
 November 2020 to January 2021.

 Figure 5: Bureau of Meteorology Past accuracy of rainfall from November 2020
 to January 2021, indicating how accurate past rainfall forecasts have been for these
 months.

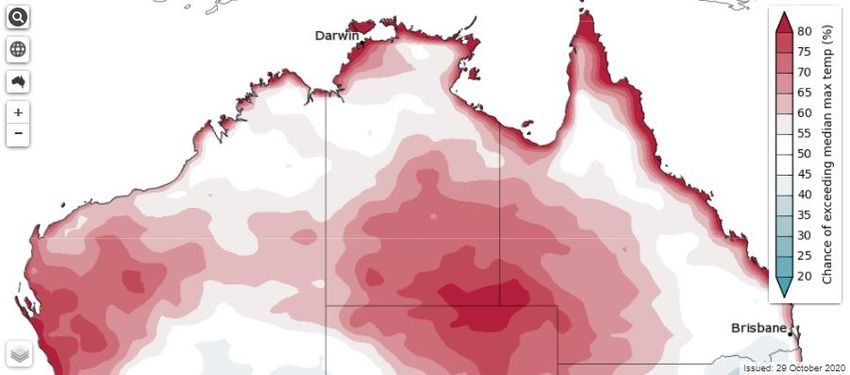
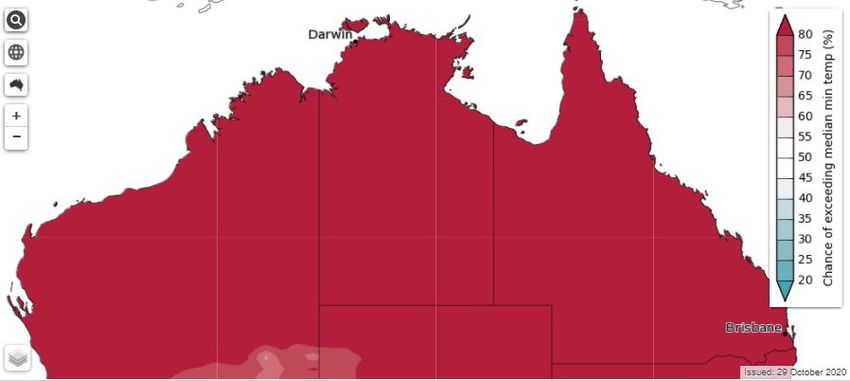
6

Figure 6: Bureau of Meteorology Forecast ‘Chance of exceeding median
maximum temperatures’ for northern Australia for the overall November 2020 to
January 2021. Many regions of northern Australia are now showing at least 50%
chance of exceeding median maximum temperatures. Regions of inland southern
QLD show around 30-40% chance of exceeding median maximum temperature.

Figure 7: Bureau of Meteorology Forecast ‘Chance of exceeding median
minimum temperatures’ for northern Australia for the overall period November
2020 to January 2021. Many regions of northern Australia show at least 80%
chance of exceeding median minimum temperatures. Regions of western WA show
around 60% chance of exceeding median minimum temperature.
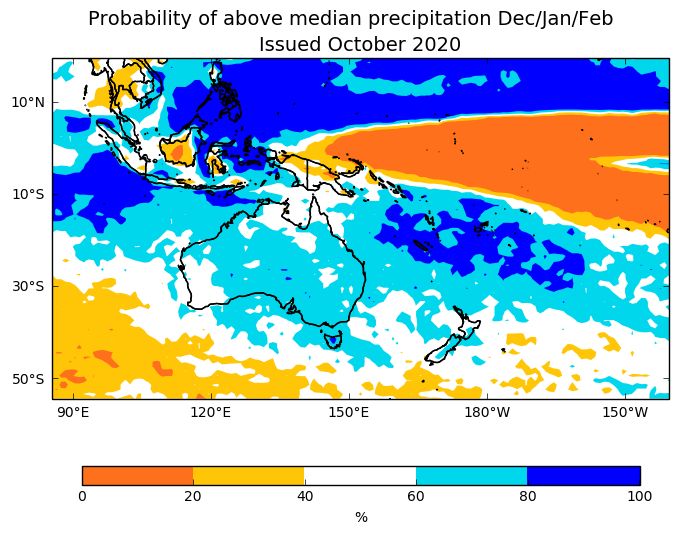
7

Longer-term forecasts:

The UKMO and ECMWF models provide useful assessments of longer-term rainfall
probability values for northern Australia. The UKMO example below suggests about
a 60-80% chance of above Median rainfall for December 2020 to February 2021
for those regions shaded lighter blue.

Figure 8: UKMO forecast map: Probability of getting above median precipitation for
the total period December 2020 to February 2021. Regions shaded lighter blue have a
60-80% probability of above median precipitation. Regions shaded white have a 40-
60% probability of above median precipitation.
8

Figure 9: ECMWF forecast rainfall probability values for northern and eastern
Australia – and the region generally for February to April 2021. (Courtesy ECMWF).
Some regions of northern and especially central Australia indicate a 60%-80%
probability of above median rainfall for this seasonal period, summer/autumn 2021.
9

Explaining the differences between models:

Dynamical models use the current state of the oceans and atmospheres combined with
our understanding of the physical processes behind weather and climate to forecast
the likelihood of future rainfall. Each dynamical model is based on certain model
calibrations, which differ from model to model, providing slightly different outcomes.
Statistical models use historical climate data to determine when conditions were
similar in the past and what rainfall resulted from those past conditions.
While all of the models may be slightly different, it is important to focus on the overall
predicted outcomes. All three of the models presented here show that there is an
average to below average likelihood of receiving median rainfall when assessed over
a three month period.

El Niño-Southern Oscillation (ENSO)

ENSO events generally begin in the Southern Hemisphere winter, peak during summer,
and then usually end during autumn. The El Niño phase is often associated with
warmer and drier conditions while La Niña phases are often associated with cooler and
wetter conditions. The main areas of Australia impacted by ENSO phases are the
eastern seaboard, north-eastern Australia and south-eastern Australia.
10

Madden Julian Oscillation (MJO)

MJO impacts weather in tropical Australia (and occasionally in higher latitude areas)
on a weekly to monthly timescale. According to BoM‘s and NOAA’s forecasting system
and USQ’s analysis. The Madden Julian Oscillation (MJO) is due to cross our longitudes
around late November. Please also refer to the interesting NOAA website (last page of
this review) for updated information on the MJO.

                                                                                  Our region

Figure 10: MJO phase diagram for 1 to 15 November 2020. The purple line for
September, the red line for October. The numbers indicate the day of the month.
When the line is in the circle, it indicates a weak/inactive MJO phase and when the
line is outside of the circle, the MJO is active with strength indicated by distance from
circle. The area shaded in grey containing yellow lines indicates the ensemble plume
prediction for 1 to 15 November 2020 with the green line showing the (ensemble)
mean.
11 Recent SOI-phase forecast maps As these forecasts are issued for a three-month validity on a rolling monthly basis, it has been decided to provide a continuous reference to these forecasts, as below: Seasonal climate forecast valid Seasonal climate forecast valid 1 November 2020 to 31 January 2021 1 October to 31 December 2020 Seasonal climate forecast valid Seasonal climate forecast valid 1 September to 30 November 2020 1 August to 31 October 2020 Seasonal climate forecast valid Seasonal climate forecast valid 1 July to 30 September 2020 1 June to 31 August 2020
12

For further information, click on the following links:
   •   For the MJO

   •   For weekly SSTs

   •   For easterly (and westerly) wind anomalies across the Pacific

   •   For sub-surface temperatures across the Pacific

   •   For ECMWF forecast products (note the web site for this output has
       changed)

   •   For ‘plume’ forecasts of SSTs in the central Pacific

   •   For a complete history of the SOI

   •   The Long Paddock

   •   Additional information on ENSO

                                 USQ Research
                      Centre for Applied Climate Sciences

                       Please email Prof Roger Stone at
                           roger.stone@usq.edu.au

  This work is currently funded by Meat and Livestock Australia Donor
 Company, the Queensland State Government through the Drought and
Climate Adaptation Program and the University of Southern Queensland
You can also read