Australian Actuaries Climate Index reflects devastating Summer bushfires and storms
←
→
Page content transcription
If your browser does not render page correctly, please read the page content below
Australian Actuaries Climate Index reflects devastating Summer
bushfires and storms
4 May 2020
• Records set across Summer for extreme high temperatures and consecutive dry days.
• Extreme wind levels and consecutive dry days for parts of NSW were the highest ever.
• Fire and storms caused significant losses.
• The combination of extreme heat, dryness and wind resulted in the third highest climate index
value for Australia.
• Greater Sydney dam levels rose from historically low levels at 44.1%, to 64% capacity in a single
day.
The Australian Actuaries Climate Index 1 reflects the extreme weather conditions that enabled the
destructive bushfire season that resulted in $2.3 billion of insurance losses and claimed 34 lives over
the Summer of 2019 and 2020 2. It also reflects the extreme rainfall that accompanied severe hail in
ACT, NSW, and VIC, in late January.
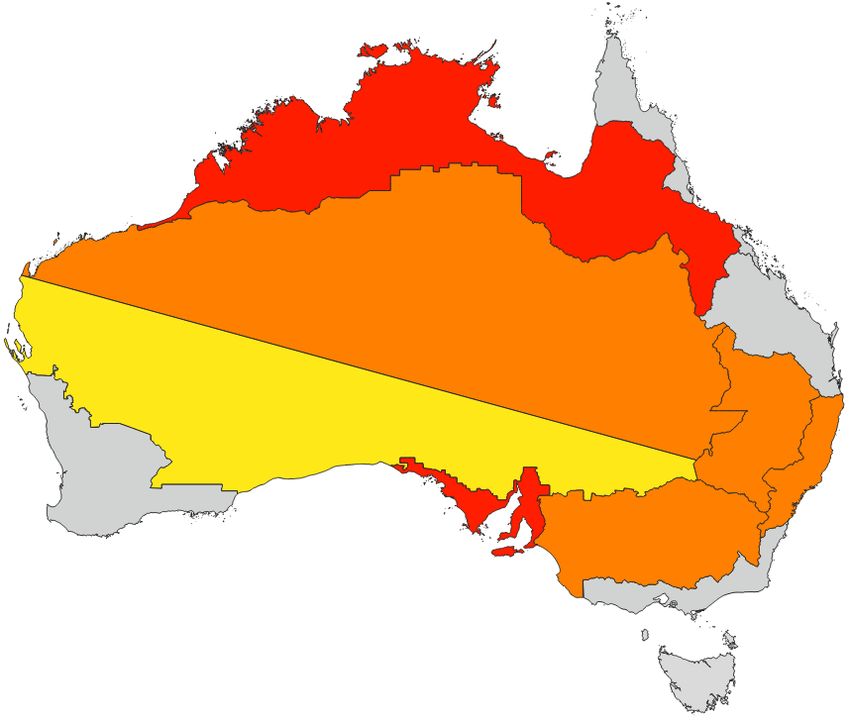
Not a single region experienced below reference period 3 average extreme high temperatures,
and seven out of the 12 regional clusters set records 4, as can be seen in Figure 2. Australia has not
recorded below average extreme high temperatures relative to the base period of 1981 to 2010
since 2012 (see Figure 3).
In addition to extreme high temperatures, significant dryness was also observed, with Australia
setting a record for consecutive dry days (see Figure 4).
NSW was particularly affected by these conditions. The East Coast South region, which includes
Sydney, experienced not only the highest value for consecutive dry days, but also the second
highest value for extreme high temperature. These hot and dry conditions, coupled with wind that
facilitated the spread of fire, led to NSW having 81% of Australia's total general insurance claims for
the period. NSW also suffered 25 of the 34 fatalities recorded nationally.
As well as the extreme bushfires that consumed much of the country throughout the summer, the
index also reflects the damaging East Coast Low storms that hit the eastern parts of Australia in late
January with severe rain, wind and hail. The East Coast South region saw the fifth highest extreme
rainfall value ever. A record was also set for extreme wind. The hail and East Coast Low caused
approximately $1.4 billion 5 and $0.8 billion 6 of damage respectively, with significant losses for both
home and motor vehicles. The ACT experienced 57% of all claims for the period, while NSW and VIC
were also badly damaged.
1
Use the dropdown menus across the top of the website to access graphs displaying results for Australia or for specific
regions and for the AACI or by specific component.
2
Refer https://disasters.org.au/current-catastrophes/2019/11/13/november-bushfires
3
The Australian Actuaries Climate Index measures extreme values relative to a reference period of 1981-2010 and is based
on measurements taken by Bureau of Meteorology from its extensive network of meteorological and coastal tide stations
4
Records here refer to a value that is in the top 3 most extreme values of the index.
5
Refer https://disasters.org.au/current-catastrophes/2020/1/21/cat201-january-hailstorms-vicactnsw
6 Refer https://disasters.org.au/current-catastrophes/2020/2/10/cat202
Page 1 of 5The graph below shows that the dams in the Greater Sydney area, which were at historically low
levels at the beginning of 2020, saw increases in water storage levels from 44.1% to 64.0% of
capacity in a single day 7 during these storms.
Figure 1 – Water Storage in Greater Sydney Dams 8
82.0%
44.1%
By the end of February, the dams had almost doubled their water storage to 82.0% of capacity 9, in
one of the sharpest increases on record. This represents enough water to supply Sydney for almost
two years 10.
The extreme conditions were related to a combination of cyclical climate conditions: an unusually
strong positive Indian Ocean Dipole (IOD), a negative Southern Annular Mode (SAM), and a neutral
El Niño–Southern Oscillation (ENSO). Historically, these cycles have led to the type of conditions
experienced last summer.
The Indian Ocean Dipole has now returned to neutral.
7 Refer https://www.waternsw.com.au/__data/assets/pdf_file/0005/153698/Greater-Sydney-water-storage-and-supply-
report-weekly-edition-Thursday-13-February-2020.pdf
8 Refer https://www.waternsw.com.au/__data/assets/image/0008/155663/Thursday-2-April-2020.png
9
Refer https://www.waternsw.com.au/__data/assets/pdf_file/0020/154550/Greater-Sydney-water-storage-and-supply-
report-weekly-edition-Thursday-5-March-2020.pdf
10 Refer https://www.waternsw.com.au/supply/Greater-Sydney/greater-sydneys-dam-levels
Page 2 of 5 Institute of Actuaries of Australia
Level 2, 50 Carrington Street
SYDNEY NSW 2000
t +61 (0) 2 9239 6100 f +61 (0) 2 9339 6170
actuaries@actuaries.asn.au І www.actuaries.asn.au"Australia can expect to see weather that aligns more closely with normal conditions over the
coming months, although the effect of global warming continues a push towards more extreme
weather conditions," said Rade Musulin, the Australian Actuaries Climate Index spokesman.
"The components of the index reflect both the cyclical nature of rainfall in Australia and the longer-
term trends toward a warmer world with higher sea levels," he said.
Mr Musulin said the consecutive dry days component of the index (Figure 4) and Greater Sydney
Dam storage levels (Figure 1) show a cyclical pattern, while the extreme high temperature (Figure
3) and overall index show the long-term trend.
"The Australian Actuaries Climate Index helps us understand the factors driving our climate, and
illustrates the conditions that led to the catastrophic fires we saw this summer," said
Actuaries Institute Chief Executive Elayne Grace.
The Index, which measures extreme weather conditions and sea levels across Australia, and how
these vary over time, was launched in November 2018 and is updated quarterly. It shows changes
in the frequency, or rate of occurrence, of extreme high and low temperatures, heavy
precipitation, dry days, strong winds and changes in sea levels.
It is collated at the end of each season following the release of data from the Bureau of
Meteorology. The data is collected nationally and grouped into 12 climatically consistent regions.
Each season is compared to the same season in previous years and against a reference period of
1981-2010.
Footnote: References to temperatures, dryness etc. are based on the data underlying the AACI, which tracks
changes in the frequency of extreme high and low temperatures, heavy precipitation, dry days, strong wind
and changes in sea level, mainly concentrating on the 99th percentile of observations.
A link to the AACI is here. Rade Musulin is available for comment.
For media inquiries please contact:
Michelle Innis
P&L Corporate Communications
m +61(0) 414 999 693
About the Actuaries Institute
As the sole professional body for Members in Australia and overseas, the Actuaries Institute represents the interests of the
profession to government, business and the community. Actuaries assess risks through long-term analyses, modelling and
scenario planning across a wide range of business problems. This unrivalled expertise enables the profession to comment on
a range of business-related issues including enterprise risk management and prudential regulation, retirement income policy,
finance and investment, general insurance, life insurance and health financing.
Page 3 of 5 Institute of Actuaries of Australia
Level 2, 50 Carrington Street
SYDNEY NSW 2000
t +61 (0) 2 9239 6100 f +61 (0) 2 9339 6170
actuaries@actuaries.asn.au І www.actuaries.asn.auFigure 2 - Regions Breaking Records for Extreme High Temperature
Figure 3 - Australian Actuaries Climate Index: Extreme High Temperature
Page 4 of 5 Institute of Actuaries of Australia
Level 2, 50 Carrington Street
SYDNEY NSW 2000
t +61 (0) 2 9239 6100 f +61 (0) 2 9339 6170
actuaries@actuaries.asn.au І www.actuaries.asn.auFigure 4 - Australian Actuaries Climate Index: Consecutive Dry Days
Page 5 of 5 Institute of Actuaries of Australia
Level 2, 50 Carrington Street
SYDNEY NSW 2000
t +61 (0) 2 9239 6100 f +61 (0) 2 9339 6170
actuaries@actuaries.asn.au І www.actuaries.asn.auYou can also read