Persisting inequities in second doses of COVID-19 vaccines? - July 2021
←
→
Page content transcription
If your browser does not render page correctly, please read the page content below
Persisting inequities
in second doses of
COVID-19 vaccines?
James Iveniuk
Nahomi Amberber
Kwame McKenzie

                        July 2021
Persisting inequities in second doses of COVID-19 vaccines?
Table of Contents
Introduction.................................................................................................................................. 2
Methods........................................................................................................................................ 2
Findings......................................................................................................................................... 2
Discussion...................................................................................................................................... 3
Figure 1. ………................................................................................................................................ 4
Table 1. ……………………………………………………..……………………………………………….............................. 5
References..................................................................................................................................... 6
1Introduction
In mid-April, Wellesley Institute reported that areas in Ontario with higher rates of COVID-19 had lower
rates of vaccination.1 The original report also documented inequities by racial composition of an area:
neighbourhoods that had a higher per cent of Black, South Asian, Southeast Asian, or Latino
populations had lower rates of vaccination, even after taking COVID-19 infection rates into account.
Since then, at time of writing, 77 per cent of Ontarians have received their first dose of COVID-19
vaccines,2 enough to begin a substantial rollout of individuals’ second doses. Approximately 29 per cent
of people in Ontario have now received their second dose.2 During the first rollout, numerous forms of
inequity undermined the distribution of vaccines, often leaving more disadvantaged areas, or areas
with a more racialized population, from sharing in the protection that vaccines allowed.1,3,4 Recent
strategies, such as, the implementation of ‘hotspots’ with increased access to vaccines, addressed some
of these inequities, but did not fully close these gaps.3 Now that the distribution of second dose
vaccines is substantially underway, are we doing any better than the rollout of first doses, in terms of
equity?
This paper revisits the topics above, by investigating whether associations between neighbourhood
characteristics (i.e. racial composition and poverty rates) and vaccination have changed as the second
doses of vaccines are being rolled out.
Methods
Data on cumulative rates of vaccination and infection for Forward Sortation Areas (FSAs) were accessed
from Institute for Clinical Evaluative Sciences (ICES) for June 20.5 These data were linked to 2016 census
characteristics for FSAs.a Correlations between neighbourhood characteristics and second dose
vaccination are computed. Note that these rates exclude people living in long-term care facilities. Note
we use the term ‘racialized’ to refer to specific racial groups, but ‘not-visible-minority’ to speak of the
group that leaves out all racialized groups except Indigenous, since this is the category used in the 2016
census.
Findings
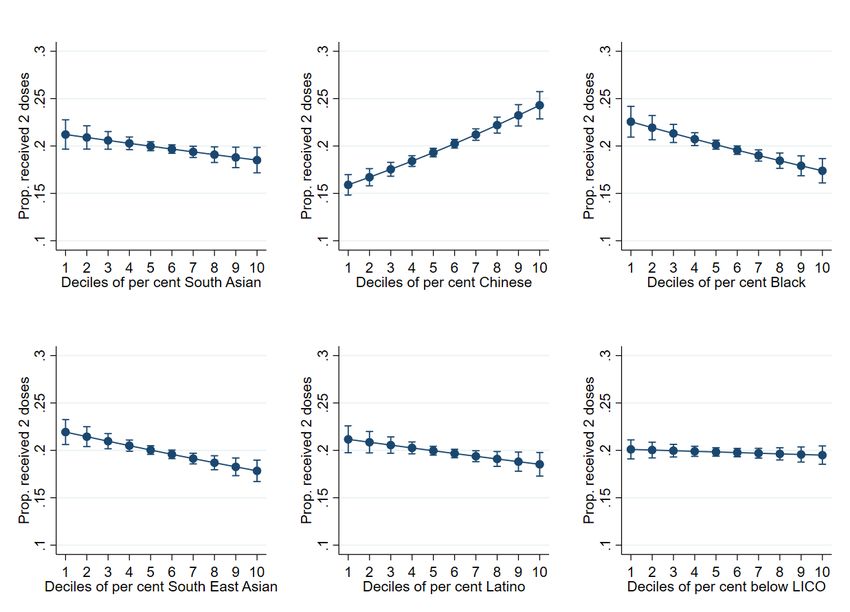
Looking at Figure 1, several patterns emerge in the data. First, the higher the per cent of South Asian,
Black, Southeast Asian, or Latino residents there are in an FSA, the lower the per cent of fully
vaccinated individuals.
Second, the association is clearly different for Chinese populations, where areas with a higher per cent
of Chinese residents also have higher rates of the population receiving both doses.
Finally, once controlled for other factors, there seems to be no association between neighbourhood
poverty rate (measured by LICO), and vaccination rate.
a
Second-dose vaccination rate was modeled using a general linear model, where the outcome (a proportion) was
logit-transformed to bound it at 0 and 1. These controlled for local age composition, race, region, and poverty
rates (using the Low-Income Cutoff/LICO).
2Taking a closer look at the disparities by race, Table 1 shows the average expected rate of two-dose
vaccination for areas with the highest concentration of each racialized group. That is, the rate of two-
dose vaccination for the highest decile. It then compares this rate to areas with the highest per cent
non-visible minority, to estimate the size of the gaps by area. By far the largest absolute gap is with the
Chinese population, where areas with the highest per cent of Chinese residents have approximately 4
per cent higher vaccination rates than areas with the greatest per cent non-visible-minority. After this,
the next largest gap is for Black populations, where areas with the highest per cent of Black residents
have approximately 3 per cent lower vaccination rates than areas with the greatest per cent non-
visbible-minority.
In brief, for every racialized group except Chinese, the greater the per cent of an area that is made up of
that racialized population, the lower their vaccination rate for second doses. Conversely, where there is
a higher per cent of Chinese residents, the greater the per cent receiving second doses. Neighbourhood
poverty showed no association with second doses, after taking controls into account.
Discussion
A previous Wellesley Institute report showed that provincial efforts appeared to have been insufficient
to produce equity by race, in terms of vaccination rates. Inequities still persist for Black and South Asian
populations.6 However, these results for second doses much more strongly resemble the inequities
glimpsed at the start of the vaccine rollout. Per cent Black, South Asian, Latino and Southeast Asian in an
FSA all showed negative associations with per cent receiving a second dose, demonstrating substantial
racial inequities in the rollout. In sum, Ontario is going backwards, not forwards.
Individual sociodemographic data collected at source during vaccination may help to explain the
mechanisms behind these inequities. It is worth underscoring the same point made previously:
addressing systemic racism will be key to ensuring that vaccine supplies meet population needs.
Additional temporary hot spot strategies may help to address this,7 but if experience is any guide, it may
only dampen inequities that return later with the similar force. Policy makers must commit to
significantly increased efforts to support equitable vaccination rates in Ontario. As the overall per cent
of the population receiving a second dose rises, the Province should also take exceeding care to ensure
that they do not declare an early victory and leave behind people who are more likely to face social
disadvantage. We should work collectively to avoid this possible future, because in order to build back
from the pandemic, all Ontarians should equally and fairly have access to the full protection that
vaccines allow.
3Figure 1. Associations between second-dose COVID-19 vaccination rates and neighbourhood
characteristics (racial composition and per cent below Low-Income Cut-Off/LICO).
4Table 1. Relative rates of COVID-19 second dose vaccination rates, by racial groups
Model-based estimates.
Not vis. South Chinese Black S.E. Asian Latino
Min. Asian
Predicted rate in areas
with highest per cent of 20.1% 18.5% 24.3% 17.4% 17.8% 18.5%
group (i.e. top decile)
Compared to not-visible-
minority areas, these 1.6% 4.2% 2.7% 2.3% 1.6%
-
areas’ vaccination rates lower higher lower lower lower
were…
5References
1. Iveniuk J, Leon S. An Uneven Recovery: Measuring COVID-19 Vaccine Equity in Ontario. Wellesley
Institute; 2021. Accessed April 30, 2021. https://www.wellesleyinstitute.com/wp-
content/uploads/2021/04/An-uneven-recovery-Measuring-COVID-19-vaccine-equity-in-Ontario.pdf
2. COVID-19 vaccinations data. COVID-19 (coronavirus) in Ontario. Accessed June 24, 2021.
https://covid-19.ontario.ca/data/covid-19-vaccinations-data
3. Iveniuk J, McKenzie K. Has the Advice to Increase Vaccination in Hot Spots Improved Equity in
Ontario? Wellesley Institute; 2021. Accessed May 10, 2021.
https://www.wellesleyinstitute.com/wp-content/uploads/2021/05/Has-the-advice-to-increase-
vaccination-in-hot-spots-improved-equity-in-Ontario.pdf
4. Plenty of Pharmacies, but No Vaccines in Toronto’s Northwest. The Local. Published March 26,
2021. Accessed April 8, 2021. https://thelocal.to/plenty-of-pharmacies-but-no-vaccines-in-torontos-
northwest/
5. Institute for Clinical Evaluative Sciences. COVID-19 Dashboard. Accessed April 8, 2021.
https://www.ices.on.ca/DAS/AHRQ/COVID-19-Dashboard
6. Iveniuk J, McKenzie K. Monitoring Progress: Race and Vaccine Equity. Wellesley Institute; 2021.
Accessed June 19, 2021. https://www.wellesleyinstitute.com/wp-
content/uploads/2021/05/Monitoring-progress-Race-and-vaccine-equity.pdf
7. Ontario declares three more hot spots for COVID-19’s Delta variant, accelerates second doses across
the province. thestar.com. Published June 17, 2021. Accessed June 19, 2021.
https://www.thestar.com/politics/provincial/2021/06/17/ontario-declares-three-more-hot-spots-
for-covid-19s-delta-variant-accelerates-second-doses-across-the-province.html
6You can also read