Decadal Changes in the Atlantic, Pacific and Indian Ocean Inorganic Carbon Inventories
←
→
Page content transcription
If your browser does not render page correctly, please read the page content below
Decadal Changes in the Atlantic, Pacific and
 Indian Ocean Inorganic Carbon Inventories
                                 by
 Christopher L. Sabine (PMEL), Richard A. Feely (PMEL), Frank Millero
     (RSMAS), Andrew Dickson (SIO), Rik Wanninkhof (RSMAS),
           Dana Greeley (PMEL) and Esa Peltola (RSMAS)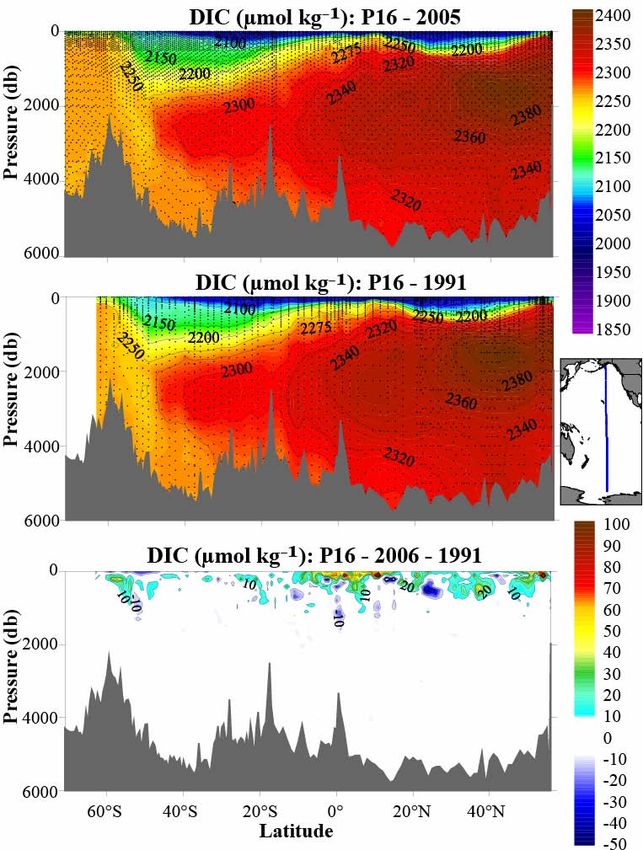
A first look at the distribution of anthropogenic CO2 in the ocean was based on the
      WOCE/JGOFS/OACES global survey of carbon conducted in the 1990s.

                                                       Global Ocean
                                                       Anthropogenic CO2
                                                       Inventory (1800-
                                                       1994): 118±19 PgC

                                                      Column Inventory (mol m-2)

We see deep penetration in
the NorthAnthropogenic
            Atlantic compared
                            CO2 estimates
to the North   Pacific.
          are accumulation    between
Generally1800
           deeperandpenetration
                     1994 based on the
in subtropics
          ΔC* vs.  tropics.
               approach.
Relatively little penetration
in the high latitude S.O.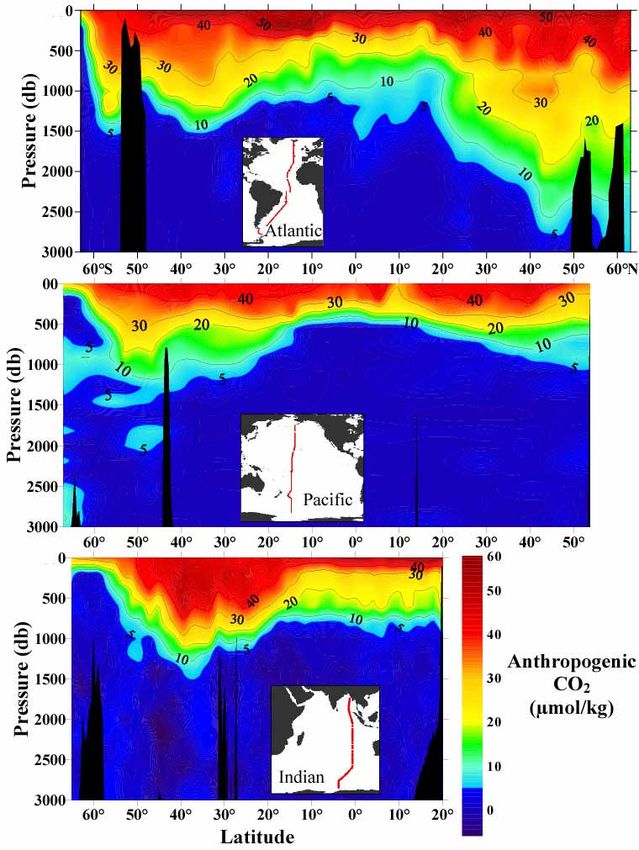
CLIVAR/CO2 Repeat Hydrography
Goal: To quantify decadal changes in the inventory and transport of heat, fresh water,
      carbon dioxide (CO2), chlorofluorocarbon tracers and related parameters in the
      oceans.
Approach: The sequence and timing of the U.S. CLIVAR/CO2 Repeat Hydrography cruises
          have been selected so that there is roughly a decade between them and the
          WOCE/JGOFS global survey.
Achievements: The U.S. CLIVAR/CO2 Repeat Hydrography Program has completed 11
                 of 18 lines and is on schedule to complete global survey by 2012.

      http://ushydro.ucsd.edu/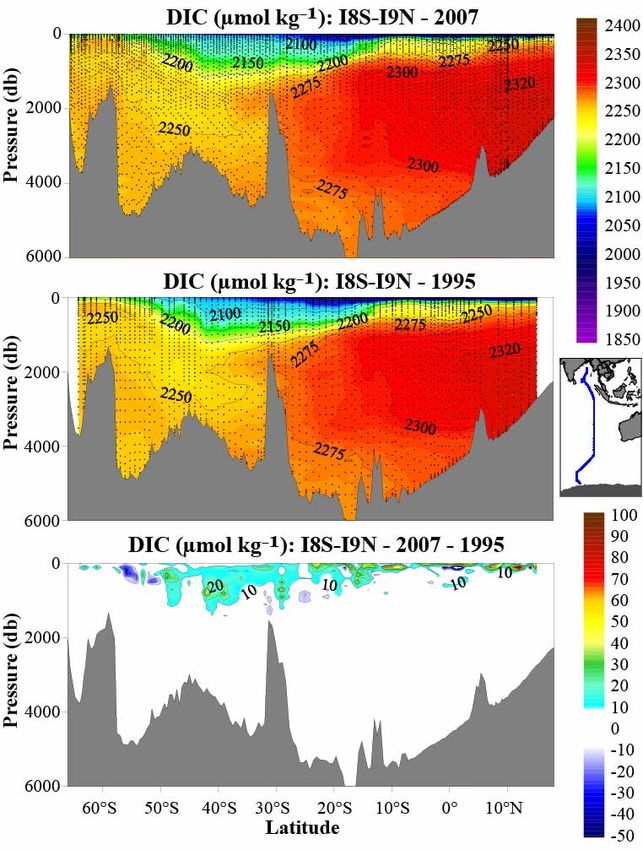
CLIVAR/CO2 Repeat Hydrography

     Today’s talk will focus primarily on three representative lines

http://ushydro.ucsd.edu/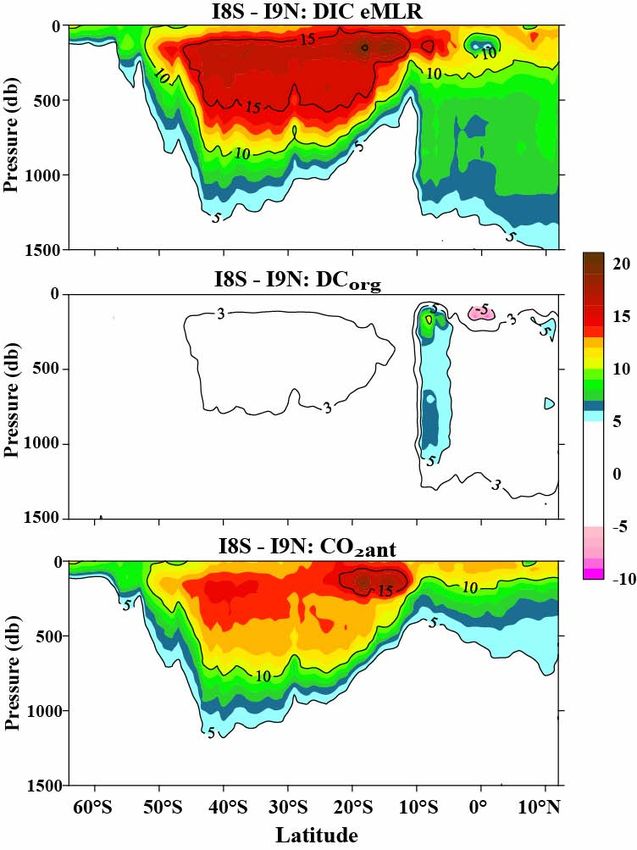
Comparison of profiles from stations near    Repeat Hydrography Data
the intersection of P2 and P16N.
                                              Are Very High Quality
                                                   P02 along 30°N
                                                Japan to San Diego, CA
                                                  June-August 2004

                                                   P16N along 152°W
                                                  Tahiti to Kodiak, AK
                                                   Feb.-March 2006
                                            Comparison of crossover and
                                            overlap stations indicate the
                                            DIC data are good to +/- 1
                                            µmol kg-1 and alkalinity data
                                            are good to +/- 2 µmol kg-1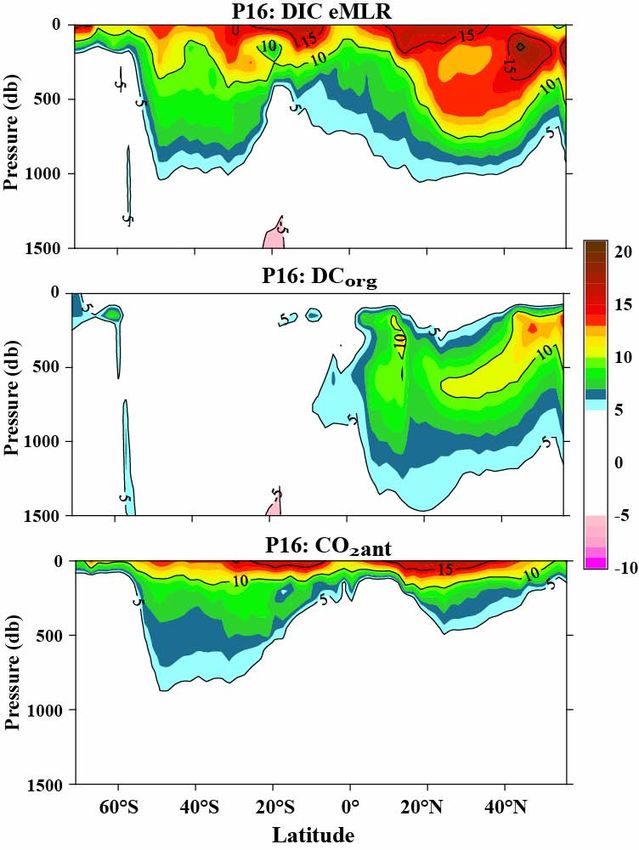
Comparison of 1991 P16N data with 2006 P16N
data along 41.425-41.450 σ3 isopycnal surface.

                                                    Repeat Hydrography
                                                   Data Agree Well With
                                                      Historical Data

                                                 Comparison of deep waters on
                                                 isopycnal surfaces show no
                                                 significant offsets between
                                                 Repeat Hydrography and WOCE
                                                 cruises.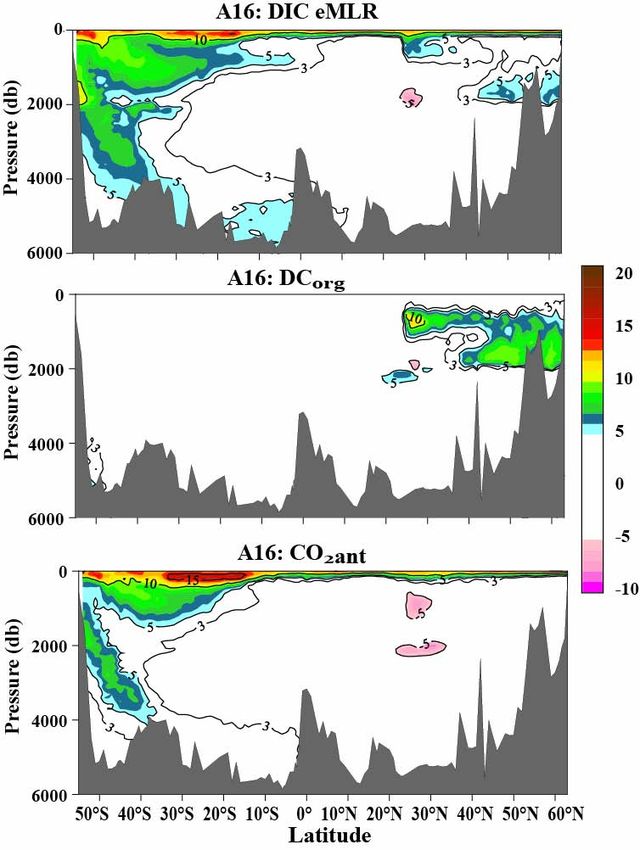
2005/2006
                First order DIC
                distributions look very
                similar but there are
                significant differences in
                the upper waters

Δ

                But the changes are
                very patchy and do not
                show consistent trends.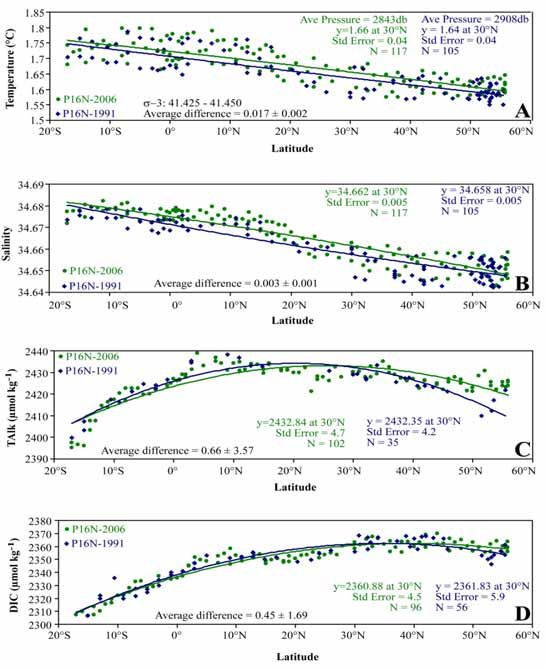
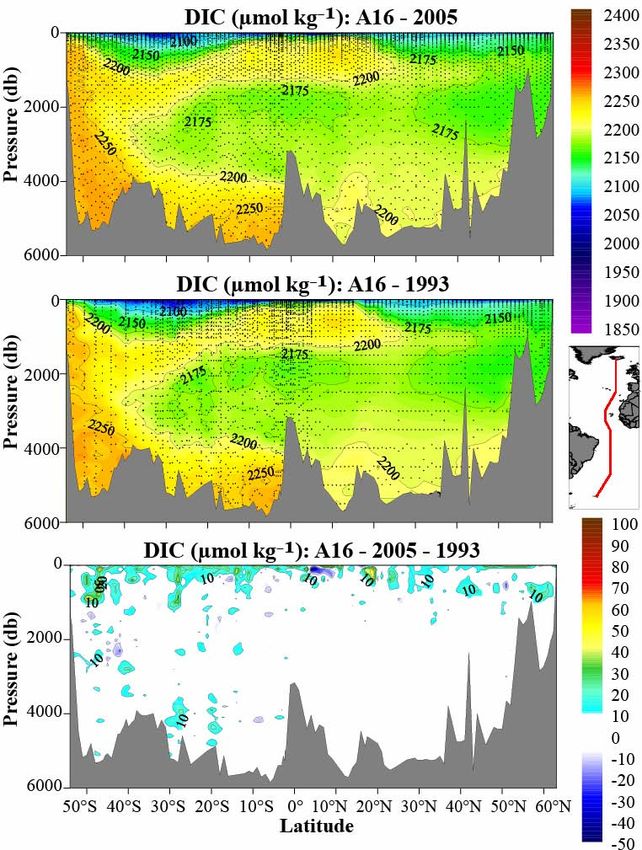
2003/2005
                As with the Pacific, the first
                order Atlantic DIC
                distributions look very
                similar but there are
                significant differences
                observed here too.

Δ

                Northern deep waters
                show no change but
                Southern Hemisphere
                deep waters do show
                patchy differences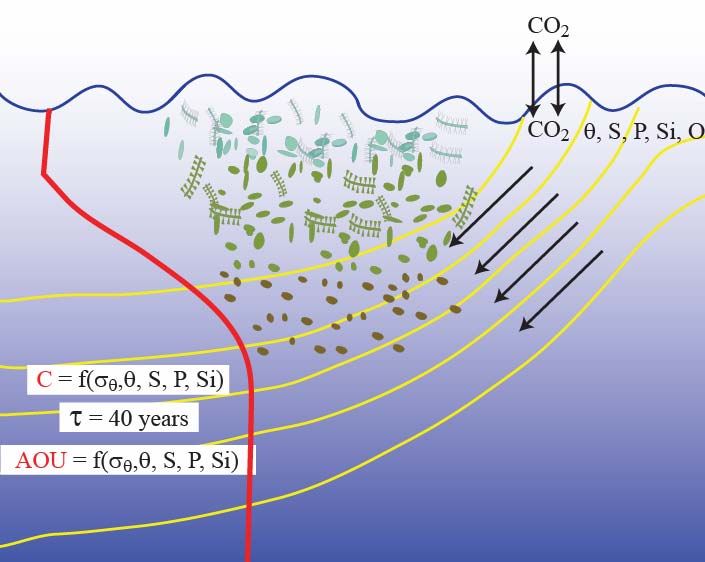
The Indian Ocean
     differences appear to be
     much more consistent than
     the Pacific or Atlantic…why?

Δ

    There are still some
    negative values, but
    there are more areas of
    coherent positive change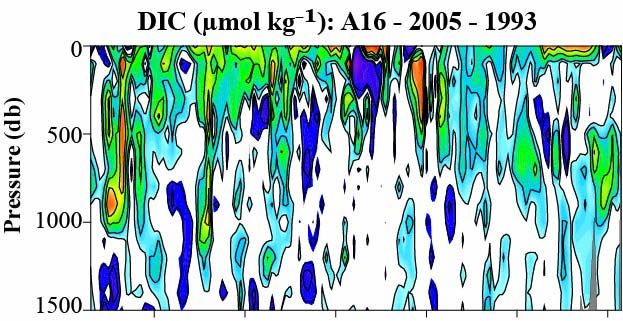
Measured DIC changes show large variability on small spatial scales
DIC from each cruise gridded as a function of Latitude and potential density
The two grids are subtracted
DIC changes are summed for each station and plotted as a function of Latitude
Average:
Atlantic = 1.2+/-1.4
Pacific = 0.1+/-1.6
Indian = 1.5+/-1.0
Average Global
Growth Rate of
Anthropogenic C is
ΔC* column inventory
0.55 mol m
estimates
-2 yr-1
shown
Based on give
previously uptakea
of 2.2 Pgaverage
maximum C yr-1
over a rate
uptake global
of 0.4
mol m-2 area
ocean degreeof-1
year-1
335.2 x 10⁹ km2Use a Multiple Linear Regression Approach to
Isolate the Secular C Changes
Wallace (1995, OOSDP Report #5) first recognized that empirical
relationships between carbon and other hydrographic properties could be
used to isolate the CO2 uptake in the ocean.
Approach:
1) Fit carbon data from older cruise with properties that should not be
affected by rising atmospheric CO2,
2) Use empirical fit of older cruise together with hydrographic data from
new cruise to predict carbon distributions on the new cruise,
3) The difference between the measured carbon values on the new cruise and
the predicted values is a measure of the additional carbon taken up from
the atmosphere.
Friis et al. (2005, Deep Sea Res.) refined this approach with the extended
MLR where both cruises are fit and take difference in fits.
DIC(1991) = a*σθ + b*θ + c*S + d*Si + e*P + f
DIC(2006) = A*σθ + B*θ + C*S + D*Si + E*P + F
ΔDIC(06-91) = A-a*σθ + B-b*θ + C-c*S + D-d*Si + E-e*P + F-fWhat Does the MLR Tell us About Carbon Changes?
X
CO2 absorption from the
atmosphere changes the
DIC of the waters relative
to other propertiesWhat Does the MLR Tell us About Carbon Changes?
P:N:C:O
X 1:16:117:-170
Observations indicate
significant changes in
apparent oxygen utilization
(AOU) on decadal time scales
By excluding
Changes AOU from
in circulation orthe DIC fit
changes and fitting
in export flux AOU independently
can alter with an
the apparent
eMLR function werate
remineralization canaffecting
separate the carbon
atmospheric uptake from
distributions theto
relative changes
the
in remineralization
other parameters -rate.
- use AOU to estimate this change(µmol kg-1)
Pacific eMLR Sections Show Much
More Coherent Patterns of Change
eMLR function without AOU shows
a very large DIC change in the
North Pacific
* ΔCAOU (µmol kg-1)
The AOU eMLR function isolates
the change in apparent
remineralization rate
P16 CFC-12 section from J. Bullister
(µmol kg-1)
Subtracting the AOU eMLR from
the DIC eMLR gives the
atmospheric CO2 uptake
* AOU converted to C units using
Redfield RatioIndian eMLR Sections Are Similar
(µmol kg-1)
To The Pacific
eMLR function without AOU
suggests deep carbon changes
north of the chemical front (~10S)
ΔCAOU (µmol kg-1)
The AOU eMLR function also
shows modest changes
(µmol kg-1)
Subtracting the AOU eMLR from
the DIC eMLR gives a pattern of
change that is more consistent
with previous estimatesAtlantic eMLR Sections Were
(µmol kg-1)
Much More Difficult to Derive A
Coherent Picture
eMLR function without AOU shows
a deep carbon change signal
ΔCAOU (µmol kg-1)
The AOU eMLR function gives
substantial changes in the
northern intermediate waters
(µmol kg-1)
Atlantic anthropogenic carbon
signal shows no deep penetration in
the North Atlantic over the last
decade, but big changes in the
South AtlanticComparison of Atlantic Inventories along the A16 section
(64 ˚N - 54 ˚S) in mol m-2 yr-1
Method N. Atlantic Eq. Atl S. Atlantic Full Section
(> 15 ˚N) (15 ˚N- 15 ˚S) (> 15 ˚S)
∆DIC 0.82 0.23 0.56 0.58
∆DICAOU 0.92 0.60 0.86 0.82
∆DICNO3 0.59 -0.28 0.66 0.39
∆DICe-mlr 0.59 0.68 0.78 0.68
∆DICe-mlr-sectional0.69 0.17 0.96 0.65
∆DICe-mlr-dens 0.57 0.20 0.76 0.53
∆DICC-13a 0.63 ± 0.16
∆DICe-mlrb 1.22± 0.27
a: From Quay et al., 2007
b: From Tanhua pers. Comm. From R. Wanninkhof
Different MLR approaches seem to give different regional results in the Atlantic .
We are currently trying to understand the reasons for this.Measured DIC changes show large variability on small spatial scales
But eMLR DIC changes give much more consistent patterns of change
Average change:
Atl NH: 0.6±?
Atl SH: 0.8±?
Pac NH: 0.25±0.1
Pac SH: 0.41±0.2
Ind SH: 0.83±0.3
Total: 0.5±0.3
Average Global
Growth Rate of
Anthropogenic C is
0.55 mol m-2 yr-1
Based on uptake of
2.2 Pg C yr-1 over a
global ocean area
of 335.2 x 10⁹ km2Additional Anthropogenic DIC Change Estimates Show Significant
Variability Within Each Basin
The decadal survey is not complete, additional sampling and evaluation is
needed to properly determine the global ocean CO2 uptake and storage
Additional work is
needed to
understand Atlantic
carbon changes
Average Global
Growth Rate of
Anthropogenic C is
0.55 mol m-2 yr-1
Based on uptake of
2.2 Pg C yr-1 over a
global ocean area
of 335.2 x 10⁹ km2Conclusions 1) The Repeat Hydrography program is providing high quality data that is essential for detecting inventory changes 2) The observations reveal very large changes in carbon concentrations on decadal time scales 3) Changes in apparent organic remineralization rates can have a significant impact on total carbon changes on decadal time scales 4) Both the anthropogenic and organic carbon changes show patterns of variability consistent with other work on ocean tracer changes 5) The full international repeat hydrography data set will be required to properly constrain the global decadal carbon change signal.
Thank you for your time!

The R/V Thomas G. Thompson arriving in Papeete, Tahiti
       for the beginning of P16N February 2006
Total - AOU DIC Change Compares Well With CFC-12
Distributions Along P16 (150°W) 2005/6 – 1991/2
Anthropogenic C (µmol kg-1)
Anthropogenic CO2 based only on CFC-12 changes
Figure from R. SonnerupYou can also read