Working Together for a Sustainable Future - Emma Jones - Agricultural Manager, Tesco - AHDB Dairy
←
→
Page content transcription
If your browser does not render page correctly, please read the page content below
Working Together for a
  Sustainable Future
Emma Jones – Agricultural Manager
                          Manager, Tesco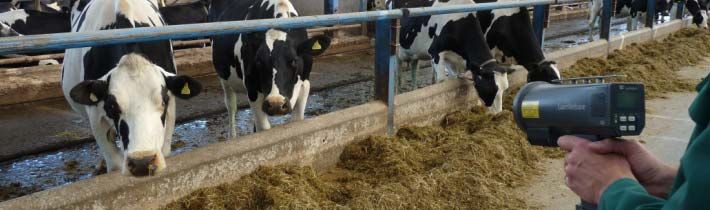
Background Circa 800 dedicated farmers 900m litres of milk p.a. Farm to bottle segregation Industry unique pricing model Proven high welfare standards Investment in R&D A strong and open relationship 4 pillars
Tesco has a large sphere of influence
Tesco has a crucial role to play in tackling climate change and we intend to
lead by example
We have a large sphere of influence ‐ through working with our suppliers
and helping our customers to play their part too,
too we can have an effect on
over 85 times our direct emissions
tCO2
Tesco direct emissions (UK)
2.6M
M
tCO2
Footprint of products in our supply chain
26M
228M
tCO2
Tesco customer footprint (UK)Our strategy has three parts
1. Reducing our direct carbon footprint
Zero‐carbon business by 2050
2. Working with our suppliers to reduce
emissions in our supply
pp y chain
Reduce emissions by 30% by 2020
3 Leading
3. L di a revolution
l ti ini green consumption
ti
Help customers to halve their carbon footprint by
2020Our supply chain emissions
4.2%
7 4%
7.4%
28.1%
Raw materials
Manufacture
23.3% Use
Distribution
Waste
36.9%Products lifecycle impacts vary
Potential opportunities
Reducing energy use Reducing transport Engaging consumers
for example: for example: for example:
processed foods widely‐consumed
widely consumed washing products
paper products food products like electrical products
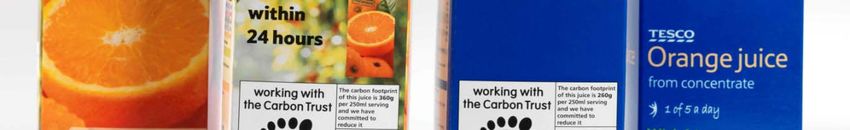
publications bananas and orange
juice
Waste Water Research into harder to
reach emissions
for example: for example:
for example:
packaged products clothing
agriculture
convenience foods manufacturing
refrigeration
encouraging recycling primary agricultureWhy a carbon label on products?
“What are the barriers to being
g green?”
g
Have to pay more to be green
Actions here make no diff.
unless world takes action
Gov't/council don’t help me
enough
I don’t
d ’t know
k enough
h about
b t it
It’s much too confusing
0% 10% 20% 30% 40% 50% 60%Why a carbon label on products?
Tesco asked customers to rank 150 determinants of their store choice
Top 5 of 150 reasons
why
h customers
c stomers choose a store
store:
1. Price
2. Range
3 Availability
3.
4. Acts in an environmentally friendly way
5. Ease of getting around the storeCarbon footprinting
T
Tesco P
Product
d tC Carbon
b FFootprinting
t i ti Study
St d
More than 500 footprints calculated to date.
Around 150 products carry a carbon label in store
store.
Ambition to footprint every own brand product
The Carbon Trust
Certification body
Model template: Footprint Expert
Produced guidelines for certain products e.g. milk
PAS 2050
Publicly Available Specification (PAS) 2050 for product carbon
footprintingWater Water Energy Energy Energy
Energy Energy
Chemicals
Animal
i
inputs:
Feed Packaging
T
Bedding
T T/P T/P T
T 1. Milk Processing Depot Store Customer
Crop Production
inputs:
Fertiliser
Herbicide
Pesticide
T
2. Milk Processing 3. Distribution and Retail 4. Use and
Solid End of Life
wastes
T T T
Waste Solid Emissions to Solid Solid
water wastes air wastes wastes
Co-products Waste Liquid Liquid
water waste waste
Emissions Emissions to Emissions to Emissions to
to air: air air air
Methane
Nitrous
Co-products
oxide
T – Transport
P - Packaging
g gModelling
1 Carbon
1. C b TTrustt Footprint
F t i t Expert
E t Template
T l t
2 ERM Methane Model – IPCC Guidelines
2.
‐ Enteric
‐ Manure Management and Storage
3. ERM Nitrous Oxide Model– IPCC Guidelines
‐ Manure Management and Storage and Direct Deposition
4 Carbon Trust Crop Calculator
4. Calculator– IPCC Guidelines
‐ GHG emissions associated with land (crop) managementResults for standard milk
Standard Standard Standard
Fresh Fresh Fresh
Skimmed Semi - Whole
Activity/
ct ty/ Process
ocess Step M
Milk Skimmed
S ed Milk
M
Milk
Milk production 71.5% 73.1% 75.3%
Milk processing 9.2% 9.4% 9.7%
Distribution 3.5% 3.2% 2.7%
Retail 10.9% 9.9% 8.5%
Use 3.2% 2.9% 2.5%
End-of-life 1.7% 1.5% 1.3%
Total 100% 100% 100%Tesco footprinting activities to date
CCarefully
f ll picked
i k d categories
t i
Supported suppliers in collecting data
On pack trials, supporting information in store
and on websiteTesco footprinting activities to date
Introduced the Carbon Footprint – no affect
on sales
Allll Tesco bottles
b l now 10% RHDPE – planl to
increase this to 30% by 2015
‐ UHT Milk
‐ Organic
g Milk
‐ Other Products, SoyaWorking with our farmers
Reduce the overall environmental impact of
milk production methods and dairy products
supplied to Tesco
– TSDG Environmental Code of Practice
– Roll
R ll out cost effective
ff i ways to reduce
d our carbon
b footprint
f i
Reduce methane levels through:
– Herd health – yield efficiency, lameness, fertility, mastitis, culling rates
– Feed and diet changes to reduce emissions
Linking environmental best practice with improved economic
performanceMethane trial
Trialling on‐farm measurement devices, to
g
determine if management system
y or feed type
yp
has any impact on methane emissionsSummary
Already achieving recommendations
outlined in the Milk Roadmap
Opportunities for mitigation?
Tesco – role to play in educating consumers
Help customers to halve their carbon
f t i t by
footprint b 2020
Zero‐carbon business byy 2050
Working with our suppliers to reduce
emissions in our supply chainYou can also read