Hydrogen for Europe study - Available Manuel Villavicencio Economic Advisory - Deloitte France - ENTSOG

Page created by Katie Lopez
 
CONTINUE READING
Hydrogen for Europe study - Available Manuel Villavicencio Economic Advisory - Deloitte France - ENTSOG
Hydrogen for Europe study
Available at: https://www.hydrogen4eu.com
Dr. Manuel Villavicencio
Economic Advisory – Deloitte France

                                            © 2021 Deloitte Finance
Hydrogen for Europe study - Available Manuel Villavicencio Economic Advisory - Deloitte France - ENTSOG
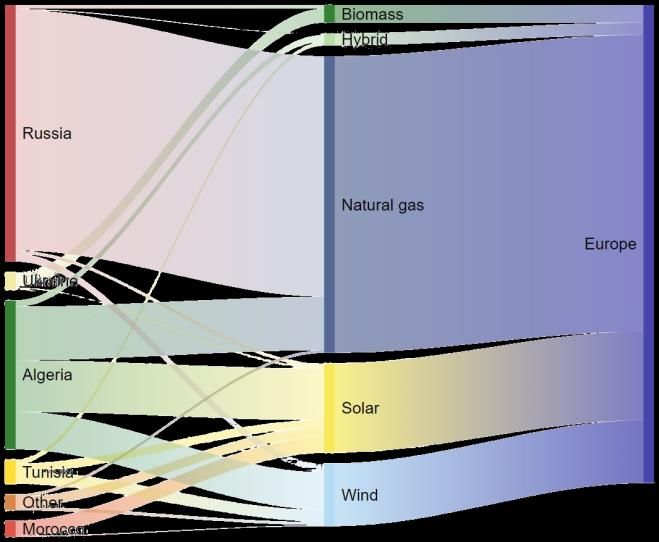
Reaching net-zero emissions in the EU by 2050 is a formidable challenge

The European Union has reduced its carbon emissions during the last decade
      but the path towards net-zero requires a step change in efforts                                                                                               Integrated energy system for the Net-Zero target

                                7000
 Total GHG emissions (MTCO2e)

                                                                                                                                                            7000

                                6000                                                                                                                        6000

                                                                                                  "2020 Package" 2009
                                5000                                                                                                                        5000

                                                                                                                             "2030 Climate and Energy
                                                                                                                          Framework" 2014 (at least -40%)
                                4000                                                                                                                        4000

                                3000                                                                                                                        3000

                                                                                                                                  "EU Green Deal" 2020 (with
                                                                                                                                     at least -55% in 2030)
                                2000                                                                                                                        2000

                                1000                                                                                                                        1000

                                                                                                                                                       Net-zero
                                   0

                        -1000                                                                                                                               -1000

                                       Other (indirect CO2)                                             LULUCF
                                       International shipping                                           International aviation
                                       Waste                                                            Agriculture
                                       Residential/commercial                                           Transport
                                       Industry                                                         Energy supply
                                       EU-27 historic emissions                                         "EU Green Deal" 2020 (with at least -55% in 2030)
                                       "2030 Climate and Energy Framework" 2014 (at least -40%)

© 2021 Deloitte Finance                                                                                                                                                                                                2
Hydrogen for Europe study - Available Manuel Villavicencio Economic Advisory - Deloitte France - ENTSOG
The design of the Hydrogen for Europe study in a nutshell

                                                                                                                               Two main pathways are
                                                                Detailed energy system model
                                                                                                [MIRET-EU]                     analysed:
  Hydrogen for Europe is a                                                             Linear programming
  new research study that                                                                                                      Technology
  comprehensively looks at the                                                                                                 Diversification pathway
  European energy system to                                                                                                    → Illustrates how an
  assess the role of hydrogen                                                                                                    inclusive approach
  in the energy transition.                                                                                                      helps minimize the cost
                                                                                                        Import model
                                                                                                                      [HyPE]     of the transition
            Addressed issues                                                                             Linear programming

                                                                                                                               Renewable Push
  • How can renewable and                                                                                                      pathway
    low-carbon hydrogen                                                                                                        → Shows the implications
    contribute to the energy                                                                                                     of a deliberate focus on
    transition?                                                                                                                  renewables
  • What decisions and                                Learning optimization model
                                                                       [Integrate Europe]
    pathways help to bring                                         Dynamic programming                                         Both are aligned with
    down the technology
    cost?                                                                                                                      key EU policy goals:
                                 The study rests on a quantitative analysis, relying on three models                           • 55% reduction in GHG
  • What is needed at policy     and their interaction: MIRET, Integrate Europe and HyPE.                                          by 2030,
    and regulatory level ?
                                                                                                                               •   Net-zero by 2050
                                 Led by Deloitte, research centers SINTEF and IFPEN implemented an
                                 innovative and original modelling approach
© 2021 Deloitte Finance                                                                                                                                     3
Hydrogen for Europe study - Available Manuel Villavicencio Economic Advisory - Deloitte France - ENTSOG
The primary energy mix is fundamentally reshaped in the two pathways

                                                       Evolution of primary energy demand in Europe
                                 1 600                                                                                                   60%                                    • x3.5 in 30 years
  Primary energy demand (Mtoe)

                                                                                                                                               Share in primary energy supply
                                 1 400                                                                                                                                          • Meets almost half of
                                                                                                                                         50%
                                                        48%
                                                                                                                              49%
                                                                                                                                                                                  primary energy by 2050
                                 1 200
                                                                                                        40%
                                                                                                                                         40%
                                 1 000
                                                                                                        36%
                                                                     29%
                                                                            29%                                               32%                                               • 32% share by 2050
                                  800                                                                                                    30%
                                                                              28%                                                                                               • Resilient during the
                                                        25%
                                  600
                                                                                                                                         20%                                      transition
                                  400                   14%
                                                                                                                                         10%
                                  200                                                                   8%
                                                                                                                                                                                • Dwindling role of coal and
                                                                                                                              3%
                                   -                                                                                                     0%                                       oil
                                                    2016                   2030                      2040                  2050
                                                                                                                                                                                • 3% share by 2050
                                                   Historic                           Technology Diversification pathway

                                         Coal                                 Oil                                   Natural gas
                                         Nuclear                              Ambient heat                          Wind
                                         Solar                                Other renewables                      Hydrogen from non-Eu. countries
                                         Share of renewable energy            Share of natural gas                  Combined share of oil and coal

© 2021 Deloitte Finance                                                                                                                                                                                        4
Electricity and hydrogen combine forces to decarbonise energy end-use

                                                             Evolution of gross final energy consumption by energy carrier                                      by 2050
                                                     1 200
                  Final energy consumption in Mtoe

                                                     1 000                                                                                                       -10%     Energy efficiency

                                                      800
                                                                                                                                                                 21%      Hydrogen
                                                      600

                                                      400
                                                                                                                                                                43%       Electricity
                                                      200

                                                        0                                                                                                         3%      Natural gas
                                                                           2016                 2030                  2040                   2050
                                                                      Historic                          Technology Diversification pathway                                E-fuels
                                                                                                                                                                  3%
                                                             Oil                  e-fuels (e-liquid)   Natural gas        Coal               Bioenergy
                                                             Electricity          Heat distributed     Ambient heat       Hydrogen           Other Renewables

© 2021 Deloitte Finance                                                                                                                                                                 5
Hydrogen key for decarbonizing hard-to-abate sectors

                             Hydrogen demand by sector
                                                                                 Industry: 4455MtH
                                                                                 Transport:       2 2inin2050
                                                                                                MtH       2050

                                                             ~ 100 million tonnes
                                                                              60% of the maritime demand
                                                                              18 MtH2 in iron & steel
             43%                      ~100 MtH2               of H2 consumed 30%
                                                                              byof the aviation demand as e-fuel
                                      consumed in
                                                                  55% 2050
                                         2050                                 6 MtH in chemicals as energy (excludes
                                                                                          2
                                                                                    feedstock)
                                                                                    15 million trucks and buses run on hydrogen

                          Transport   Industry   Buildings      Power

© 2021 Deloitte Finance                                                                                                           6
Diversity and complementarity between hydrogen supply options

   Technology Diversification pathway
   Supply in MtH2
                                                                                                                              Renewable
                                                                                                                      Imports Low-carbon hydrogen
                                                                                                                                         hydrogen
                                                                                                                              from non-European countries
                                                                                                                      Renewable and capacities
                                                                                                                          Additional electrolyzers
                                                                                                                                                 perinstalled capacities
                                                                                                                                                      decade in          by 2050
                                                                                                                                                                Technology
 2050                          37             5                   43                 2        15    101 MtH2                          Diversification pathway

 2040             19            3                  49                  5        10
                                                                                                                              +155 GW
                                                                                                                                                        +80 GW
 2030 2                   28         3                                                                                                                                         +16 GW
                                                                                                                                       1 000 – 1 700 GW
   Renewable Push pathway
   Supply in MtH2

 2050                                         77                                         20        10   108 MtH2                                                      +2 GW
                                                                                                                                            +8 GW
                                                                                                                   700 – 1 250 GW                                 370 – 380 GW
                                                                                                                   +11 GW
 2040                           40                           33             8
                                                                                                                     2025 - 2034             2035 - 2044              2045 - 2054
 2030        10                 21
                                                                                                                              Reformer with CCS          Methane pyrolysis
           Electrolyzer                  Biomass / biomass with CCS    Imports from non-European countries                               680 – 1 500 GW
           Reformer with CCS             Methane pyrolysis
© 2021 Deloitte Finance                                                                                                                                                                 7
Zooming in on CO2 emissions and the net-zero objective

                                 CO2 emissions breakdown by sector: net-zero by 2050
                        4 000
                                                                                                               Carbon capture and storage technology is indispensable:
CO2 emission in MtCO2

                                                                                                               -   Unlock the potential of low-carbon solutions
                        3 000                               -55%
                                                                                                               -   Enabling negative emissions
                        2 000                                                                 Net
                                                                                              zero
                        1 000
                                                                                                                                                                                              6%
                                                                                                                                                        9%   7%
                            0                                                                                                                                                                         32%
                                                                                                                     18%     13%
                                                                                                                                                                   44%
                                                                                                                                                  40%                                   48%
                        -1 000
                                                                                                                                   43%
                                         2016                   2030      2040                2050                 26%                                                                                14%

                                 Power Sector                          Transport Sector
                                                                                                                                                                         9%                                  8%
                                 Building sector                       Other energy transformation processes                             3%

                                 Industry sector                       Agricultural sector
                                 Other carbon dioxide removal          Net emissions
                                                                                                                                         97%                       91%                                 92%
                Some 400 Mt of CO2 are removed in 2050
                In some applications the cost of full decarbonization is grater                                             2030                                  2040                             2050
                than compensating emissions with CO2 removal.                                                            CO2 captured                                         CO2 stored/used
                                                                                                                            Hydrogen production   Biorefineries                 CCU
                                                                                                                            Power sector          Direct Air Capture            Underground storage
                                                                                                                            Industry sector
© 2021 Deloitte Finance                                                                                                                                                                                           8
Investment, investment, investment…

                      Investment pathways in the hydrogen value chain
                                 (including offgrid electricity)                    Trillions of euros are needed in both scenarios
            3 500                                                                   to finance the hydrogen value chain.
                                                                                    Temporality and level of necessary investment
            3 000
                                                                                    differ between the scenarios: more money
                                                                                    needs to be mobilized earlier in the Renewable
            2 500
                                                                                    Push pathway
€ billion

            2 000

            1 500                                                                          5.5 trillion euros
                                                                                           Renewable Push
            1 000

             500
                                                                                                                          €
                                                                                    3.1 trillion euros
               -
                            2021-2034               2035-2044           2045-2054
                                                                                    Technology Diversification
                                                                                                                 €
                    Technology Diversification pathway     Renewable Push pathway

© 2021 Deloitte Finance                                                                                                               9
Key insights from the modelling for energy policy-making

The Technology Diversification pathway offers to European      Five main guidelines to inform the design of next policy
society several advantages that policy-makers should trade-    packages and measures
off against other criteria

                                                                     Internalising CO2 emissions and changing the
                                 De-risking achievement              economics in favour of clean technologies
                                 of the energy transition

                                                                     Accounting for CO2 content of energy use

  Achieving the net-                                                 Fostering innovation and R&D and bringing new
                                     Relieving the financing
  zero emissions goal                                                technologies to commercial viability
                                           bottleneck
  at a lower cost
                                                                     Enabling low-cost financing and bankability of
                                                                     investments in low-carbon and renewable solutions

                                A more competitive and
                                                                     Ensure system integration and coordinate supply
                                efficient energy system              and demand uptake

© 2021 Deloitte Finance                                                                                                   10
Thanks for your attention
                                 Dr. Manuel Villavicencio
                                 mvillavicencio@deloitte.fr

© 2021 Deloitte Finance                                       11
You can also read