Agri-environmental indicators (UC1b) 04/03/2021 - Sen4Cap Closing meeting
←
→
Page content transcription
If your browser does not render page correctly, please read the page content below
Agri-environmental indicators (UC1b)
04/03/2021 – Sen4Cap Closing meeting

          This project has received funding from the European Union’s Horizon 2020
          research and innovation program under grant agreement No. 842009
                                                                                     1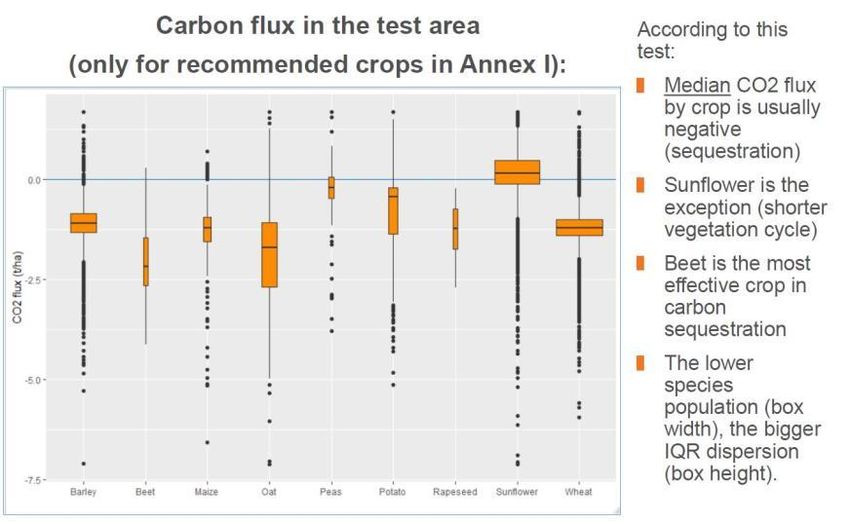
Objectives and principles
• To propose indicators in order to measure the impact of
  agricultural practices on environment
   – Based on published scientific methods & former EU projects
     (DiverImpact, Sensagri, Farmland)
   – Based on data widely available in Europe
   – Based on Sen4Cap software standards

   IACS Data at                               Sentinel data
   parcel
  IACS    level
       data
  LPIS + GSAA

                            Indicator
                          modelling and
                           calculation
Meteorological                                    FMIS data
and soil data
                                                 Farming practices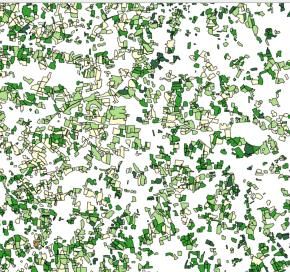
Multi actor approach
                          INRAE-CESBIO                   ASP
                          Scientific and agronomic
        IGN               approaches - EO expertise    IACS data provision
  GIS/mapping expertise
  Software development                                 DAA(DK), FEGA (SP),
                                                           RVO (NL)
   Chambers               3
                                                         Testing Paying Agencies
 of agriculture       meetings
                                  User Case               2       FR ministries
 access to FMIS data,
   farmer consent,                   1b                meetings   Agri and Env
promotion of indicators                                           Policy making and
                                                                     assessment
                                                              1
     National                                             meeting  DG Agri,
    Biodiversity          2
                      meetings            1                       Env, Clima
      Agency                            meeting
                                                                   EU objectives
   Indicator promotion           EEB and NGO                           and
    and dissemination             Social expectation              CAP monitoring
                                                                                      3
                                   and CAP impact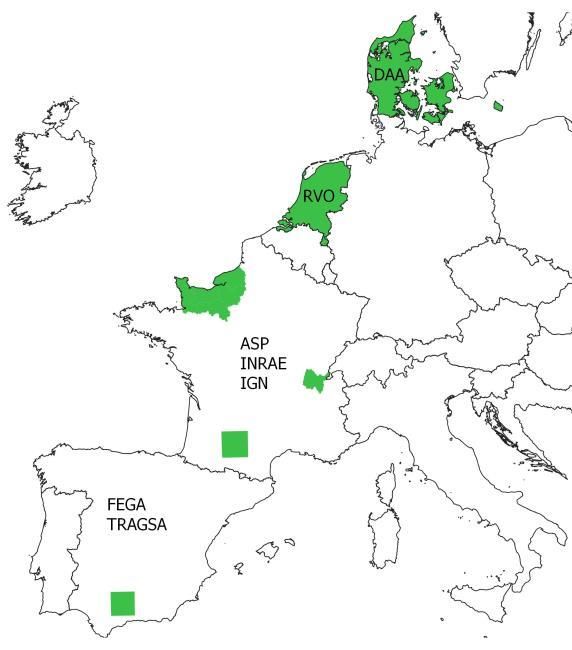
Selection of indicators to be processed
➢ Discussion with key stakeholder (European Commission)
  based on a preliminary selection of 13 candidate indicators

➢ Selection of 3 indicators
   – Carbon storage => climatic change
   – Nitrate Lixiviation => water quality
   – Biodiversity

➢ Indicators may be computed at various TIERs,
   – TIER 1 : easily feasible but less accurate
                                                           Empirical approaches
   – TIER 2 : better result but more difficulties to get
   – TIER 3 : best results, less operational               Modelling approach

                                                                                4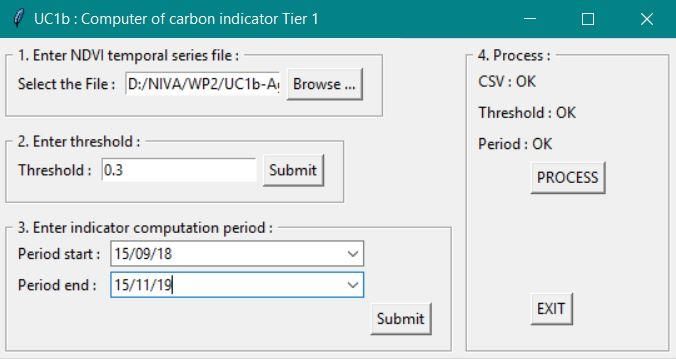
Carbon indicators                                                       Level of readyness
                                                                                                           MMS test
             LPIS      Sentinel 2                  Meteo. data           Soil map                           Tested in France

                              API                                                                           To be developped
       SEN4CAP
         (NDVI)                       Image        AgriCarbon-EO
                                    processor
                                          SEN4CAP API                                                              FMIS
                                                    Prosail                                                 (harvest, orga.
     Stand alone                     NDVI            (Jacquemoud
                                                                      LAI     SAFY-CO2                      amendments)
     operational                                      et al. 2009)
                                                                                (Pique et al.
        TIER 1                        TIER1                                      2020 a&b)

      calculator                    calculator
                                                                                                             API

                                                    FMIS Interface                                 Pixel scale C budget (gC.m-2)
                                                   TIER2                TIER3
                                                 Calculator           Calculator
                                                                     AMG (Clivot
                                                                     et al. 2019)

     CO2 fixation/emission
                                                                                                                      5
TIER 1 plot map (net CO2 flux)              TIER 2 plot map (C budget)                          TIER 3 pixel map (C budget)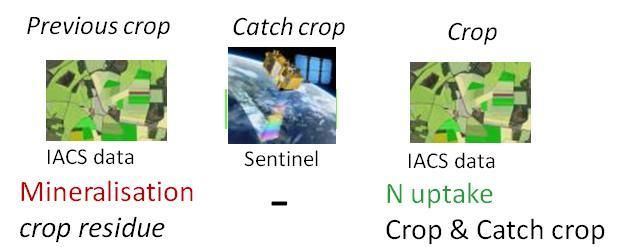
Carbon indicator Tier 1 : principle
 • Objective: estimate empirically the net annual CO2 flux at
   parcel level
                         – The net annual CO2 flux is related to number of days of vegetation
                         – Method valid only on arable land for 13 family crops
                                          Ceschia et al. (2010)                                                             class Agricultural Parcels
                        4

                                                       y = -0,0258x + 1,6851                     Araya et al. (2017)                           «codeList»
                        2                                    R² = 0,4679                                                             EmpiricalCarbonCropTypeValue
  Net annual CO2 flux

                        0                                                                                                        +    beet
       (t CO2/ha)

                             0       50    100   150      200      250         300   350                                         +    maïze
                        -2                                                                                                       +    pea
                                                                                                                                 +    potatoe
                        -4                                                                                                       +    rapeseed
                                                                                                                                 +    sorgho
                        -6                                                                                                       +    spingBarley
                                                                                                                                 +    springHardWheat
                        -8                                                                                                       +    springSoftWheat
                                 Number of days with active vegetation cover                                                     +    sunflower
                                                                                                                                 +    triticale
                                                                                                                                 +    winterBarley
  Simple relation between number of                                                                                              +    winterHardWheat
                                                                                                                                 +    winterSoftWheat
days with active vegetation and CO2 flux

                                                                                             Apply threshold on NDVI       Concerned crop families
                                                                                           profile to get number of days
                                                                                                                                                              6
                                                                                              with active vegetation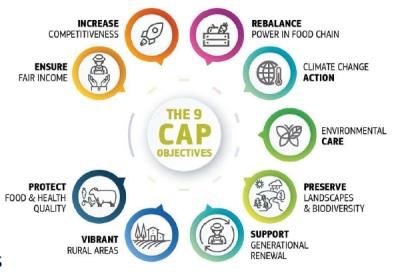
Run of the carbon Tier1 calculator

• Install open library and open software (Python) with a
  command line
• Executable files (Windows and Linux) to run the tool and fill
  out boxes
• Very simple to use

                                                      Computation of
                                                     CO2 flux at parcel
                                                           level

                                                                 7
Involved countries across EU MMS test

•   France
•   Spain
•   Netherlands
•   Denmark (planned)

                                                 8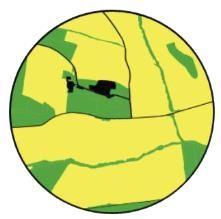
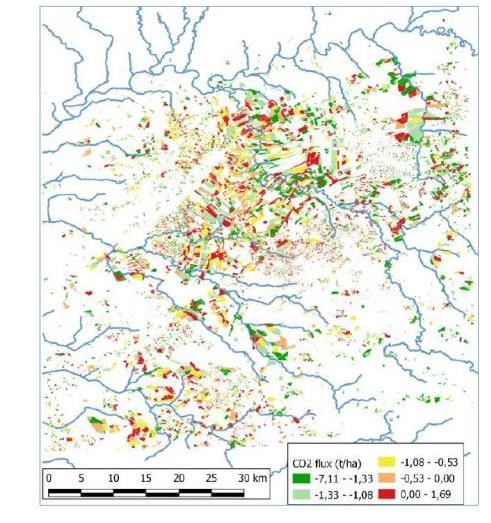
Carbon Tier 1 : Testing results
Spain (Seville)              France (Ain)

                     Negative values = annual CO2 fixation
                     Positive values = annual CO2 losses
                                                             9
Emission                     Tier 1 : Spanish Test results

                                                                     (absoption)
 Absorption

                                                             CO2 fixation

                                                                *

           * IQR for interquartile range
                                                                            10
Tier 1 : Ain Department test results
Cooler climate compared to Spain ➔ longer vegetation cycles ➔ more CO2 absorbed
More CO2 absorption in Ain Compared to Spain (fluxes are more negative)
Winter crops (long veget. cycles) are fixing more CO2 than summer crops (as expected)
11Progress concerning the other indicators
➢ Risk of Nitrate leaching (to be coded soon in AgriCarbon-EO) ➔ plot
scale
- TIER1 :
- TIER2 : same as TIER1 + climatic data + catch crop type (FMIS)
➢ Biodiversity indicator (to be tested soon in France) ➔ Landscape
TIER 1: proportion of SNH TIER 2: proportion + type of SNH TIER3:
Same as TIER 2
+ data on
pesticides
intensity
AEI
Woods, hedges, grassland, ponds
(FMIS)
Crops
Crops 12
Artificial surfaces
Artificial surfacesConclusions
➢ 3 indicators (Carbon, Nitrate and Biodiversity) adressing 3 categories of
environmental issues/ecosystem services implemented operationally at
pixel plot/landscape levels
➢ They are based on Sen4Cap standards and developped in open source
for the 3 Tiers
➢ TIER 1 could easily be implemented everywhere thanks to the IACS
data + the Sentinel data
➢Carbon TIER 1 is available on the Github and was successfully tested in
FR, SP, DK ans NL.
➢ Other tiers are under development and will be available soon. TIERs 2
and 3 will offer higher levels of accuracy/reliability but requires additional
data (FMIS or other pedoclimatic data)
➢The SEN4CAP API could be used to calculate the C & N indicators in
AgriCarbon-EO
13THANKS for Your attention !
This project has received funding from the european union’s horizon 2020
research and innovation programme under grant agreement no. 842009You can also read