Gulf Stream Temperature, Salinity, and Transport during the Last Millennium

Page created by Nathan Sharp
 
CONTINUE READING
Gulf Stream Temperature, Salinity, and Transport during the Last Millennium
Gulf Stream Temperature, Salinity, and Transport
during the Last Millennium
David Lund - University of Michigan

       • Part I - Geostrophic estimation of Gulf Stream flow
               - Gulf Stream strength varied by ~10%
               - Weaker vertical shear and transport during Little Ice Age
               - Consistent with timing of North Atlantic cooling

       • Part II - Sea-surface temperature and salinity
               - Gulf Stream salinity increased during LIA
               - Likely due to southward migration of the Inter-Tropical
               Convergence Zone

       • Part III - Linking the oceanic circulation and ITCZ
Gulf Stream Temperature, Salinity, and Transport during the Last Millennium
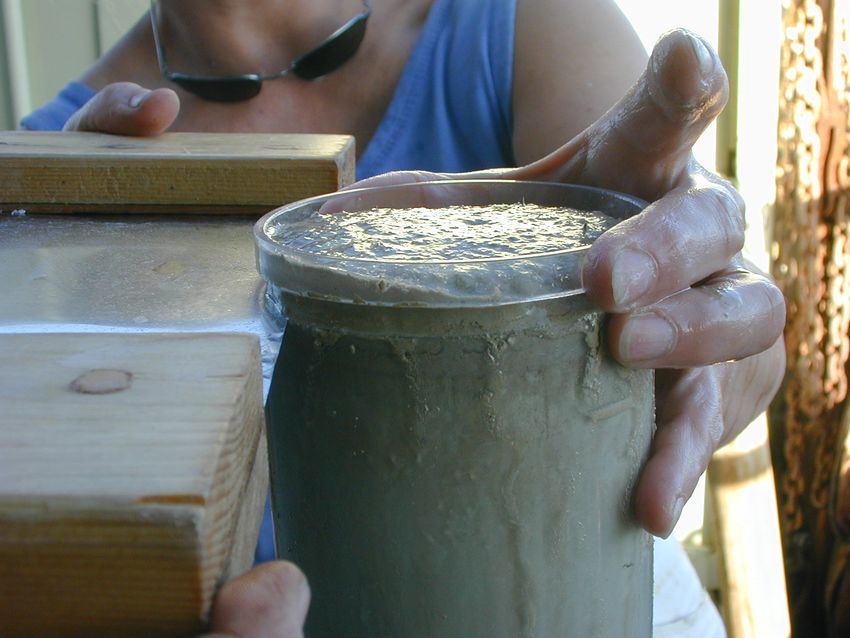
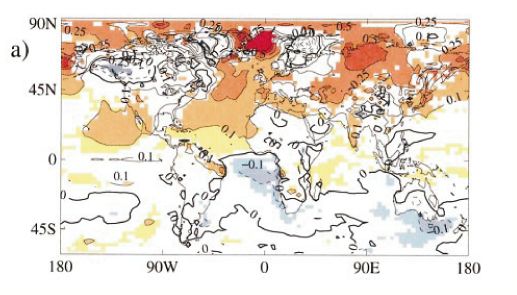
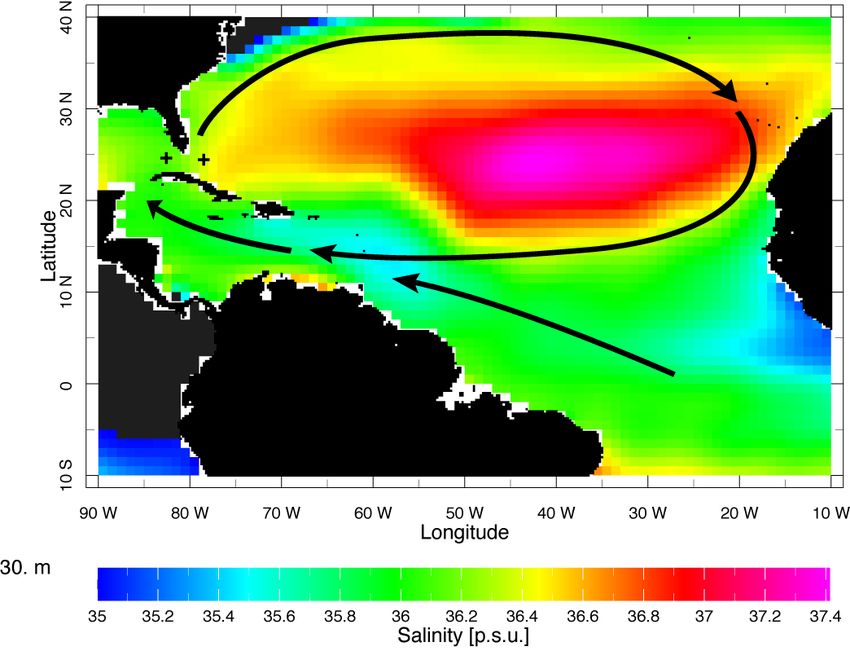
North Atlantic surface circulation

               wind-driven gyre flow

                  NADW compensation

                                       Schmitz, 1996
Gulf Stream Temperature, Salinity, and Transport during the Last Millennium
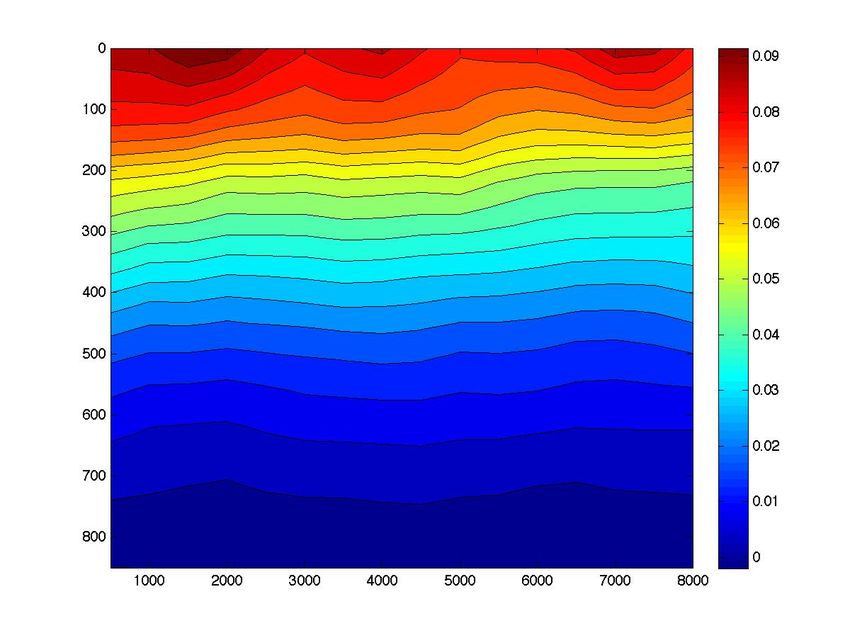
Gulf Stream volume and heat transports

               31 Sv (1Sv = 1x10⁶ m3s-1)
               1.3 PW (1PW = 1015 W)
               25-40% of heat transport due
               to shallow gyre overturning

                                              Talley, 1999
                                              Schmitz, 1996
                                              Larsen, 1992
Gulf Stream Temperature, Salinity, and Transport during the Last Millennium
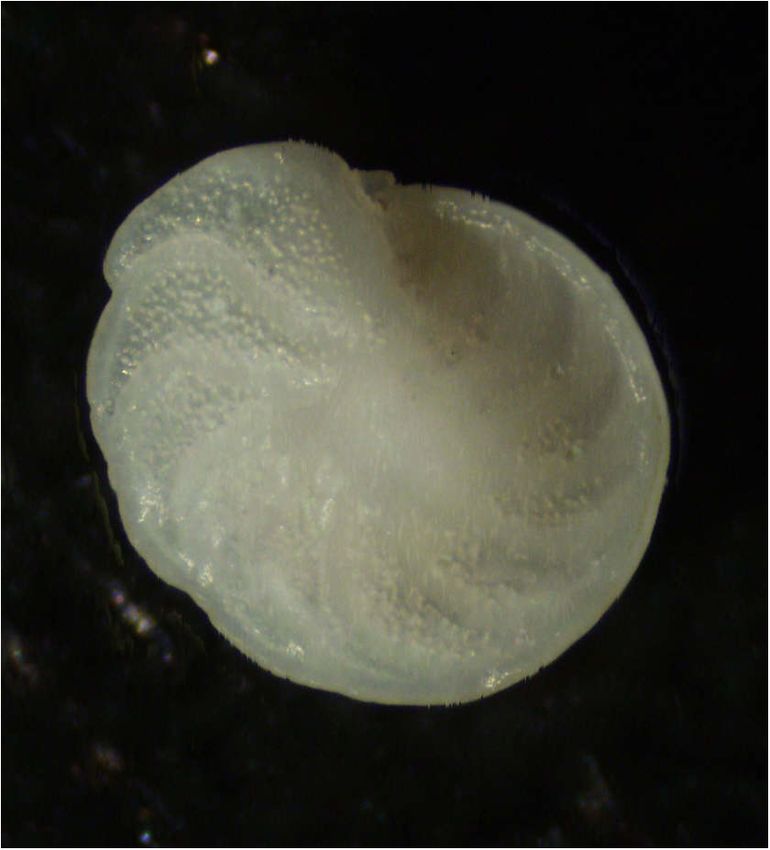
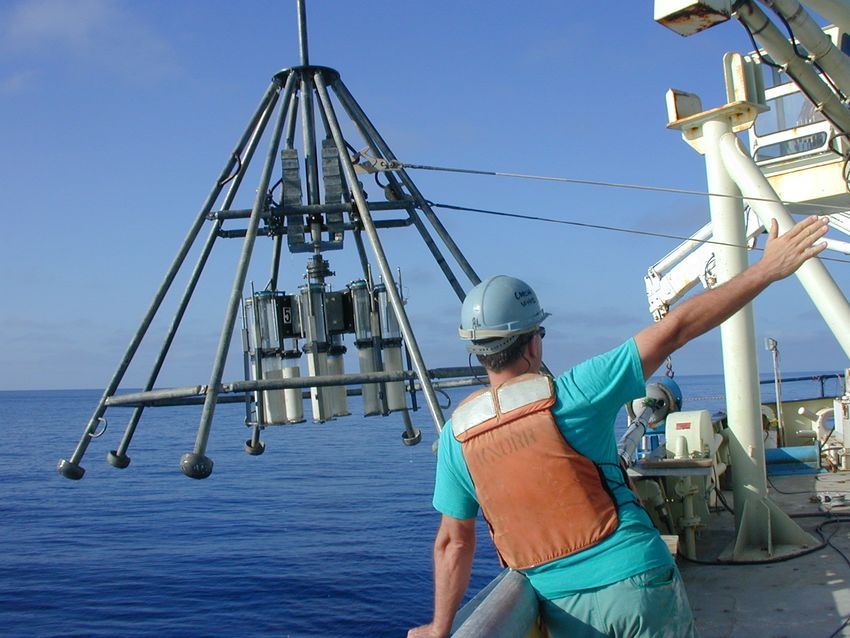
Location of core sites in Florida Straits
Gulf Stream Temperature, Salinity, and Transport during the Last Millennium
Core retrieval and sampling
Gulf Stream Temperature, Salinity, and Transport during the Last Millennium
Benthic foraminiferal δ18O and density
Cibicidoides floridanus
                          increasing S and
                          decreasing T causes
                          sea water density
                          AND foraminiferal
                          δ18O to increase
               200 µm

                                                after Lynch-Stieglitz et al., 1999
Gulf Stream Temperature, Salinity, and Transport during the Last Millennium
Foraminiferal density estimates match modern observations
                                  0

                                100                                     $RY 4ORTUGAS

                                200
                                            'REAT "AHAMA "ANK

                                300
              Water Depth (m)

                                400

                                500

                                600

                                700

                                       SYMBOLS CORETOP DATA
                                800    LINES *AN  CTD CASTS

                                  23         24           25       26       27         28
                                                         density (St)
                                                                                            Lund et al., 2006
Gulf Stream Temperature, Salinity, and Transport during the Last Millennium
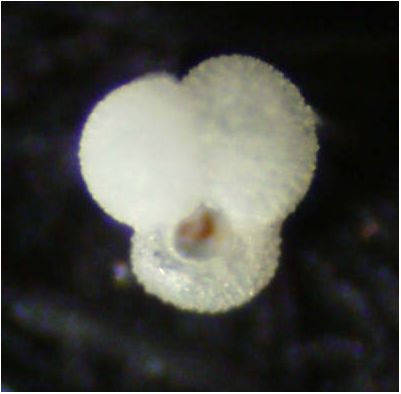
Estimating Gulf Stream transport
 Modern techniques
   - current meters ~ 29-31 Sv      Pillsbury, 1890; Schott et al., 1988; Leaman et al., 1995

   - submarine cable estimates of 29 Sv (Jan) to 33 Sv (July)
      Wertheim, 1954; Baringer and Larsen, 2001

   - geostrophic estimates ~ 28-30 Sv        Montgomery, 1941; Schmitz and Richardson, 1968

 Geostrophic estimation (using thermal wind equations)

                                        ---> vertical current shear is
            ∂v = - g ∂ρ                      proportional to horizontal
            ∂z     ρof ∂x                    density gradient
            ∂u = g ∂ρ                    * transport can be calculated only
            ∂z   ρof ∂y                  if velocity at a given depth is known
Gulf Stream Temperature, Salinity, and Transport during the Last Millennium
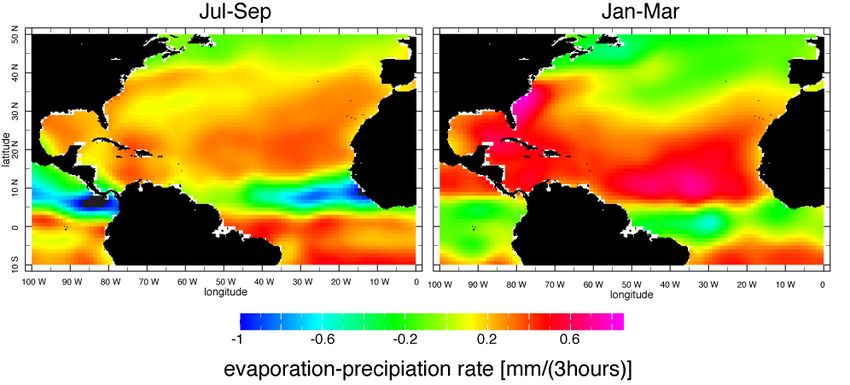
Dry Tortugas δ18O   Bahamas δ18O
Gulf Stream Temperature, Salinity, and Transport during the Last Millennium
Florida Current density cross-sections
                         200 yr BP       1100 yr BP
Lower Gulf Stream transport during Little Ice Age

                                          modern
                                          annual
                                          average

                                      what do estimates
              LIA                     of salinity tell us
                                      about LIA
                                      conditions?

                                              Lund et al., 2006
Dry Tortugas reflects tropical Atlantic salinity

Dry Tortugas
 salinity= 36.0
79ggc and 62mc

    Levitus, 1994
North Atlantic surface salinity controlled by
      evaporation-precipitation rate

           ITCZ
                                          ITCZ

         evaporation-precipitation rate

                                          daSilva et al., 1994
Calculating surface salinity using planktonic foraminifera
 Globeriginoides ruber                          δ18Ocalcite = δ18Owater - 0.20(SST) + 2.98
                                                                                             Kim and OʼNeil, 1997
                                                                                             Lynch-Stieglitz et al., 1999

                                                δ18Owater = δ18Ocalcite - 2.98 + 0.20(SST)

                          200 µm                                             5.5

                                                                             5.0

                                                          Mg/Ca (mmol/mol)
                 1.4
                                                                             4.5
                 1.2
                                                                             4.0
 δ18Owater (‰)

                 1.0
                                                                             3.5
                 0.8

                 0.6                                                         3.0
                                                                                                        Anand et al., 2003
                 0.4                                                         2.5
                   34.5   35.0   35.5    36.0    36.5
                                                                                   20   22      24     26      28            30
                            Salinity (psu)                                                    Temperature (°C)
Dry Tortugas δ18Ocalcite increased during LIA

                        95% confidence interval
G. ruber δ18O (‰)

                    100yr running mean

                                                  Lund and Curry, 2006
Dry Tortugas sea surface temperature increased during LIA

                                              Lund and Curry, 2006
Dry Tortugas δ18Ow increased during LIA

                                          salinity
                                    Lund and Curry, 2006
Dry Tortugas δ18Ow record is replicable

δ18Owater anomaly (‰)

                                                                  salinity
!
The magnitude of δ18Ow variability is due to either:
 A) influence of thermocline water             or B) incorrect Mg/Ca calibration
    LUND AND CURRY: FLORIDA CURRENT TEMPERATURE AND SALINITY                                                                   P
                                                                                 Calendar Age (yr BP)
                                                                            0   200   400   600    800   1000

                                                   !18O c (‰, PDB)
                                                                     -1.6

                                                                     -1.4

                                                                     -1.2                                   28.5

                                                                                                                    SST (ºC)
                                                                                                            28.0

                                                                                                            27.5

                                                                            *                               27.0

                                               !18O w (‰, SMOW)
                                                                     1.05

                                                                     1.00

                                                                     0.95
                                                                            *
                      Schmidt, 1999                               0.90
                      Craig & Gordon, 1965
                                                                                                           36.4

                                                                                                                   Salinity
                                                                                                           36.2
                                                                            *                              36.0

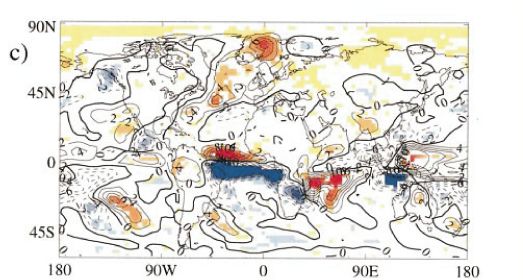
                                             based on multivariate equations of deMenocal et al., 2007
Higher LIA salinity driven by southward ITCZ migration

                ITCZ
                                               ITCZ

              evaporation-precipitation rate

                                               daSilva et al., 1994
saltier northern
                                         tropical Atlantic

                                     δ18Owater anomaly (‰)

                                       LIA

Haug et al., 2001

                    drier northern
                                                             Coherent change in northern Venezuela precipitation

                    Venezuela
Gulf Stream characterized by low transport and
 high surface salinity during the Little Ice Age
!
A function of reduced windstress curl?
                           224                             W.E. Johns et al. / Deep-Sea Research I 49 (2002
                 O.              Annual mean Sverdrup streamfunction
                                                                                           2 Sv of net in
                                                                                           and St. Luci
    WESTERLIES                                                                             consistent w
                                                                                           Sverdrup the
                                                                                           tion of water
                                                                                           much smaller
                                                                                           reasons for th
                                                                                           the return cu
                 O.                                                                      exiting the so
                                                                                           be infinitesim
                                                                                           oppose the S
                                                                                           significant red
                                                                                           Partial block
                                                                                           channels and
                  TRADES                                                                   could also co
                                                                                           either case, an
                                                                                           and the Sverd
                 O.                                                                      forced inflow
                                                                                           south of 151N
                                                                                           approximatel

        My ≈ 1 ∂Tx
                                                                                           the Sverdrup
                                                                                           feeding the Fl
             β ∂y                                                                          the subtropi
                                                                                           Caribbean no
                           Fig. 4. The annual mean Sverdrup streamfunction derived         subtropical gy
                           from Hellerman and Rosenstein (1983) winds. Johns   et al.,
                                                                        These are the 2002
                           same winds used to drive the model simulations. The region
nomalies exhibit a zonal band of increased aridity jus
              !

 orthModel
      of theresults
              equator, although
                    suggest curl opposing
                                 increases positive
                                           when ITCZprecipita
                                                    precipita-
 on migrates
     anomalies   to the south of this band are more subtle
              southward

       - forcedSignificant
 igure 2.       NCAR CAM3 using  mean
                                   SST   annual   precipitation
                                            - SST anomalies              (contours
                                                                         (contours,
                                                            scaled to simulate
       anomalies
        !1       from hosing experiment     LIA observations     !1
mm day(Zhang) &and    wind     stress
                 Delworth, 2005)        (vectors,   dyn     cm       ) anomalies
or (a) NA1, (b) NA2, (c) XTA1, (d) XTA2, (e) TNA1, and
  ) TNA2. Shading highlights positive (dark/green)                                     and
                                                                     Saenger et al., 2009
A role for the MOC?

           warm         HadCM3 surface
                  `     temp. (ºC) anomalies
             cold

                        HadCM3 precipitation
                  wet   (cm/yr) anomalies
                  `
                  dry

                             Vellinga and Wu, 2004
Conclusions
  • Gulf Stream transport varied by ~10% during the last
    millennium, but was 3±1 Sv lower during Little Ice Age

  • Surface Gulf Stream salinity increased during the LIA,
    most likely due to southward ITCZ migration

  • Simultaneous transport and salinity variability implies tight
    linkage between oceanic circulation and hydrologic cycle
    on centennial time scales

  • Southward migration of wind-field would likely enhance flow,
    implying MOC was primary driver of LIA transport anomaly
Water depth (m)
      Holocene variability in Gulf Stream transport
                     a)                                  Transport increased
                 Transport (Sv)

                                                         ~ 4 Sv during Holocene

                     b)
                                  Calendar Age (yr BP)   Lynch-Steiglitz, et al., in press

                                                             ITCZwith
gure 4. a) Calculated geostrophic flow through the Florida Straits migrated southward
                                                                      2-sigma error
         Water depth (m)

 imates. b) Geostrophic flow per unit depth (Sv m-1).!       during Holocene

                                                         Haug et al., 2001
   17 AUGUST 2001 VOL 293 SCIENCE www.sciencemag.org
Dry Tortugas δ18Owater record mimics Δ14Catm

                        Lund and Curry, 2006
North Atlantic region cooled by ~1°C during LIA

Greenland Temp. (oC)

                                Dahl-Jensen et al., 1998
                                                                                    Lamb, 1995

                       Marchitto and
                       deMenocal, 2003

                                                                                    Bond et al., 2001

                                     Keigwin, 1996
                                                           deMenocal et al., 2000
You can also read