Projected increases in surface melt and ice loss and their potential feedbacks for the Northern and Southern Patagonian Icefields
←
→
Page content transcription
If your browser does not render page correctly, please read the page content below
Projected increases in surface melt and ice loss and their potential
feedbacks for the Northern and Southern Patagonian Icefields

Claudio Bravo 1*, Deniz Bozkurt2, Andrew N. Ross3 and Duncan J. Quincey1
1 School of Geography, University of Leeds, Leeds, United Kingdom.
2 Departamento de Meteorología, Universidad de Valparaíso, Valparaíso and Centro de Ciencia del Clima y la Resiliencia (CR)2, Santiago, Chile.
3 School of Earth and Environment, University of Leeds, Leeds, United Kingdom.

* now at Centro de Estudios Científicos, Valdivia, Chile.

 April 2021 vEGU
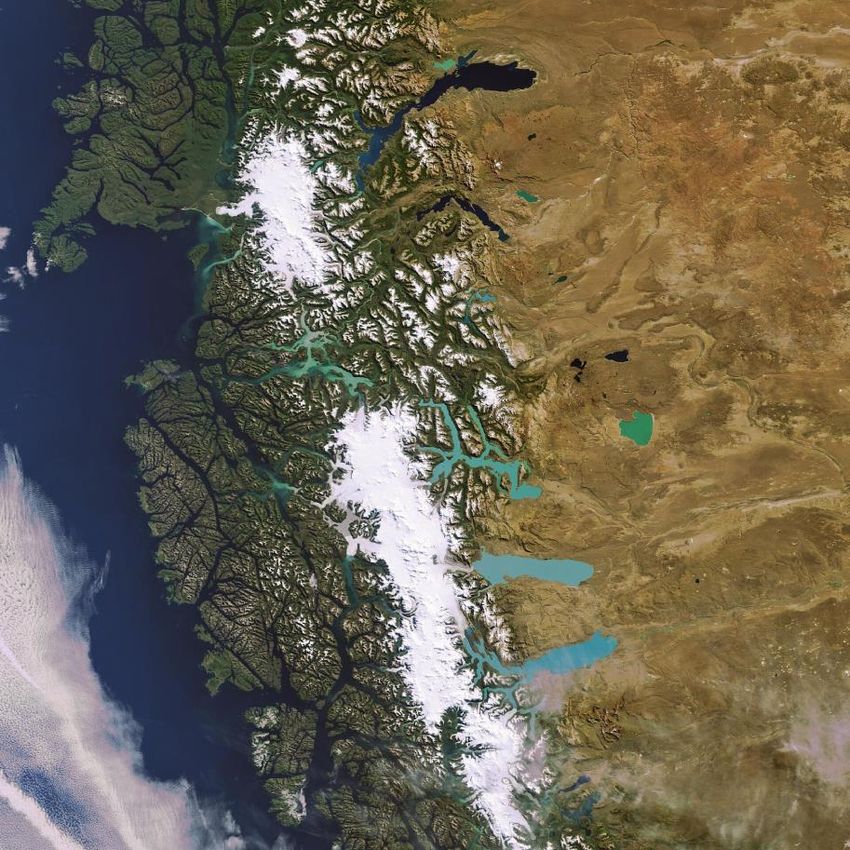
1. Background
 Ice loss (Braun et al., 2019)
 Patagonia (40°S-55°S) is the region of
 Air temperature increase
 South America with the largest glaciers,
 most of which shrinking rapidly
 including the Icefields.

 3. Villa O’Higgins

 Minowa et al. (2021)
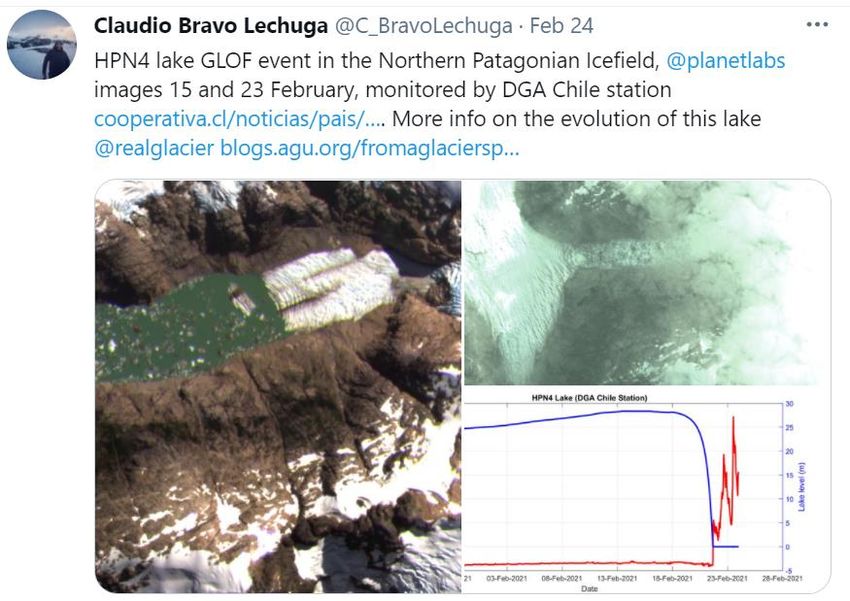
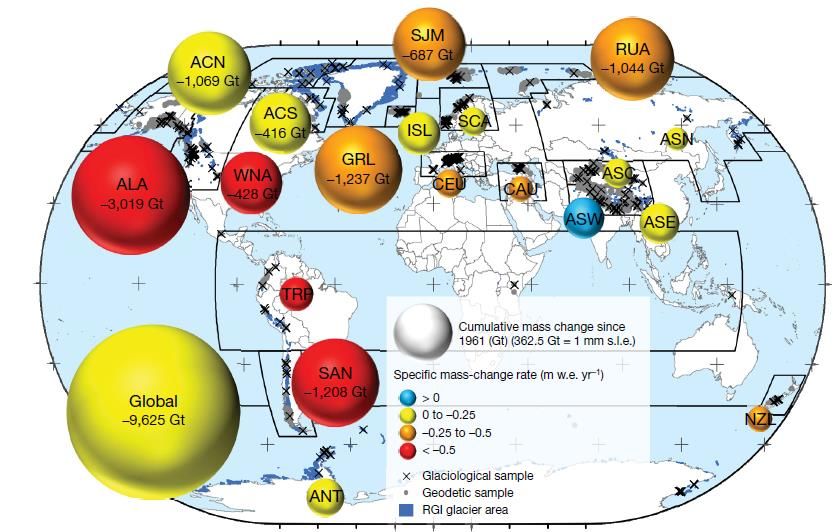
2. Why to assess the future response of the Patagonian Icefields?
 Worldwide implications:

 • Concern exists in relation to their sea-level rise contribution (Zemp et al., 2019).

 Regional implications:

 • An increase demand on water resources for irrigation, domestic consumption and industrial
 activities has been recognized in southern South America and glacier meltwater are recognized as
 one of the main supplies (Immerzeel et al., 2020).

 Local implications:

 • Increase in both area and number of glacial lakes (Loriaux et al., 2013, Wilson et al., 2018,
 Shugar et al., 2020).
 • Increase in landslide occurrence and glacial-lake outburst flood (GLOFs) events
 (Dusaillant et al., 2010, Wilson et al., 2018, Iribarren-Anacona et al., 2015).
 • Increase in debris-covered area over ice surfaces (Glasser et al., 2016).
 • Impacts on aquatic ecosystem and sediment dynamics (Gutierrez et al. 2015; Quiroga et al.,
 2016).
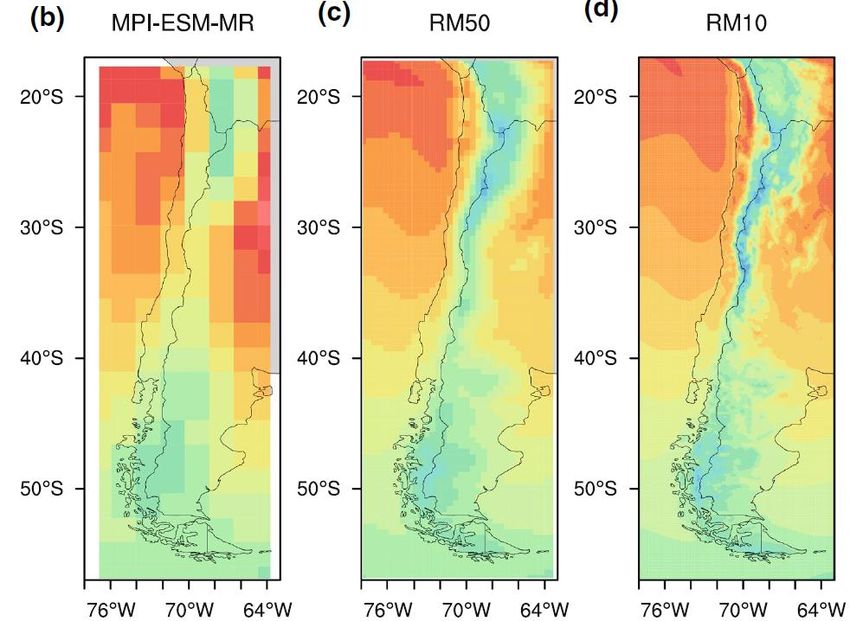
3. Aim
• to model the surface glacier mass balance response to future climate change on the Patagonian Icefields.

4. Materials and Methods
Approach: focus is on modelling the future response of both Icefields under two pathway scenarios using a regional climate model

 • RegCM4.6/MPI-ESM-MR Earth System
 Model (Bozkurt et al., 2019).
 • Daily data. ~10 km spatial resolution
 • Historical period (1976-2005).
 • RCP (2006-2050) 2.6 and 8.5.

 Ablation, Energy Balance Model (EBM):
 = 1 − + + + ℎ + +

 Accumulation:
 Phase Partitioning Methods (PPM, Bravo et al., 2019)
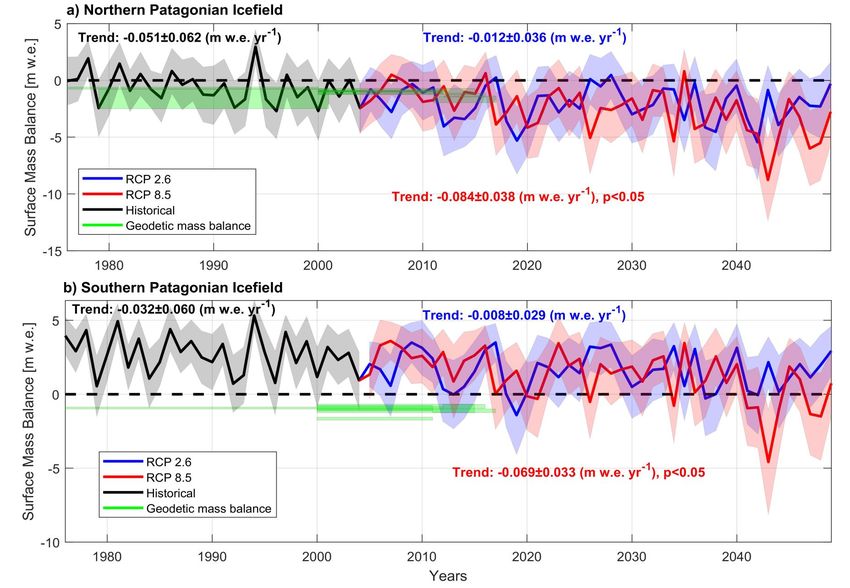
5. Results: Modelling the surface mass balance

 -2.0±2.5 m w.e. • For the historical period, the
 mean SMB was negative in the
 NPI, in agreement with
 previously published geodetic
 -0.6±2.1 m w.e. mass balances in comparable
 periods.

 -2.5±2.6 m w.e. • The NPI will be characterized
 by a notable negative SMB
 until 2050.

 1.6±1.9 m w.e. • No agreement with the
 geodetic mass balance.

 • The SPI will continue to gain
 mass but with lower values
 2.7±1.6 m w.e. compared to the historical
 period.

 1.3±2.0 m w.e.
6. Results: Components of the surface mass balance

 NPI NPI

 SPI SPI

 Sauter (2020)

 The variance of the annual SMB depends largely on the ablation (R2 0.88 and 0.94 for the NPI and SPI
 respectively) rather than accumulation (R2 of 0.57 and 0.73).
7. Results: Frontal ablation
 Zeroth-order assumption
 Frontal ablation Frontal ablation is computed as the difference between surface
 recent past = future
 mass balance and geodetic mass balance (Schaefer et al., 2015).

 NPI: 2.4 Gt yr-1 (1975-2016) For the NPI, we derive a total frontal ablation contribution of 2.4 Gt yr-1 in
 Minowa et al. (2021): 2.5 Gt yr-1 (2000-2019)
 accordance with the robust estimation by Minowa et al. (2021) which estimated
 2.5 Gt yr-1.

 SPI: 46 Gt yr-1 (1975-2016) The frontal ablation estimated by Minowa et al. (2021) in the SPI reaches 21.6 Gt
 yr-1, which is far lower than our estimation and previous ones. To match this
 Schaefer et al. (2015): 40 Gt yr-1 (1975-2000)
 55 Gt yr-1 (2000-2011) value, the SMB in the SPI must decrease ~1.5 m w.e. This reduction is in the SMB
 uncertainty range and could be associated mainly with the high uncertainty in
 Minowa et al. (2021): 22 Gt yr-1 (2000-2019)
 define the actual accumulation.

 If this is the case, the actual accumulation rate in the SPI will
 be close to the estimated by Sauter (2020) between 2010 and
 2016, which is in the lower bound of the present estimation.

 Sauter (2020)
8. Results: Projected contribution to sea level-rise
 Cumulative mass change estimated for both icefields
 combined between 2012 and 2050. For comparison
 purposes, data from GlacierMIP is showed (grey
 Sea-level rise:
 area). GlacierMIP ice mass loss corresponds to all the
 3.1 mm – 3.8 mm
 models runs under scenarios RCP2.6 and 8.5
 Volume loss
 computed for the Southern Andes RGI region. Ice
 22% - 27%
 mass loss estimations by Abdel-Jaber et al. (2019),
 Foresta et al.(2019) and Li et al. (2019) for the four
 first years (2012-2016) are also shown. Inset,
 corresponds to a detailed view of this period. Total
 equivalent sea-level contribution to year 2050 and ice
 loss volume is indicated.

 Comparison of estimated sea-level contribution
 from the Patagonian Icefields by several authors.
 Data correspond to the annual rate estimate for the
 respective period.
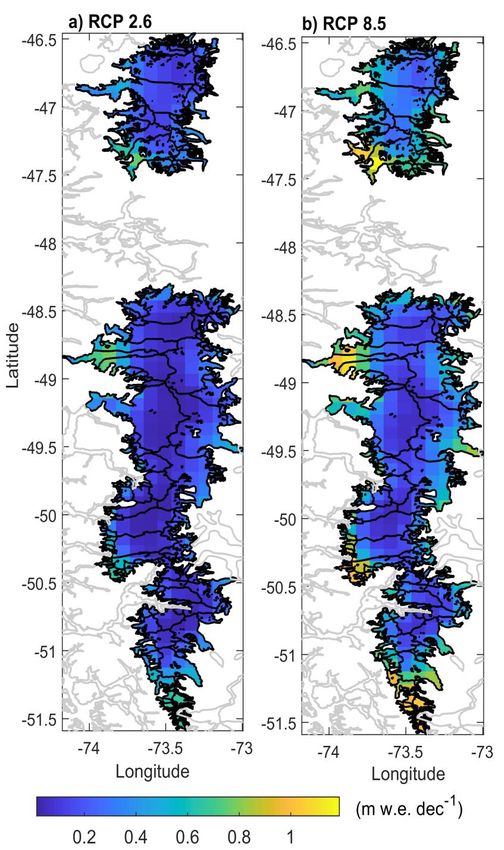
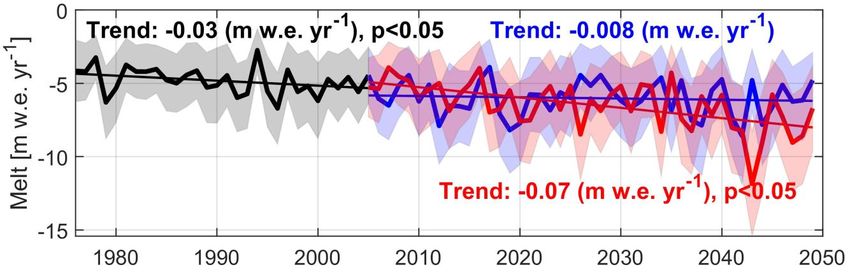
9. Feedbacks

 Not accounted in the modelling (future work?):
 • Debris cover area increase (Glasser et al., 2016)
 Spatially distributed
 • Supraglacial lake (Lo Vecchio et al., 2019)
 melt trends over the
 • Nunataks area increase (Carrión et al., in preparation) Patagonian Icefields
 estimated with the
 EBM. Trends are from
 The main reason for the decrease in SMB is related to the hydrological year
 projected increases in meltwater, which in turn could 1976/77 to 2049/50,
 trigger other mechanisms of glacier mass loss following after 2005
 associated with ice dynamics and frontal ablation in the pathway scenario
 glaciers with calving fronts (e.g. Minowa et al. 2017, RCP 2.6 (a) and the
 2021). pathway scenario
 RCP8.5 (b). Black
 lines are the glacier
 It is expected that the ice loss of some glaciers will be basins and grey lines
 faster due to the presence of meltwater which acting are coastlines. All the
 as an ice loss positive feedback. For instance, Steffen grid points are
 and Acodado glaciers (red square), where a higher rate significant (p
10. Key messages The Patagonian Icefields in 2021:

Accumulation is still not well constrained. Models overestimate the accumulation
especially in the SPI (Why the precipitation seems to be better represented in the NPI
compared to the SPI?)

The atmospheric signal in the overall glacier mass loss it is more evident in the NPI
(negative geodetic and surface mass balance) than in the SPI (negative geodetic mass
balance and positive surface mass balance).

 The Patagonian Icefields in 2050:
 Lower surface mass balance for both Icefields. Negative in the NPI and positive (or barely
 negative) in the SPI.

 Sea-level rise between 3.1 and 3.8 mm due to Patagonian Icefields ice loss between 2012
 and 2050.

 A total volume reduction for both Icefields between 22% and 27% is projected under the
 RCP2.6 and RCP8.5 respectively.

 The main reason for the decrease in SMB is related to projected increases in meltwater, which in turn could
 trigger other mechanisms of glacier mass loss associated with ice dynamics and frontal ablation in glaciers
 with calving fronts.
Questions?

 ¡Muchas gracias! Contacto: cbravo@cecs.cl

Acknowledgments
 @C_BravoLechuga
Cluster River Basin Processes and Management – School of Geography
ANID Becas-Chile Scholarship program
CECs (logistic for four field campaigns)

 2021
You can also read