Airbnb Report - US Virgin Islands Tourism Statistics
←
→
Page content transcription
If your browser does not render page correctly, please read the page content below
USVI Division of Economic Research
  examined Airbnb and Tourism related
       indicators for the period of
     January 2018 December 2019.

Airbnb
Report
April 2020

USVI Division of Economic Research
Overall Summary
The agreement between Airbnb and the Government of the Virgin Islands was signed in late
May of 2017. The agreement was a part of Government’s Five Year Plan to fully restore
economic stability through economic growth, increased revenue collection and better resource
management. Additionally, the accord would assist in improving and diversifying the tourism
industry and create unique experiences by local Airbnb hosts and their guests. In September
2017, Hurricanes Irma and Maria caused over 60 percent loss of traditional hotel room inventory.
Presently, Airbnb accommodations have partly contributed to the number of increase rental
units’ availability to stay-over visitors to the Territory. For this report, Division of Economic
Research, Office of Management and Budget (DER-OMB) examined Airbnb and Tourism
related indicators for the period of January 2018 to December 2019.
Major Carriers
The Division of Economic Research collects Territorial major carrier direct weekly seats based
on daily scheduled flights from U. S. mainland carriers, or charter flights that operate outside the
Caribbean. Due to the storms and loss of major hotels, the airlines reduced the number of
incoming flights to the Territory. American, Delta, JetBlue, and Spirit airlines all reduced the
number of weekly flights for the first quarter of 2018. Charter flights from Norwegian and Sun
Country Airlines opted to suspend service for both the 2017-2018 and the 2018-2019 winter
seasons. United Airlines discontinued flights until February 2018. The number and demand of
scheduled flights are tied directly to the number of traditional hotel rooms. Therefore, the
expansion of airline schedule and air passengers coincides with additional hotel rooms being
added by hoteliers that come back online.
Graph 1
Annual Major Carriers Direct Seats
2016-2019
Major Carriers Direct Seats
17,837 15,278
9,926 12,903
2016 2017 2018 2019
Source: USVI Division of Economic Research
USVI Division of Economic Research Page 1In Graph 1, 2018 major carrier seats averaged 9,926 compared to 15,278 direct seats for the corresponding period in 2017, a decline of 35.0 percent. In 2016, the USVI averaged 17,837 in average seats. The 14.3 percent difference in direct seats for the years 2016 and 2017, were partly contributed hurricanes effect on the Tourism industry for the last quarter of 2017. Department of Tourism Marketing Initiatives The USVI Department of Tourism (DOT) embarked on repositioning the Territory following Hurricanes Irma and Maria. Since the storms, villas, guesthouses, and smaller hotels have begun to reopen. In some cases, the establishments opened with fewer rooms available or only rooms being offered to emergency, construction, or recovery workers. DOT began a “sharing program” with Airbnb, villas, other accommodation entities number of Territorial rooms available. This is a DOT strategic marketing initiative design to build availability of rental rooms, thereby, increasing major carriers’ attraction of offering additional direct seats. In the past two years, DOT has worked to return and expand flights to the Territory. In 2018, JetBlue, Sprit, and Delta Airlines reinstated flights to the St. Thomas-St. John district. American Airlines returned the Charlotte, North Carolina flight and Sprit began the inaugural Fort Lauderdale-Hollywood nonstop flights to the island of St. Croix. In 2019, American Airlines began Midwest service from Dallas-Fort Worth and Chicago to the St. Thomas-St. John district. The Saturdays Dallas-Fort Worth flights is year-round on a Boeing 757 aircraft with 176 seats. The Saturday service between Chicago O’Hare International and Gov. Cyril E. King Airport will operate seasonally on Airbus 319 aircraft with a capacity of 128 seats. Graph 2 Source: USVI Division of Economic Research USVI Division of Economic Research Page 2
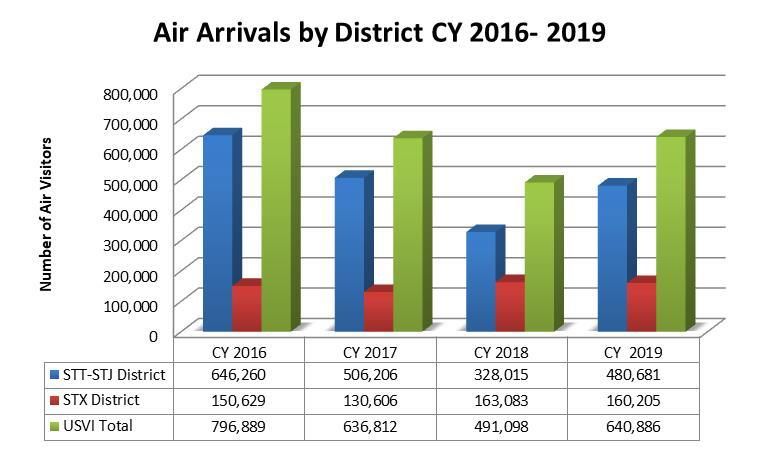
Air Arrivals

  Overall, Territory’s air arrivals grew to a healthy 30.5 percent from 491,098 in 2018 to 640,886
  in 2019. The growth is partly due to continued reopening of accommodation establishments and
  availability of rooms. Annual air arrivals to the St. Thomas-St. John district increased to
  480,681 from 328,015 reported during the same period in 2018--a gain of 46.5 percent. On the
  other hand, the St. Croix district saw a reduction in air arrivals, posting a modest of 1.8 percent
  loss from 163,083 to 160,205. In Graph 2, approximately, 796,889 air travel visitors came to
  USVI shores. Despite the 2017 storms, the Territory welcomed 636,812 air visitors.

  Airbnb

  Table 1 illustrates the Territorial Airbnb active listings, average length of stay and guest arrivals
  from January-December 2018 and January-December 2019. In 2018, the approximate number
  of Airbnb active rooms, villas, and other accommodation units during period were 1,575 and
  increase to 2,200 rooms in 2019. Airbnb guests arrivals rose to 72,150 from 32,600 an increase
  121.3 percent. The average size of a group comprises of two people. The average length of stay
  of 4.9 nights is on par with data reported to the agency from Territory-wide accommodation
  establishments. The May 2017 signed agreement allows the online lodging entity to administer
  and collect a 12.5 percent Room Occupancy Tax; on behalf of the hosts and remit the funds to
  the local USVI Bureau of Internal Revenue (BIR). In 2019, Airbnb hotel room occupancy tax
  collections were $2,647,431, a 94.9 percent gain from the reported $1,358,024 collected one year
  earlier.

  Table 1

  Year           Average      Age        Current Active Listings   Guest Arrivals   Average      Length   of
                 Group Size              (Average)                                  Stay
  2018           2.0          39.0       1,575                     32,600           4.9 nights
  2019           2.2          40.5       2,200                     72,150           4.9 nights
Source: USVI Department of Tourism and Airbnb
Complied: USVI Division of Economic Research

  USVI Division of Economic Research                                                             Page 3
Please note: The information provided in this report reflects aggregate data provided to the USVI Department of Tourism based on the agreement with Airbnb. The Division of Economic Research and the Department of Tourism are working to obtain additional profile data on Airbnb guest including by district or by island. This report should serve as a snapshot of Airbnb activities with the U.S. Virgin Islands. USVI Division of Economic Research Page 4
You can also read