Volkswagen Group
5-Year Planning Round: Groundwork to Deliver Strategy 2025
←
→
Page content transcription
If your browser does not render page correctly, please read the page content below

Volkswagen Group 5-Year Planning Round: Groundwork to Deliver Strategy 2025

Disclaimer
The following presentations contain forward-looking statements and information on the business development of the Volkswagen Group. These statements may be
spoken or written and can be recognized by terms such as “expects”, “anticipates”, “intends”, “plans”, “believes”, “seeks”, “estimates”, “will” or words with similar
meaning. These statements are based on assumptions relating to the development of the economies of individual countries, and in particular of the automotive
industry, which we have made on the basis of the information available to us and which we consider to be realistic at the time of going to press. The estimates given
involve a degree of risk, and the actual developments may differ from those forecast. The Volkswagen Group currently faces additional risks and uncertainty related
to pending claims and investigations of Volkswagen Group members in a number of jurisdictions in connection with findings of irregularities relating to exhaust
emissions from diesel engines in certain Volkswagen Group vehicles. The degree to which the Volkswagen Group may be negatively affected by these ongoing
claims and investigations remains uncertain.

Consequently, a negative impact relating to ongoing claims or investigations, any unexpected fall in demand or economic stagnation in our key sales markets, such
as in Western Europe (and especially Germany) or in the USA, Brazil or China, will have a corresponding impact on the development of our business. The same
applies in the event of a significant shift in current exchange rates relative to the US dollar, sterling, yen, Brazilian real, Chinese renminbi and Czech koruna.

If any of these or other risks occur, or if the assumptions underlying any of these statements prove incorrect, the actual results may significantly differ from those
expressed or implied by such statements.

We do not update forward-looking statements retrospectively. Such statements are valid on the date of publication and can be superseded.

This information does not constitute an offer to exchange or sell or an offer to exchange or buy any securities.

5-Year Planning Round: Groundwork to Deliver Strategy 2025

        Frank Witter                        Fred Kappler
     Member of the Board of                Head of Group Sales
   Management, Volkswagen AG                 Volkswagen AG
     Finance and Controlling
Intro

Setting the Stage

Core Strategy remains unchanged

Worldwide emissions regulations updated for new more stringent rules

Increased headwinds fully compensated by improved operational
performance

Positive 2017 Financial indicators as springboard

Net liquidity as robust foundation

                                                                       1
KPIs

Group Milestones: Quick Refresh
Key financial targets                     2016       2017
                                         Actual     Targets
                                                     CMD March

Operating return on sales                 6.7%        6-7%
Before Special Items

Return on investment
Automotive Division before Special       13.9%      11-13%
Items

Capex ratio                               6.9%        6.6%
Automotive Division

R&D cost ratio                            7.3%        6.7%
Automotive Divison

Cash              a) Net Cashflow       € 4.3 bn     negative
Automotive Division
                     b) Net Liquidity   € 27.2 bn   > € 15 bn

                                                                 2
KPIs

Group Milestones: Updated Outlook Q3 2017
Key financial targets                     2016       2017           2017
                                         Actual     Targets        Outlook
                                                     CMD March

Operating return on sales                 6.7%        6-7%
                                                                   moderately
Before Special Items                                              exceed 6-7%

Return on investment                                               moderately
Automotive Division before Special       13.9%      11-13%       exceed 11-13%
Items

Capex ratio                               6.9%        6.6%          ~6.6%
Automotive Division

R&D cost ratio                            7.3%        6.7%          ~6.7%
Automotive Divison

Cash              a) Net Cashflow       € 4.3 bn     negative      negative
Automotive Division
                     b) Net Liquidity   € 27.2 bn   > € 15 bn     > € 20 bn

                                                                                 3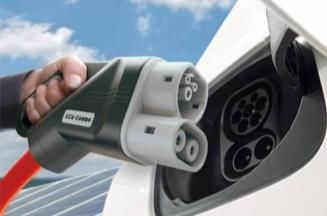
KPIs

Group Milestones: Updating 2020 and 2025
Key financial targets                     2016       2017           2017          2020          2025
                                         Actual     Targets        Outlook       Targets       Targets
                                                     CMD March

Operating return on sales                 6.7%        6-7%
                                                                   moderately
                                                                                 6.5-7.5%       7-8%
Before Special Items                                              exceed 6-7%

Return on investment                                               moderately
Automotive Division before Special       13.9%      11-13%       exceed 11-13%
                                                                                 13-15%         > 15%
Items

Capex ratio                               6.9%        6.6%          ~6.6%          6%            6%
Automotive Division

R&D cost ratio                            7.3%        6.7%          ~6.7%          6%            6%
Automotive Divison

Cash              a) Net Cashflow       € 4.3 bn     negative      negative
Automotive Division                                                                          ~10% of Group
                     b) Net Liquidity   € 27.2 bn   > € 15 bn     > € 20 bn      > € 20 bn      turnover

                                                                                                         4
KPIs

Group Milestones: Updating 2020 and 2025
Key financial targets                     2016       2017           2017          2020          2025
                                         Actual     Targets        Outlook       Targets       Targets
                                                     CMD March

Operating return on sales                 6.7%        6-7%
                                                                   moderately
                                                                                 6.5-7.5%       7-8%
Before Special Items                                              exceed 6-7%

Return on investment                                               moderately
Automotive Division before Special       13.9%      11-13%       exceed 11-13%
                                                                                 13-15%        > 15%
Items

Capex ratio                               6.9%        6.6%          ~6.6%          6%            6%
Automotive Division

R&D cost ratio                            7.3%        6.7%          ~6.7%          6%            6%
Automotive Divison

Cash              a) Net Cashflow       € 4.3 bn     negative      negative        ≥ 10          > 10
Automotive Division                                                                          ~10% of Group
                     b) Net Liquidity   € 27.2 bn   > € 15 bn     > € 20 bn      > € 20 bn      turnover

                                                                                                         5
Guidance
Updating Guidance Group Financial Performance 2020
Result 2016 2020 Update
CMD March PR 66
Sales revenue (€ bn) 217.3 + > 20 % + > 25 %
after before
Special Items Special Items
Operating profit (€ bn) + 25 % + ≥ 25 %
7.1 14.6
Profit before tax (€ bn) 7.3 14.8 + ≥ 25 % + ≥ 30 %
Earnings per Pref. Share 10.3 € + ≥ 25 % + > 25 €
6SUV
Strong Increase in our SUV mix
SUV mix by region based on expected regional Group sales
SUV segment share
~50% NAR
50%
China
~40%
Europe
30%
~34%
20%
18%
10%
2016 2017 2018 2019 2020 2021 2022
7RoS
Improving Group results despite significant headwinds
Moderately
• Industry transition
exceed 6.5 - 7.5%
Return on Sales
› e-mobility
6.0 - 7.0% › Digitalization
6.7% › Autonomous Driving
› Mix Trend (+SUV‘s/-diesel)
• Emission costs
› EU -27% CO2 emission
› US -35% CO2 emission
› CN -40% l/km consumption
2016 2017 2020
Base Outlook Target
8Architecture
Key to profitability and delivery of our electric vehicle strategy
Roadmap E
New mobility
3rd EV wave 3)
2nd EV wave 2)
1st EV wave 1)
SUV expansion Transformation
Conventional product portfolio
Toolkit strategy mainly based on MQB & MLB
Engines strategy
2017 2018 2019 2020 2021 Leader in e-mobility 2030
Global leader
in mobility
1) mainly based on MEB
2) based on PPE (dedicated Architecture for premium segment)
3) based on SPE (dedicated Architecture for sport segment)
9RoS
Improving Group results despite significant headwinds
Moderately
• Industry transition
exceed 6.5 - 7.5%
Return on Sales
› e-mobility
6.0 - 7.0% › Digitalization
6.7% › Autonomous Driving
› Mix Trend (+SUV‘s/-diesel)
• Emission costs
› EU -27% CO2 emission
› US -35% CO2 emission
› CN -40% l/km consumption
2016 2017 2020
Base Outlook Target
10Dividend
Sufficient Net Liquidity as a basis for increasing payout toward target
Dividend pay-out ratio 1)
30%
21% 21%
20%
2013 2014 2015 2016 within next 5 years
1) Total dividend in percent of net income attributable to shareholders
11Summary
Upcoming tasks to master challenges and make use of opportunities
Improving the core business
• Safeguarding the profitability in core regions; ongoing recovery
in NAR/SAM/Russia
• Future pact continues to be implemented
• Strong cash generation and capex/R&D discipline as a
precondition
Transformation towards more E-Mobility
• Working on CO2 Compliance / WLTP implementation
• Profitability of Electric Vehicles
Strengthen innovation power
• Be software leaders in Digitalization & Connectivity
• Deliver profitable Mobility Services
12You can also read