Wood Group Investor Briefing - Q1 2016
←
→
Page content transcription
If your browser does not render page correctly, please read the page content below
Wood Group Investor Briefing
Q1 2016
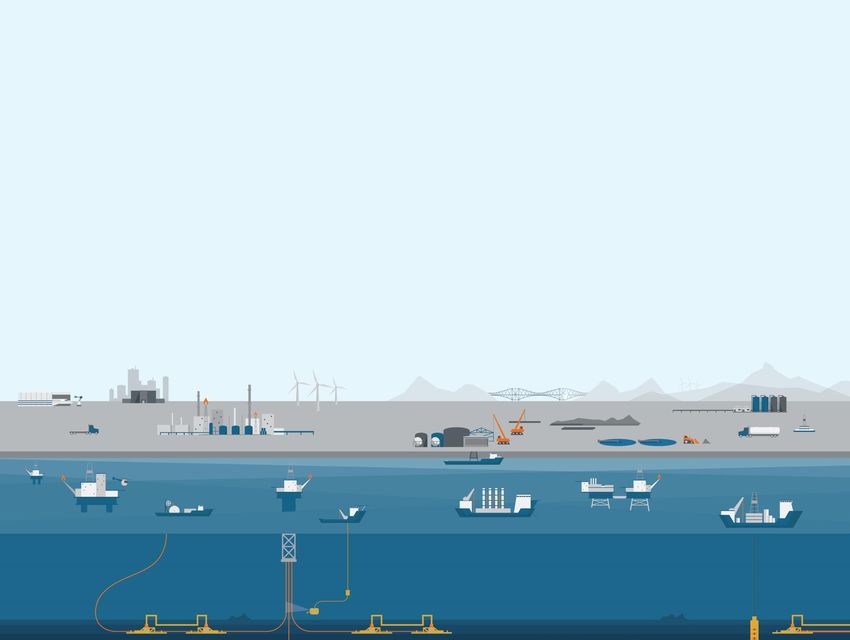
Our business Wood Group is an international projects, production and specialist technical solutions provider with around $6bn sales and 36,000 employees. We are focused primarily on the provision of engineering and production support solutions on a reimbursable basis to the upstream, midstream and downstream oil & gas sector. We help customers design, build, maintain and safely operate facilities through asset lifecycles. As an asset-light, people focused business, our track record on industry leading projects is driven by our expertise and capability.
Our business

                 Downstream,                             Facility
                 chemical process,                       construction
 Life of field   automation          Clean    Subsea &   maintenance    Industrial              Decommissioning
 services        & industrial        energy   pipeline   management     services     Upstream   services
Inputs Outputs
Safety first attitude Strong shareholder returns (AEPS 2002
Strong Core Values to 2015 annualised growth of 13%)
Unrivalled technical capability and Leading engineer and production
experience support solutions
Talented, flexible and motivated workforce Unrivalled track record on industry
leading projects
Innovative, efficient and effective processes
Global reach with long term customer
Low risk, commercial model relationships
Efficient capital allocation and robust Significant contribution to local
balance sheet employment and communitiesWood Group Engineering (c.30% of revenue) Through Wood Group Mustang and Wood Group Kenny, we provide a wide range of specialist engineering services including conceptual studies, engineering, project & construction management (EPCM) and control systems upgrades to the upstream, subsea & pipeline, downstream, chemical process, automation & industrial and clean energy sectors. US$ million 2011 2012 2013 2014 2015 Revenues 1,459 1,787 1,985 2,131 1,729 EBITA 162 220 246 232 215 Margin (%) 11.1% 12.3% 12.4% 10.8% 12.4%
Wood Group PSN (c.70% of revenue)
We provide services to the upstream, midstream,
downstream & industrial sectors through brownfield
engineering and modifications, production enhancement,
operations and maintenance, facility construction and
maintenance management, industrial services, training and
decommissioning services.

 US$ million   2011      2012      2013      2014      2015
 Revenues      3,013     3,691     3,996     4,636     3,448

 EBITA          153       205       262       342       258

 Margin (%)    5.1%      5.6%      6.6%      7.4%      7.5%
Developing on our broad, customer-aligned business

         Capex (40%)                          Opex (60%)

                                                                Upstream
                                                            Offshore, Onshore,
                                                             Unconventional

                                                           Subsea & Pipelines

                                                       Downstream, Process &
                                                                        Industrial
                                                             Industrial

    Geographies                   Customers          Markets and Sectors

                       Reimbursable (90%)                           Fixed price (10%)
Organic and acquisition led EBITA growth
Track record of organic and acquisition led growth 2002: Initial Public Offering
Completed around 50 acquisitions since IPO 2011: PSN acquisition
50% of growth organic, 50% through acquisition 2011: Well Support divestment
Note: EBITA (or in exceptional circumstances, a reasonable estimate of EBITA) generated in the year of acquisition is treated as acquired growth and the annualised calculation
of the year 1 result is used for year 2 and beyond. Any growth exceeding the annualised figure from these acquisitions is treated as organic. For the purposes of this analysis,
the acquisition of PSN in 2011 has no impact on acquisition EBITA. Given the annualised contribution from Well Support in 2011 exceeded that of PSN, we elected not to include
negative acquisition EBITA in the analysis which would have had an impact on organic growth.
8AEPS and dividend growth through cycle
120 35
30
100
25
80
Dividend (Cents)
AEPS (Cents)
20
60
15
40
10
20
5
0 0
2002 2003 2004 2005 2006 2007 2008 2009 2010 2011 2012 2013 2014 2015
AEPS DPS
Adjusted Earnings per share 2002 to 2015 CAGR: 13.3%
Dividend 2002 to 2015 CAGR: 19.5%
2015 dividend cover: 2.8x
9Disclaimer This document has been prepared by the Company solely for use at presentations held in connection with investor briefings in 2016. The information in this document has not been independently verified and no representation or warranty, expressed or implied, is made as to, and no reliance should be placed on, the fairness, accuracy, completeness or correctness of the information or opinions contained herein. None of the Company or any of its affiliates, advisors or representatives shall have any liability whatsoever (in negligence or otherwise) for any loss whatsoever arising from any use of this document, or its contents, or otherwise arising in connection with this document. This document does not constitute or form part of any offer or invitation to sell, or any solicitation of any offer to purchase any shares in the Company, nor shall it or any part of it or the fact of its distribution form the basis of, or be relied on in connection with, any contract or commitment or investment decisions relating thereto, nor does it constitute a recommendation regarding the shares of the Company. Certain statements in this presentation are forward looking statements. By their nature, forward looking statements involve a number of risks, uncertainties or assumptions that could cause actual results or events to differ materially from those expressed or implied by the forward looking statements. These risks, uncertainties or assumptions could adversely affect the outcome and financial effects of the plans and events described herein. Forward looking statements contained in this presentation regarding past trends or activities should not be taken as representation that such trends or activities will continue in the future. You should not place undue reliance on forward looking statements, which speak only as of the date of this presentation. The Company is under no obligation to update or keep current the information contained in this presentation, including any forward looking statements, or to correct any inaccuracies which may become apparent and any opinions expressed in it are subject to change without notice. 10
You can also read