Farm Value Trends How High Could Prices Go? - Paul Pittman, Chief Executive Officer
←
→
Page content transcription
If your browser does not render page correctly, please read the page content below
Farm Value Trends
                        How High Could Prices Go?

                   Paul Pittman, Chief Executive Officer
                          Farmland Partners Inc.

January 2021
Des Moines, Iowa
Land Value Trends
Disclaimer

      Forward Looking Statements

      Farmland Partners Inc. (the “Company”) is an internally managed real estate company that owns and seeks to acquire
      high-quality North American farmland and makes loans to farmers secured by farm real estate. As of the date of this
      release, the Company owns approximately 154,500 acres in 16 states, including Alabama, Arkansas, California, Colorado,
      Florida, Georgia, Illinois, Kansas, Louisiana, Michigan, Mississippi, Nebraska, North Carolina, South Carolina, South Dakota,
      and Virginia. We have approximately 26 crop types and over 100 tenants. The Company elected to be taxed as a real
      estate investment trust, or REIT, for U.S. federal income tax purposes, commencing with the taxable year ended December
      31, 2014.

      This presentation includes "forward-looking statements" within the meaning of the federal securities laws, including,
      without limitation, statements with respect to the return of farmland values, crop prices and crop yields. Forward-looking
      statements generally can be identified by the use of forward-looking terminology such as "may," "should," "could,"
      "would," "predicts," "potential," "continue," "expects," "anticipates," "future," "intends," "plans," "believes," "estimates"
      or similar expressions or their negatives, as well as statements in future tense. Although the Company believes that the
      expectations reflected in such forward-looking statements are based upon reasonable assumptions, beliefs and
      expectations, such forward-looking statements are not predictions of future events or guarantees of future performance.
      Any forward-looking information presented herein is made only as of the date of this presentation, and the Company does
      not undertake any obligation to update or revise any forward-looking information to reflect changes in assumptions, the
      occurrence of unanticipated events, or otherwise.

  2
Land Value Trends
Introduction
Des Moines, Iowa January 12th, 2021
Paul Pittman
Chief Executive Officer
30 years experience as an
investment banker, farmland
investor and operator
Select Career Highlights Prior to FPI
Began investing in farmland in the mid-90s
Built a privately held portfolio of over 30 farms, comprising over 7,000 acres (approximately $100 million)
o Most of these properties formed FPI’s initial IPO portfolio
Served as Chief Executive Officer since the initial public offering in April 2014
Contact: paul@farmlandpartners.com
3Land Value Trends
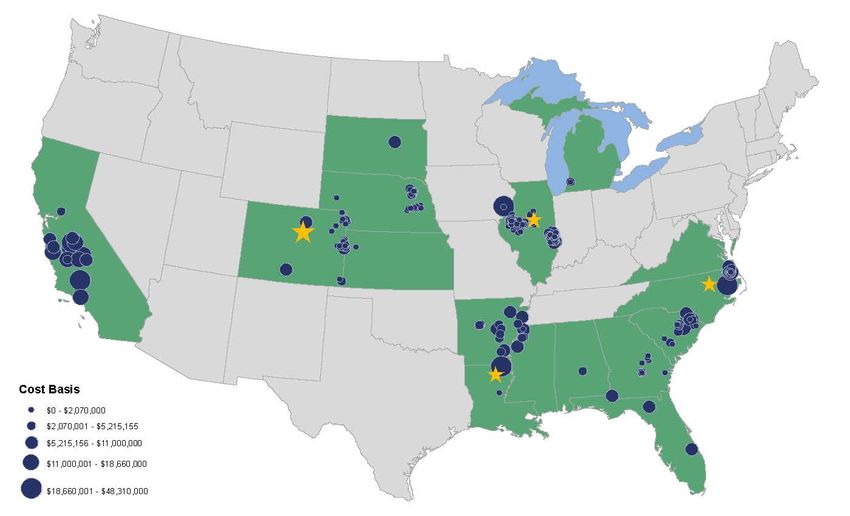
About Farmland Partners
Farmland Partners Inc. is an internally managed, publicly traded (NYSE: FPI) real estate
company that owns and seeks to acquire high-quality farmland throughout North America
Largest Publicly Traded Farmland REIT in US
o Over 150,000 acres between 340 farms across 16 states, over 100 tenants
o Approximately $1.1B in assets
o Annual revenues of approximately $50M
Stars indicate FPI offices
Circles indicate FPI farms and cost basis
4Land Value Trends
Land Values are Likely to Increase Substantially
If trends continue, the best farmland in Illinois and Iowa will return to $12,000 per acre or
more, exceeding values seen in 2013
Reasons: Risks:
Increasing Commodity Prices Value of US Dollar, Change in Supply
and Demand
Increase in Trendline Yield
Increase in Farm Operator Productivity
Reduction & Stabilization of Input Costs Potential Government Regulation
Low Interest Rates Higher Interest Rates
5Land Value Trends
Commodity Prices
Year-end commodity prices are returning to 2013 levels
Year End Commodity Prices 2007 - 2020
$16
$13.12
$14
$12.97
$12
$10
$8 $6.41
$6.05
$6
$4
$4.22 $4.84
$2
$0
2007 2008 2009 2010 2011 2012 2013 2014 2015 2016 2017 2018 2019 2020
Corn Soybean Wheat
Source: “The Long Term Perspective on Markets.” Macrotrends, www.macrotrends.net/.
6Land Value Trends
China’s Imports of Key Grains
China’s Grain Imports (1000 MT)
100,000
100,000
China’s soybean imports have increased 42% since 2013
90,000
China’s corn imports have increased 404% since 2013
80,000
70,000
70,364
60,000
50,000
40,000
30,000
16,500
20,000
10,000 3,277
-
2007 2008 2009 2010 2011 2012 2013 2014 2015 2016 2017 2018 2019 2020
Soybean Imports Corn Imports
Sources:
1) Thukral, Naveen, and Hallie Gu. “Exclusive: China Eyes More Corn Imports as Shipments Surge, Set to Become Top Buyer.” Reuters, Thomson
Reuters, 23 Oct. 2020, www.reuters.com/article/us-china-corn-imports-excusive-idUSKBN2780W8.
2) “China Soybean Oilseed Imports by Year.” China Soybean Oilseed Imports by Year (1000 MT),
www.indexmundi.com/agriculture/?country=cn&commodity=soybean-oilseed&graph=imports.
7Land Value Trends
Soybean Trendline Yield
Soybeans Trendline Yield (bushels/acre)
52
2013-2021 CAGR = 1.16%
50
50.0
48
46
45.6
44
42
40
38
2007 2008 2009 2010 2011 2012 2013 2014 2015 2016 2017 2018 2019 2020 2021
Source: United States Department of Agriculture (2021 is FPI estimate)
8Land Value Trends
Corn Trendline Yield
Corn Trendline Yield (bushels/acre)
190
2013-2021 CAGR = 1.29%
180
179.3
170
160
161.8
150
140
130
120
2007 2008 2009 2010 2011 2012 2013 2014 2015 2016 2017 2018 2019 2020 2021
Source: United States Department of Agriculture (2021 is FPI estimate)
9Land Value Trends
Reduction and Stabilization of Input Costs
Farm operator cost structure and efficiency on a per bushel basis have historically always
been improving, and that trend is likely to continue
Variable Rate Technology (VRT)
o Variable Rate Fertilization
o Variable Rate Seeding
Water Use Efficiency Tools
Speed of Field Operations, Especially Planting and Spraying
Data Collection and Enhanced Visualization Tools
Remote Sensing, Aerial Imaging, Better and Faster Scouting
10Land Value Trends
10-Year Treasury Yield
10 Year Treasury Yield
5.0%
4.5%
4.0%
3.5%
3.0%
2.5%
2.0%
1.5%
1.0%
0.5%
0.0%
2007 2008 2009 2010 2011 2012 2013 2014 2015 2016 2017 2018 2019 2020 2021
Source: “10 Year Treasury Rate - 54 Year Historical Chart.” MacroTrends, www.macrotrends.net/2016/10-year-treasury-bond-rate-yield-chart.
11Land Value Trends
Effect of Trendline Yield Increase on Land Values
Corn
The US corn trendline yield has increased from 161 bushels/ac in 2013 to 179 bushels/ac in 2021
Increase in Yield × Price of Bushel = Extra Revenue/acre ÷ Cap Rate = Value of Extra Revenue/acre
18 bu/ac × $4.60 = $82.8 ÷ 3.5% = $2,366/ac
Soybeans
The US soybean trendline yield has increased from 46 bushels/ac in 2013 to 50 bushels/ac in 2021
Increase in Yield × Price of Bushel = Extra Revenue/acre ÷ Cap Rate = Value of Extra Revenue/acre
4 bu/ac × $12.50 = $50.0 ÷ 3.5% = $1,429/ac
Food for thought: Shouldn’t Illinois and Iowa top quality land prices be $1,500 - $2,000 per
acre higher than 2013 levels?
Corn and Soybean prices are estimates of local cash prices that could be achieved by fall of 2021.
12Thank You Contact: paul@farmlandpartners.com
You can also read


