Manawatū District Quarterly Economic Update - June 2020 - 17 September 2020
←
→
Page content transcription
If your browser does not render page correctly, please read the page content below

Manawatū District Quarterly Economic Update – June 2020
17 September 2020

Key points
• Manawatū‐Whanganui tops the regional economic scorecard in Q2;
• It’s all relative ‐ June quarter GDP declines by 9.0% relative to 12.6%
  for New Zealand. Local annual GDP ↓0.5% rela ve to 2.1% for NZ;
• Favourable trade conditions and sustained global demand (mostly)
  have provided crucial support to the local and domestic economy;
• Fiscal and monetary policy measures have further supported economic
  performance (+$150b);
• Policy response is necessary but there are consequences;
• Local economic indicators reflect relative strength of the local and
  regional economy. There are impacts;
The Region tops the ASB quarterly regional economic scoreboard

“…the region’s agri‐based economy means the region is more resilient than most [due to] less
dependence on international tourism… a solid labour market, a healthy construction pipeline, house
prices that are holding steady and employment figures that are up more than any other region when
compared with this time last year...”
Scoop Regional, Monday 14 September 2020

It’s all relative ‐ GDP contracts as expected in Q2
Worst affected      Q2 % change
Queenstown‐            ↓ 26.4%
Lakes District
Mackenzie              ↓ 20.3%
District
Kaikoura District      ↓ 15.4%
Marlborough            ↓ 14.9%
District
Rotorua District       ↓ 14.5%
Wellington City        ↓ 14.4%
Tauranga City          ↓ 13.9%
Hamilton City          ↓ 13.9%
Dunedin City           ↓ 13.7%
Nelson City            ↓ 13.5%
Our industry structure supports annual GDP
2020 quarter vs same
quarter the previous Annual GDP %
year change
Mar Jun YE Jun 2020
Ruapehu District ‐1.2% ‐8.2% ‐2.1%
Whanganui District 2.4% ‐7.6% ‐1.0%
Rangitikei District ‐3.6% ‐7.4% ‐0.6%
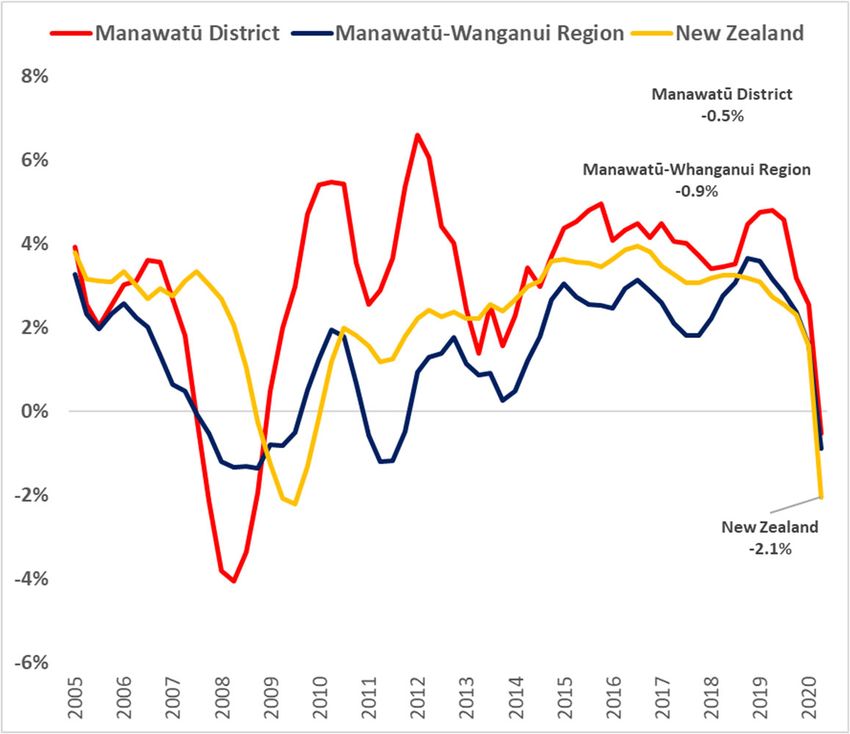
Manawatū District 1.9% ‐9.0% ‐0.5%
Palmerston North
City ‐1.6% ‐8.4% ‐1.3%
Tararua District 2.3% ‐4.5% 0.9%
Horowhenua
District 1.1% ‐11.0% ‐0.4%
Manawatū Region ‐0.8% ‐8.5% ‐8.5%
Manawatū‐
Whanganui Region ‐0.1% ‐8.2% ‐0.9%
New Zealand ‐0.1% ‐12.6% ‐2.1%
Regional data indicates divergent fortunes
                     2020 quarter vs same quarter the previous year   Annual GDP % change
                              Mar                        Jun              YE Jun 2020
Northland                    ‐1.3%                     ‐10.8%                ‐1.9%
Auckland                     ‐1.0%                     ‐13.4%                ‐2.7%
Waikato                      ‐0.8%                     ‐11.8%                ‐1.4%
Bay of Plenty                 0.6%                     ‐13.0%                ‐1.6%
Gisborne                      0.8%                      ‐8.3%                0.2%
Hawke’s Bay                   0.4%                      ‐9.1%                ‐0.9%
Taranaki                      1.8%                     ‐11.9%                ‐1.6%
Manawatū‐Whanganui            0.0%                      ‐8.2%                ‐0.9%
Wellington                    1.2%                     ‐12.9%                ‐1.5%
West Coast                    2.5%                     ‐12.7%                ‐1.8%
Canterbury                    0.6%                     ‐12.3%                ‐2.3%
Otago                         0.1%                     ‐15.6%                ‐2.3%
Southland                     0.6%                     ‐12.6%                ‐2.1%
Tasman                       ‐1.2%                     ‐11.4%                ‐1.2%
Marlborough                  ‐1.1%                     ‐14.9%                ‐2.0%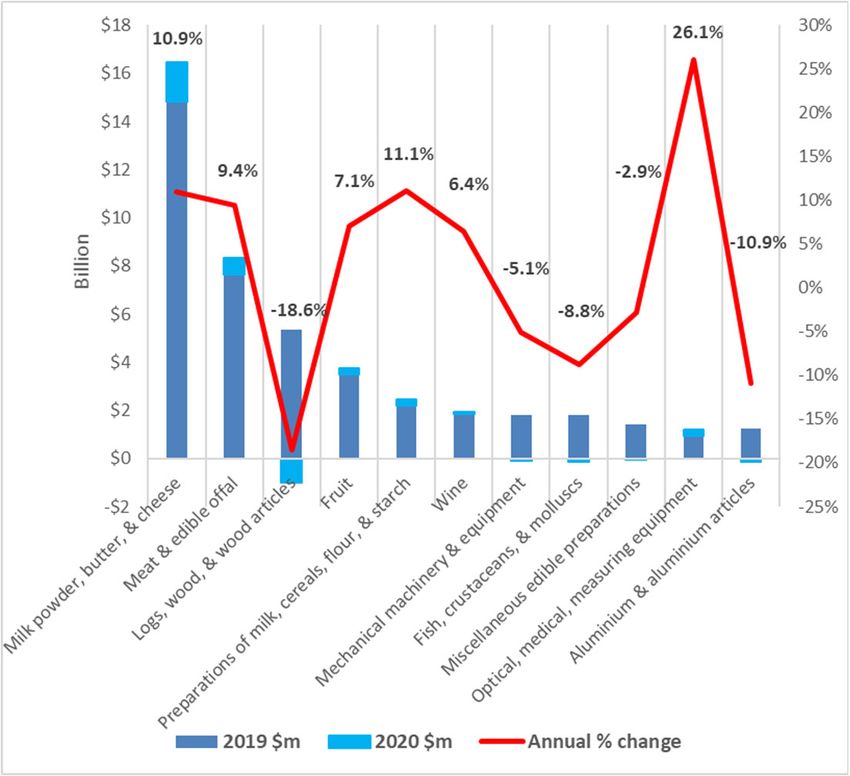
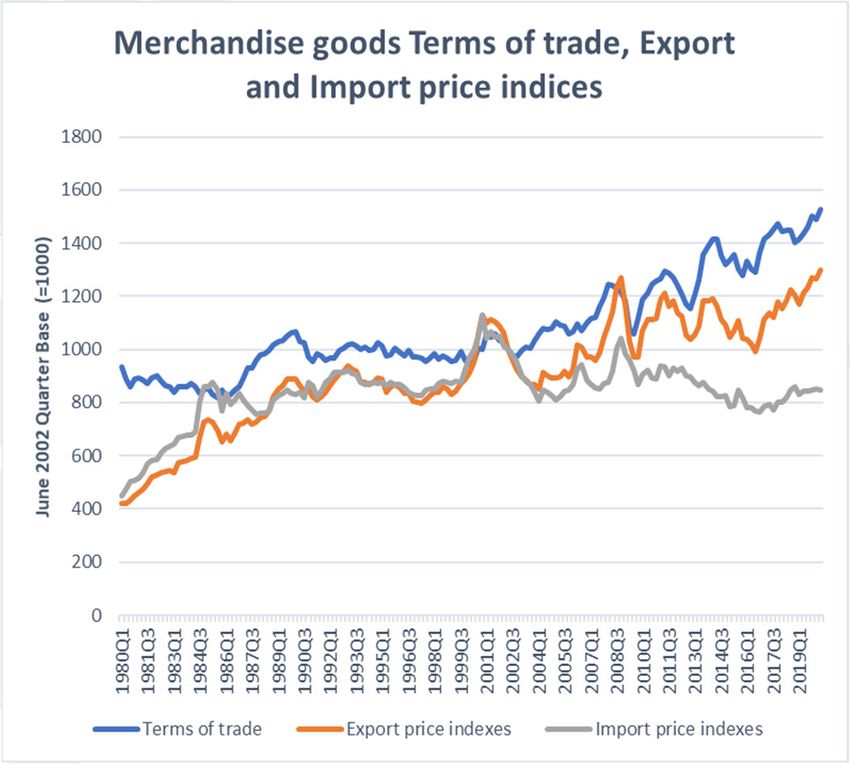
Trade conditions provide substantial support to the New Zealand economy
Export conditions favour local producers
•   The value of exports to the year ended July increased
    by 2.3% to a total of $60.2b;

•   Dairy and red meat exports continue to outperform
    increasing in value by 10.9% and 9.4% respectively;

•   Annual figures show a substantial decline in the value
    of log, wood & wood article exports. July month
    exports values are up 9.6% from the month of July
    2019 indicating early recovery in the sector;

•   Strong growth in exports to China continues with the
    value of exports rising by 6.8% year on year;

•   Exports to Australia, Korea and UK softened over the
    year to July 2020;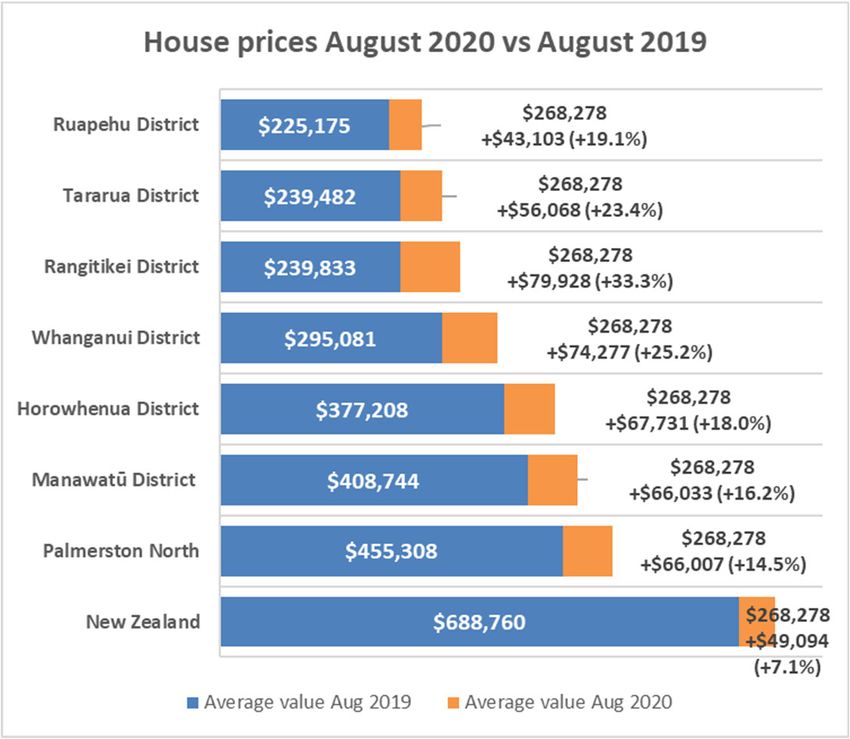
Export conditions favour local dairy producers

Export conditions favour local meat producers
Fiscal & monetary stimulus supports economic performance

• COVID‐19 Response and Recovery Fund (CRRF) ‐ $50b;

• Monetary policy – $100b Large Scale Asset Purchases Programme with
  the aim to inject money into the economy to lower borrowing costs to
  households and businesses;

• Necessary but there are implications: Asset price inflation and debt.
  Government response will span many years?
Local economic performance: The Labour Market
• The District unemployment rate remains beneath the
                                                                              Manawatū‐Whanganui Region
  NZ unemployment rate (2.9% vs 4.0);
                                                           Change in the Labour Force – Jun 2020 vs Mar 2020
• Vs the March quarter, regional job numbers ↓ 862 vs
  March (↓ 435 females; ↓ 427 males). Those aged 20‐
                                                            Working age population = 200,100 (↑ 800)
  24 were most affected ↓ 383 jobs over the quarter.
• In contrast, there were 1,254 more jobs across the           Workforce = 135,900                LFPR =    Not in
                                                                                                           Workforce =
  region in June 2020 vs June 2019;                                 (↓700)                        67.9%
                                                                                                           64,200 (↑
                                                                                                 (↓0.6%)     1,500)
• The data indicates a contraction in the number of jobs
  in the region since the beginning of lockdown
                                                           Employment           Unemployment
  alongside the strong economic growth and job             rate = 64.8%         rate = 4.6% (↑
  creation of 2019 and Q1 2020;                              (↓ 1.0%)                0.6%)

• Labour force changes are an important indicator and
  will continue to be monitored in detail.                 Underutilisation
                                                           rate = 12.1% (↑
                                                                0.2%)
Local economic performance : Income relief & Job ads • Total jobseekers and recipients of COVID Income Relief Payment ↑ 38 (from June) to 998 in August 2020; • Workready jobseekers ↓ 6, Jobseekers (health condi on) ↑ 13 and CIRP recipients ↑ 31; • To YE Aug, combined income payments increased by 318. This is ↑46.8% on August 2019 compared with ↑ 57.5% in NZ. • Job ads indicate strong local recruitment inten ons ↑15% on Feb 2020 vs NZ ↓ 23%.
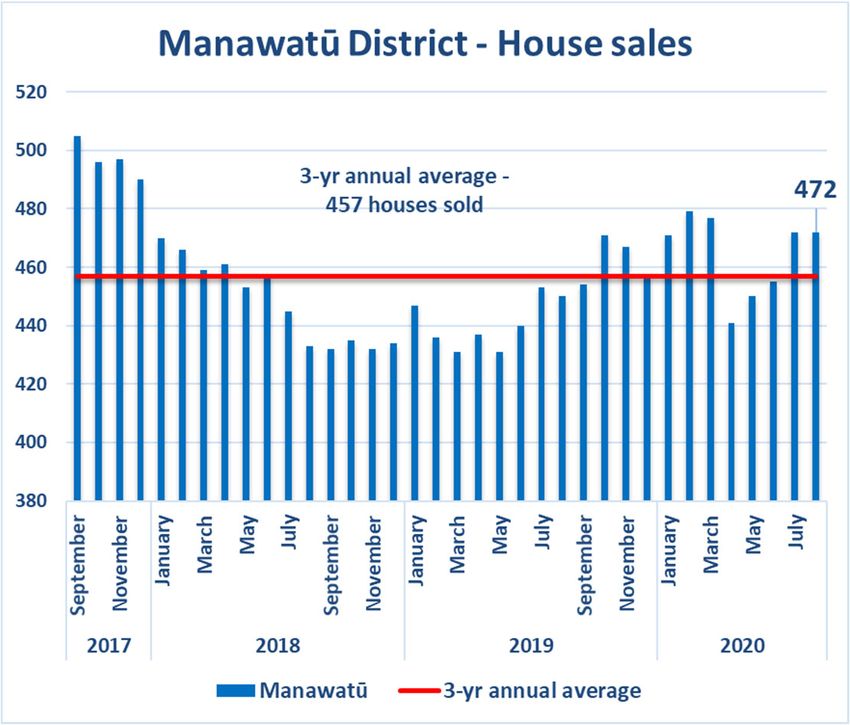
The housing market continues to perform strongly
Social impacts of supply constraints & housing price growth
New dwellings and construction Investment holds up
Local spending over the July Qtr ↑ 7.2% vs ↑ 0.3% increase across NZ
District retail spending ↑ 11.2% in July 2020 vs ↑ 8.3% across NZ
IS COVID‐19 undermining assumptions? Tourism expenditure
 • A $7.0m upward revision to June 2019 estimates has resulted in an
   estimated 18.9% reduction in tourist spending to the year ended June
   2020. The upward revision includes an estimated 81.7% increase in
   international tourist expenditure over the year to June 2019;

 • The 18.9% estimated reduction in local tourism expenditure to the
   year ended June 2020 exceeds the estimated contraction of tourist
   hotspots such as Queenstown‐Lakes District;

 • Data for July continues to reflect similar declines – Manawatū District
   ↓ 20.9% vs Queenstown‐Lakes ↓16.4% and NZ ↓ 13.0%
Conclusion
• Our industry and economic strengths are supporting local
   economic performance relative to most of NZ;

• Strength in agri‐food production and government employment, a healthy pipeline of construction activity,
  relatively affordable house prices, alongside limited exposure to international tourism adds to our resilience;

• Favourable export and supply conditions are crucial, and remain supportive of local economic activity;

• Indicators show greater recovery of consumer spending relative to NZ. House prices and levels of private
  planned investment remain strong.

• Cost pressures in the housing market increase rental prices and place extra pressure on vulnerable families;

• Fiscal and monetary policy will support near term economic activity, keep interest rates low and limit exposure
  to offshore financial volatility. While necessary, these policies will unavoidably have consequences for both
  current and future generations.
You can also read


