Unilever H1 2019 Results Alan Jope & Graeme Pitkethly - 25th July 2019
←
→
Page content transcription
If your browser does not render page correctly, please read the page content below

Unilever H1 2019 Results
Alan Jope & Graeme Pitkethly
        25th July 2019
SAFE HARBOUR STATEMENT
This announcement may contain forward-looking statements, including ‘forward-looking statements’ within the meaning of the United States Private
Securities Litigation Reform Act of 1995. Words such as ‘will’, ‘aim’, ‘expects’, ‘anticipates’, ‘intends’, ‘looks’, ‘believes’, ‘vision’, or the negative
of these terms and other similar expressions of future performance or results, and their negatives, are intended to identify such forward-looking
statements. These forward-looking statements are based upon current expectations and assumptions regarding anticipated developments and
other factors affecting the Unilever Group (the ‘Group’). They are not historical facts, nor are they guarantees of future performance.

Because these forward-looking statements involve risks and uncertainties, there are important factors that could cause actual results to differ
materially from those expressed or implied by these forward-looking statements. Among other risks and uncertainties, the material or principal
factors which could cause actual results to differ materially are: Unilever’s global brands not meeting consumer preferences; Unilever’s ability
to innovate and remain competitive; Unilever’s investment choices in its portfolio management; inability to find sustainable solutions to support
long-term growth including to plastic packaging; the effect of climate change on Unilever’s business; significant changes or deterioration in
customer relationships; the recruitment and retention of talented employees; disruptions in our supply chain and distribution; increases or
volatility in the cost of raw materials and commodities; the production of safe and high quality products; secure and reliable IT infrastructure;
execution of acquisitions, divestitures and business transformation projects; economic, social and political risks and natural disasters; financial
risks; failure to meet high and ethical standards; and managing regulatory, tax and legal matters.

These forward-looking statements speak only as of the date of this announcement. Except as required by any applicable law or regulation, the Group
expressly disclaims any obligation or undertaking to release publicly any updates or revisions to any forward-looking statements contained herein
to reflect any change in the Group’s expectations with regard thereto or any change in events, conditions or circumstances on which any such
statement is based.

Further details of potential risks and uncertainties affecting the Group are described in the Group’s filings with the London Stock Exchange,
Euronext Amsterdam and the US Securities and Exchange Commission, including in the Annual Report on Form 20-F 2018 and the Unilever
Annual Report and Accounts 2018.

Alan Jope

H1 2019: Sustained progress in growth and margin

       Growth                      Margin                     Earnings                Cash
 Underlying Sales Growth   Underlying Operating Margin       Underlying EPS        Free Cash Flow

       +3.3%                     +50 bps                       +5.0%               €1.5bn

       +1.2%                     +30 bps                       +3.0%               €(0.5)bn

Underlying Volume Growth         Gross Margin            Constant Underlying EPS       vs 2018
Sustained growth momentum

                                                                                                           Asia/AMET/   Brazil
                                                                                                           RUB          truckers

                                                                                                           Argentina    Difficult
                                                                                                                        weather
                                                                                                                        comparator

Underlying Sales Growth exc. Venezuelan price from Q417 onwards, and Argentinian price from Q318 onwards
Improving momentum in emerging markets

                                                                                                           India
                                                                                        5.6% exc.
                                                                                         truckers
                                                                                                                   India   Brazil

                                                                                                                   China   Indonesia

Underlying Sales Growth exc. Venezuelan price from Q417 onwards, and Argentinian price from Q318 onwards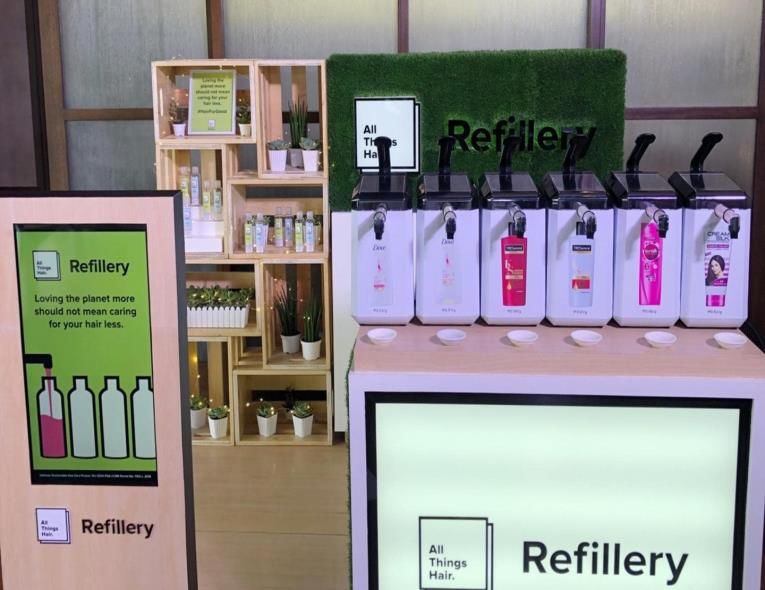
Uncertain markets

     Market affected by weather       Diverging economic outlooks                          Benign currency

  Europe value market growth (%)   GDP
                                    5%                        EMs
                                                                                                                         IDR
                                                                                                                         BRL
                                    4%                                    100                                            IND
                                                                                                                         EUR
                                                 USA
          2.0%                      3%

                       (0.5%)       2%
                                                                                                                         TRY

                                    1%
                                                                          70

          MAT         L12 wks       0%
                                                 ‘19   ‘20    ‘19   ‘20         July ‘18                           July ‘19

Source: Nielsen                    Source: Oxford Economics               Source: NASDAQ, rebased to 100, vs USD
Beauty & Personal Care

         H1 2019
USG       3.3%

                                             Naturals
UPG       1.6%

UVG
          1.7%
                          Emerging markets

UOM      +100bps
Home Care

        H1 2019
USG      7.4%

                                 Enhancing the core
UPG      4.5%

UVG      2.8%
                  Less plastic

UOM     +120bps
Foods & Refreshment

         H1 2019
USG       1.3%
                                      Sustainable
                                       packaging
UPG
          1.4%

UVG       (0.1)%       Acquisitions
UOM      (40)bps
Purpose-led campaigns Beauty & Personal Care Home Care Foods & Refreshment All Things Hair Refillery Indonesia Mosque Cleaning Ben & Jerry’s Justice ReMix’d
Data driven marketing delivering

• 24 Digital Hubs

• 600+ DDM campaigns

• 1.5bn consumer connections
                               Axe Martin Garrix   Indonesia food festival
Graeme Pitkethly
Asia / AMET / RUB

   H1 Turnover
    €12.2m

   H1 USG 6.2%
   H1 UVG 2.9%
Latin America
H1 Turnover
€3.5bn
1.6% exc.
truckers
H1 USG 4.9%
H1 UVG 0.5%
Underlying Sales Growth exc. Venezuelan price from Q417 onwards, and Argentinian price from Q318 onwardsArgentina hyperinflation
Price impact 35bps 70bps 140bps 80bps 80bps
Total UL
USG Argentina 10.0% (10.3)% (21.6)% (11.0)% (7.4)%
75.5%
78.1%
64.0%
UPG 34.2%
17.4%
UVG
(10.3)% (11.0)%
(6.3)% (21.6)% (7.4%)
Q2’18 Q3’18 Q4’18 Q1’19 Q2’19North America
H1 Turnover
€4.6bn
H1 USG 0.1%
H1 UVG (0.5)%Europe
H1 Turnover
€5.8bn
H1 USG (0.6)%
H1 UVG (0.2)%H1 2019: Turnover
USG 3.3%
2.1%
1.2%
(5.5)% 0.5% 1.1%
€26.4bn €26.1bnH1 2019: Underlying operating margin
+ 30 bps (10) bps
+ 30 bps
+50bps
18.8% 19.3%H1 2019: Underlying earnings per share
2.0%
(0.4)% (1.0)%
0.3%
5.2% (5.4)%
4.3%
(5.4%) 5.2%
Underlying EPS +5.0%
€1.21 €1.27Cash flow & balance sheet
Free cash flow Net debt Pension deficit
Free cash flow Net debt/EBITDA
€1.5bn 2.1x
€0.9bn
€(0.5)bn €24.2bn €0.5bn
vs 2018 Net debt FY 2018 H1 20192019 outlook
❑ Underlying Sales Growth in lower half of multi-year 3-5% range
❑ Underlying Operating Margin: continued progress to 20%
❑ Strong cash flowUnilever H1 2019 Results
Alan Jope & Graeme Pitkethly
25th July 2019You can also read