Q3 F2019 Earnings Call - March 14, 2019 - Empire Company Limited
←
→
Page content transcription
If your browser does not render page correctly, please read the page content below
Q3 F2019
Earnings Call
March 14, 2019
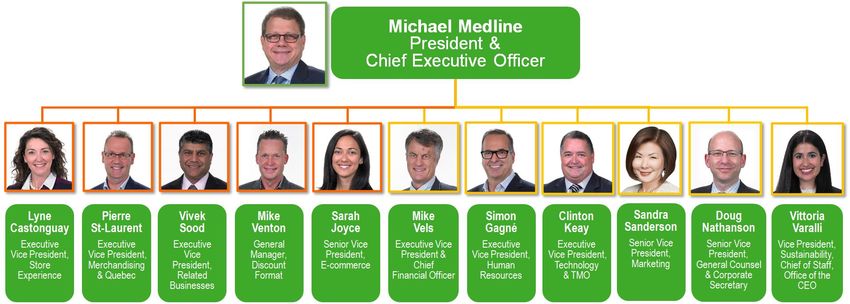
Executive Team

                 2
Third Quarter Highlights

•   Same-store sales excluding fuel increased 3.3%; strongest in almost 10 years

•   Same-store sales excluding fuel and pharmacy increased 3.9%

•   Third consecutive quarter of tonnage growth

•   Earnings per share of $0.24 compared to $0.21 last year
•   Adjusted earnings per share of $0.27 (including $0.12 of labour buyout and store closure
    costs) compared to $0.33 last year – see slide 5 for further detail
•   Effective income tax rate of 22.1%, lower due to higher capital gains on property
    dispositions and a decrease in tax liabilities related to unrecognized tax benefits

•   Project Sunrise transformation on track

•   12 FreshCo locations confirmed to open in British Columbia and Manitoba in calendar 2019
•   Empire's results for the third quarter ended February 2, 2019 include 8 weeks of Farm Boy's
    operations. All metrics, including SSS, include the consolidation of Farm Boy operations.

                                                                                               3
Third Quarter Financial Summary
Quarter 3
Actual¹ LY
Sales $6,247.3 $6,029.2
Same-store sales, excluding fuel 3.3% 1.1%
Same-store sales, excluding fuel and pharmacy 3.9% 1.4%
Gross Profit $1,511.7 $1,444.7
Gross margin 24.2% 24.0%
Selling and Administrative Costs (excluding adjustments²) $1,439.4 $1,341.7
Selling and Administrative margin 23.0% 22.3%
Adjusted Operating Income $119.8 $152.0
Adjusted Operating Income as a % of sales 1.9% 2.5%
Adjusted EBITDA $218.3 $253.3
Adjusted EBITDA margin 3.5% 4.2%
Adjusted Net Earnings $72.9 $89.9
Adjusted Earnings per Share $0.27 $0.33
Free Cash Flow $183.6 $269.4
Funded Debt to Total Capital 34.4% 32.7%
¹ Q3 F19 results include $45 million in costs related to the B.C. labour buyouts and FreshCo conversion store closures which impacted selling and administrative costs.
See Slide 5 for further details.
² Adjustments were made for intangible amortization associated with the Canada Safeway acquisition, business acquisition costs and costs related to Project Sunrise in
the prior year. Please see Empire Company Limited’s News Release for the third quarter ended February 2, 2019 for additional information.
4British Columbia Labour Decision
OVERVIEW
LABOUR BUYOUTS
On January 29, 2019, the Company announced progress implementing a labour decision provided by a Special Officer appointed by the Government
in British Columbia.
• The labour decision set terms that allow the Company to offer voluntary buyouts to eligible B.C. Safeway employees.
• Employee buyouts provide flexibility and stability for the Company to better manage labour and operational costs in B.C.
• The Company estimates the cost of the labour buyout will be approximately $35 million before tax ($0.09 per share, after tax).
FRESHCO CONVERSION COSTS
The labour decision also enabled the Company to move forward with its discount expansion strategy in B.C., which is to convert a portion of its full
service format stores to its discount format, FreshCo.
• Management confirmed five stores that closed in July 2018 will be converted to the FreshCo discount format.
• Management announced that the Company will close a further five stores which will be converted to FreshCo.
The costs of these additional store closures are estimated to be approximately $10 million before tax ($0.03 per share, after tax).
• 12 FreshCo locations confirmed to open in B.C. and Manitoba in calendar 2019, depending on timing of construction schedules and permits
The first Western Canada FreshCo stores are expected to open in the next few months – five in B.C. and two in Manitoba.
IMPACT
The estimated cost of the labour buyout and store closure costs is $45 million which increased selling and administrative expenses in the third quarter.
If this amount was not included in the Company’s third quarter results:
• Adjusted Selling and Administrative expenses as a percent of sales would have been 22.3%
• Adjusted Operating Income would have increased 8.4%
• Adjusted EBITDA margin would have been 4.2%
• Adjusted EPS would have been $0.39
5IFRS 16 Update
IFRS 16
OVERVIEW
• IFRS 16 intends to align the presentation of leased assets more closely to owned assets
• Impact of the standard will be reflected in our financial statements for first quarter of 2020 (from May 5, 2019)
• This standard will not impact Empire's strategy, business operations, or cash flow generation
• The Company expects the adoption of IFRS 16 will have a material impact on its balance sheet classifications
• The Company expects the adoption of IFRS 16 will not have a material impact on fiscal 2020 EPS
BALANCE SHEET
Assets • $3.6 - $3.9 billion increase in assets
• Mainly long term
Liabilities • $4.2 - $4.5 billion inclusion of new lease liabilities
• The Company continues to finalize and validate the key estimates and inputs into the calculations
• The actual discount rate applied will be based on Empire's transition date of May 5, 2019 and changes may affect estimates significantly
STATEMENT OF EARNINGS
Expenses • Are higher under IFRS 16 when leases are early in the term as finance expense is recognized on an amortized
cost basis and depreciation expense is recognized straight-line over the lease term
• Current rent expense will be replaced by depreciation on the right of use assets and interest expense on the new
lease liabilities
EBITDA • This will have a significant impact on the calculation of EBITDA
Fiscal 2020 EPS • Based on current estimates and available information, the Company does not expect application of IFRS 16 to
have a material impact on EPS
6Disclaimers
Forward-Looking Information
This document contains forward-looking statements which are presented for the purpose of assisting the reader to contextualize the Empire
Company Limited’s (“Empire” or the “Company”) financial position and understand management’s expectations regarding the Company’s
strategic priorities, objectives and plans. These forward-looking statements may not be appropriate for other purposes. Forward-looking
statements are identified by words or phrases such as “estimates”, “plans”, “predicts”, “anticipates” and other similar expressions or the
negative of these terms.
These forward-looking statements include, but are not limited to, the following items:
The Company’s expectations regarding the impact of Project Sunrise, including expected cost savings and efficiencies resulting from this
transformation initiative, and the expected timing of the realization of overall and fiscal 2019 in-year incremental benefits, which could be
impacted by several factors, including the time required by the Company to complete the project as well as the factors identified under the
heading “Risk Management” in the fiscal 2018 annual Management’s Discussion & Analysis (“MD&A”);
The FreshCo expansion in Western Canada, including the Company’s expectations regarding future operating results and profitability, the
amount and timing of expenses, and the number, location, feasibility and timing of conversions, all of which may be impacted by
construction schedules and permits, the economic environment and labour relations;
The Company’s expectations regarding its operations in Western Canada, including future operating results and profitability, flexibility,
growth plans, brand expansions and labour relations, which could be impacted by several factors, including the factors identified under the
heading “Risk Management” in the fiscal 2018 annual MD&A; and
The timing and amount of expenses relating to voluntary buyouts, which may be impacted by employee participation and labour relations.
By its nature, forward-looking information requires the Company to make assumptions and is subject to inherent risks, uncertainties and other
factors which may cause actual results to differ materially from forward-looking statements made. For more information on risks, uncertainties
and assumptions that may impact the Company’s forward-looking statements, please refer to the Company’s materials filed with the Canadian
securities regulatory authorities, including the “Risk Management” section of Empire’s fiscal 2018 annual MD&A.
Non-GAAP Financial Measures & Financial Metrics
There are measures and metrics included in this earnings call presentation, such as adjusted EBITDA, adjusted earnings per share, same-store
sales, free cash flow, funded debt and total capital that do not have a standardized meaning under generally accepted accounting principles
(“GAAP”) and therefore may not be comparable to similarly titled measures and metrics presented by other publicly traded companies. The
Company includes these measures and metrics because it believes certain investors use these measures and metrics as a means of assessing
financial performance.
For a complete description of Empire’s non-GAAP financial measures and financial metrics, please see Empire’s MD&A for the third quarter
ended February 2, 2019. 7You can also read