Q2 2018 Turkish Property Market Overview - Pamir&Soyuer
←
→
Page content transcription
If your browser does not render page correctly, please read the page content below

INVESTMENT   BROKERAGE   ADVISORY   DEVELOPMENT

Property
News
Q2 2018 Turkish Property Market Overview
Property News Q2 2018,
Turkish Property Market Overview

Research                                            Investment
Hüma Kartal                                         Firuz Soyuer
Research Analyst                                    Managing Partner
+90 (212) 231 55 30 ext.120                         +90 (212) 231 55 30 ext.117
kartalh@pamirsoyuer.com.tr                          fs@pamirsoyuer.com.tr

Research Reports are available at pamirsoyuer.com.tr/en/research/

Contents
Economic Overview        3

Istanbul Office Market   5

Turkish Retail Market    7

Definitions              9

                             22
INVESTMENT BROKERAGE ADVISORY DEVELOPMENT
Economic Overview
GDP
During the 1st quarter of 2018, GDP grew by 7.4% compared to the same period in 2017. When
the activities constituting GDP were analysed; the total value added increased by 10% in the
service sector, 8.8% in the industry sector, 6.9% in the construction sector and 4.6% in the
agricultural sector compared with the same quarter last year.
Please note that according to OECD Economic Survey of Turkey 2018 GDP growth is projected to
slow but to stay around 5% in 2018 and 2019.
Figure 1. Turkish Economy: selected indicators
annual growth
18%
16%
14%
12%
10%
8%
6%
4%
2%
0%
-2%
2015Q1
2015Q2
2015Q3
2015Q4
2016Q1
2016Q2
2016Q3
2016Q4
2017Q1
2017Q2
2017Q3
2017Q4
2018Q1
2018Q2
GDP Growth (%) Private CPI (%)
Consumption (%)
Source: TURKSTAT
3
Source: TURKSTATINVESTMENT BROKERAGE ADVISORY DEVELOPMENT
Economic Overview
Inflation
CPI in Turkey during June 2018 increased by 2.61% and 15.39% compared to May 2018 and
previous 12-month period. Leading contributors to CPI on a monthly and annual basis were food
and non-alcoholic beverages and transportation, respectively. Cost of food and non-alcoholic
beverages increased by 5.98% between May and June 2018 and, on an annual basis, cost of
transportation increased by 24.26%.
Policy Rate
CBRT raised the policy rate from 16.5% to 17.75% at monetary policy meeting held on 7 June.
CBRT is expected to continue its tight monetary policy until the inflation is improved.
Figure 2. Policy rate and CPI
19
18
17
16
15
14
13
12
11
10
9
8
7
6
5
4
2013 2014 2015 2016 2017 2018
Policy Rate (%) CPI (%)
Source: TURKSTAT
Building Construction Cost Index, June 2018
Total Labour Material
Monthly Change 2.38% 0.13% 3.41%
Annual Change 24.87% 16.01% 29.23%
House Sales Statistics, April - June 2018
Total House Sales 342,155 houses
First Sales 160,100 houses
Second Hand Sales 182,055 houses 4
Sales to Foreigners 6,646 housesIstanbul Office Market
Demand and Supply
In the 2nd quarter of 2018, cumulative supply of grade A office space in Istanbul increased to 3.59
million sq m. with the new offices started to operate in Asian Side of Istanbul. During the 2nd
quarter 2018, 39,474 sq. m take-up was recorded, comprising 82% of overall transactions
recorded in Istanbul primary office areas. 38% of the transactions were recorded in Levent-Etiler,
%30 in Maslak, %13 in Sisli-Zincirlikuyu-Besiktas, %17 in Kozyatagi and %2 in Umraniye.
The noticeable deals in the 2nd quarter of 2018 were McKinsey’s leasing in Ferko Signature
(2,287 sq. m) and Multinet’s leasing in Suzer Plaza (2,000 sq. m).
Investments
The notable deals recorded in the 2nd quarter of 2018 was the acquisition of 12.000 m² office
space from Maslak 1453 by EPİAS.
Pipeline
Based on the total future office buildings projected to operate in the primary office areas of
Istanbul, 1.38 million sq. m new office development under construction/planned is expected until
2020. 43% of new office space supply will be in Asian side at Istanbul Finance Centre where the
financial regulatory bodies and headquarters of state banks will be located.
Notable take-up activities Figure 3. Istanbul grade A office take-up
2018 Q2 2018
Building Ferko Signature Suzer Plaza
2017
0 20,000 40,000 60,000 80,000 100,000 120,000 140,000
District Levent Sisli
(sq. m) Q1 Q2 Q3 Q4
Tenant McKinsey Multinet Source: Pamir&Soyuer
5
Area 2,287 2,000
(m²)Istanbul Office Market
Vacancy and Rental Level
In the 2nd quarter of 2018, average rents in Istanbul grade A office market continued to
decline due to high inflation, exchange rate volatility and excess supply. Vacancy rate in
Istanbul Grade A Office Spaces rose to 18.2% in total, increasing from 12.9% to 17.1% in Asian
Side with new supply entering the market and decreasing from %20.3 to %18.9 due to new
leases. Vacancy rates occurred 25.2% in Kozyatağı, 9.4% in Umraniye, 19.1% in Levent-Etiler
where the prime rent recorded as 32 $/m2/month, 19.4% in Maslak and 17.9% in Sisli-
Zincirlikuyu-Besiktas.
Figure 4. Istanbul grade A office occupancy, vacancy, prime rent
2500000 (sq. m) (USD/m²/month)
2000000
50
45
1500000
40
35
1000000
30
25
500000
20
15
0
2013 2014 2015 2016 2017 2018 10
A: Asian Side
Occupancy (A) Occupancy (E) Vacancy Prime Rent (A) Prime Rent (E) E: European Side
Source: Pamir&Soyuer
6INVESTMENT BROKERAGE ADVISORY DEVELOPMENT
Turkish Retail Market
Demand
Based on data released by the Turkish Council of Shopping Centers (AYD) and Akademetre
Research, compared to June 2017 the shopping centers sales index increased by 23.3% to 291
points. During the 2nd quarter of 2018, footfall index in June, increased by 10% compared to
same period last year. In June 2018, shopping centers’ sales per leasable area (sq. m.) occurred
as 1,252 TL in Istanbul, 1,015 TL in Anatolia and 1,110 TL in Turkey.
Supply
During the 2nd quarter of 2018, Turkey’s shopping center supply increased to 11.89 million sq. m
with the opening of 4 new shopping centers. GLA/1,000 inhabitants increased to 150.82 sq. m
in Turkey; moreover, Istanbul has the highest rate of GLA/1,000 inhabitants as 311.09 sq. m and
followed by Ankara and Bolu with 294.18 sq. m and 289.16 sq. m per 1,000 inhabitants,
respectively.
Figure 5. Shopping centers turnover and visitor index
290
270
250
230
210
190
170
150
130
110
90
Ju 6
De 15
Ju 5
Ju 7
Ju 8
De 6
M 4
De 7
18
M 6
De 4
Se 5
M 5
Se 6
M 7
Se 14
Se 7
-1
-1
-1
-1
1
1
1
1
1
1
1
1
1
1
p-
p-
c-
p-
n-
c-
p-
n-
c-
n-
c-
n-
n-
ar
ar
ar
ar
Ju
Visitor Index Turnover Index
Source: AYD and Akademetre Research
7INVESTMENT BROKERAGE ADVISORY DEVELOPMENT
Turkish Retail Market
New Supply
In the 2nd quarter of 2018, there were 4 new shopping center openings: Anatolium Marmara
(60,000 m²) and Maltepe Piazza (55,000 m²) in Istanbul, Westpark Outlet Center (65,000 m²) in
Izmir and 39 Burda Shopping Center (28,000 m²) in Kırklareli.
Pipeline and Outlook
Based on forthcoming retail supply, the total retail supply will be around 14 million sq. m by the end
of 2020. Shopping centers which are under construction in Istanbul, Ankara, Bursa will hold
approximately 80% of the total pipeline.
Figure 6. Retail center supply (GLA per 1,000 inhabitants)-Top 20 markets
sq. m/1,000 inhabitants
350
300
250
200
Turkey Average (TR 59)
150
100
50
0
Source: Pamir&Soyuer
Investments, Q2 2018
Asset Purchaser Price
Gebze Center Seyir Gayrimenkul Yatırım €102.5 million
A. Ş
Maltepe Carrefoursa Bakırköy Gayrimenkul ₺835 million
Yatırım A.Ş
8INVESTMENT BROKERAGE ADVISORY DEVELOPMENT
Definitions
Office
Istanbul Primary Office Regions: Pamir & Soyuer office database covers only Grade A office buildings which have total
floor area larger than 3,500 m² and located in the primary off ice areas (Maslak, Levent-Etiler, Şişli – Zincirlikuyu -
Beşiktaş in the European side and Kozyatağı, Ümraniye and Ataşehir in the Asian side).
Net Absorption: The amount occupied at the end of a period minus the amount occupied at the beginning of a period and
takes into consideration space vacated during the period.
New supply: Total level of new office space to be built or under construction, with construction permit.
Prime rent: Expressed in USD/m²/month excluding tax and charges. The prime rent represents the average value in
the first quartile of all deals, and excludes extreme values.
Prime yields: Expressed as a percentage, between rents and the capital value of assets. The prime yield represents the
lowest yield observed in a given period of time, and excludes extreme values.
Vacancy rate: Represents the immediately available supply over the existing office stock.
Retail
Definition and Classification of Retail Centres: Retail centres are defined as purpose built, shopping developments with
over 5,000 m² gross leasable area (GLA) excluding supermarket area, and comprising of 30 or more retail units.
Database covers all operating retail centres. The additional or expanded space is considered as a new retail centre floor
space.
Principal types of retail centres are classified using British Council of Shopping Centre (BCSC) definitions as follows:
Town Centre Malls: are shopping centres located in a town centre or the central business district of a city.
District Shopping Centres: are located outside of the town centre proper but still within the urban area.
Outlet Centres: are defined as centres where the majority of retailers sell branded merchandise at a substantial discount
to the recommended retail price.
Retail Parks: are purpose built centres solely comprised of at least three retail warehouses of not less than 1,000 m²
and have common parking.
Average retail rents: are calculated taking into consideration small to medium-size units’ (MSU) rents, excluding anchor
tenants.
Disclaimer
This report should not be relied upon as a basis for entering into transactions without seeking specific, qualified,
professional advice. Whilst facts have been rigorously checked, Pamir & Soyuer can take no responsibility for any damage
or loss suffered as a result of any inadvertent inaccuracy within this report. Information contained herein should not, in
whole or part, be published, reproduced or referred to without prior approval. Any such reproduction should be credited to
Pamir & Soyuer.
© Pamir & Soyuer September 2018
9Who We Are
Pamir & Soyuer was established in 1993 by Ali Pamir and Firuz Soyuer to provide real estate advisory
services to corporate clients and HNWI.
Mr. Pamir and Mr. Soyuer both started their careers in investment banking and have been active in Turkish
real estate since 1986 primarily through Pamir & Soyuer or related entities. Collectively they have over 50
years of residential and commercial real estate experience, and have transacted over USD 1 billion in real
estate investment sales.
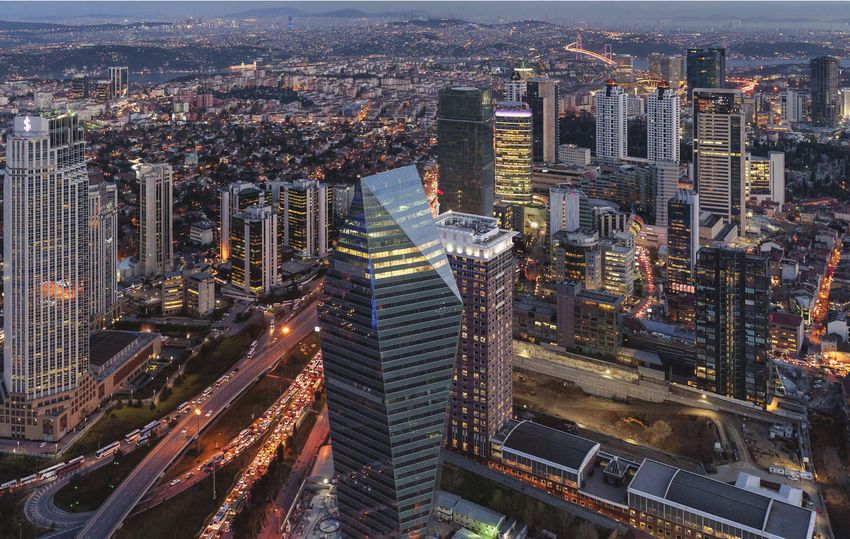
Headquarters of Pamir & Soyuer is located in Istanbul with a liason office in Bodrum.
What We Do
Pamir & Soyuer is active in both residential and commercial real estate, and provides the following services:
• Investment Advisory & Sales
• Development Advisory & Management
• Project Marketing
• Tenant Representation
• Agency/Owner Representation
• Marketing & Feasibility Studies
• Valuation
INVESTMENT BROKERAGE ADVISORY DEVELOPMENT
3$0Ο59(62You can also read