April 2019 Scotiabank CAPP Energy Symposium Trevor Haynes, CEO - Investor Relations
←
→
Page content transcription
If your browser does not render page correctly, please read the page content below
April 2019 Scotiabank CAPP Energy Symposium
4/15/2019
                                       Trevor Haynes,
                                                 1
                                                      CEO
               Investor Relations | investor@blackdiamondgroup.com
Forward Looking Statements

This presentation contains forward-looking statements. The use of the words “anticipate”, “continue”,
“estimate”, “expect”, “will”, “project”, “should”, “believe”, “intend” and similar expressions identify
forward-looking statements. These statements involve known and unknown risks, uncertainties and
other factors that may cause actual results or events to differ materially from those anticipated in such
forward-looking statements. Management believes the expectations reflected in those forward-
looking statements are reasonable but cannot give any assurance these expectations will prove to be
correct. Additional information on risk factors that could affect Black Diamond's operations and
financial results are included in Black Diamond's annual information form for the year ended
December 31, 2018 and other reports on file with the Canadian Securities Regulatory Authorities
which can be accessed on SEDAR. Readers are cautioned not to place undue reliance on these
forward-looking statements. Furthermore, the forward-looking statements contained in this
presentation are made as at the date of this presentation and Black Diamond does not undertake any
obligation to update or revise any of the forward-looking statements, except as may be required by
applicable securities laws.

                                                                                                        2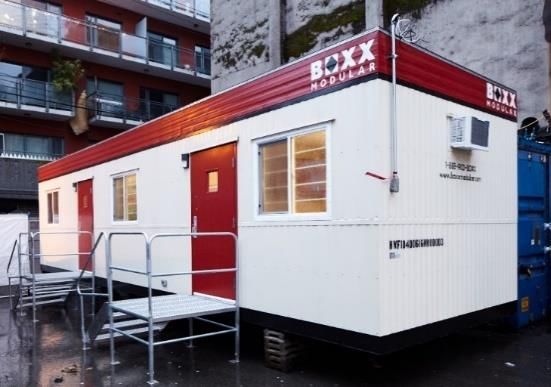
Progress in 2018

• Increased Adjusted EBITDA by           Q4 2018 Geographical Diversification
                                                (% of Total Revenue)
  3% year-over-year
                                                                        US
                                                                       33%
• Approx. 70% of Q4 revenue      Canada - MSS
                                     24%
  generated outside of western
  Canadian energy sector

• Continued diversification                                                     Australia
                                                                                  12%
  geographically and by
  industry segment
                                            Canada - WFS
                                                31%

   4/15/2019                                                                 3      3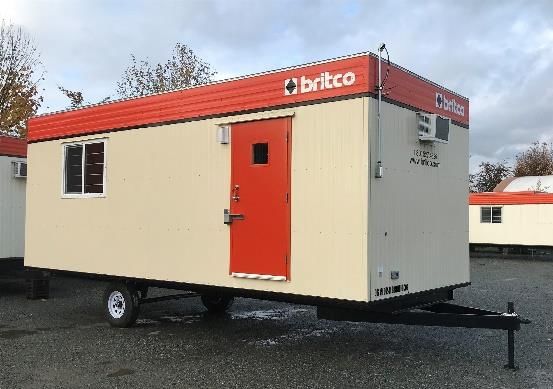
MSS Overview

   Modular Space Solutions
• Investing in and growing MSS
  segment. Majority of $35 mm 2019
  capital budget directed towards
  organic growth in this segment.
• Nearly 6,000 units across 13 branches
  in North America with attractive
  returns on long-lived assets.
• Targeting minimum fleet growth of
  10% per year while maintaining
  existing return metrics. With added
  scale and additional product offering,
  increase in cashflow is expected to
  outpace fleet growth.
• Longer term vision to double MSS
  fleet in 5 years.

                                           4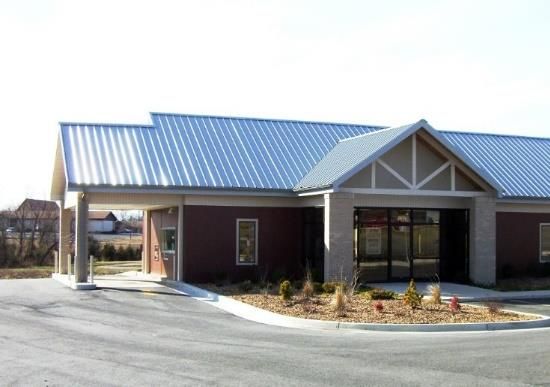
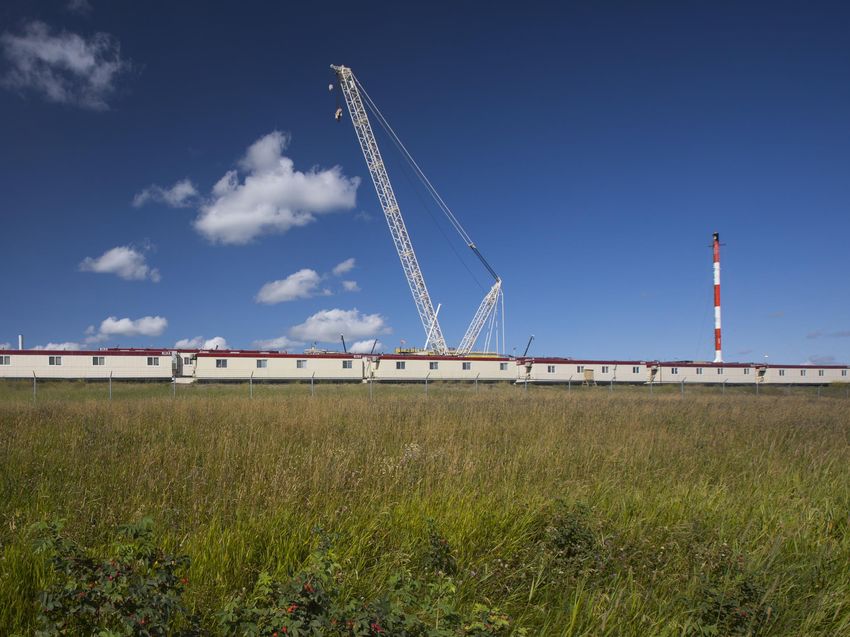
WFS Overview

      Workforce Solutions
• Meaningful operating leverage
  through idle Canadian assets with
  minimal capex required upon re-
  deployment.
• LNG Canada is the most near-term
  catalyst. A handful of other large
  energy infrastructure projects in
  Canada would quickly change
  supply/demand fundamentals.
• Outside of Canada, US and Australia
  markets are robust.
• LodgeLink - online digital marketplace
  with over 430 properties listed and
  ~53,000 rooms available in workforce
  lodges and hotels. Offered
  throughout Canada, with US
  expansion underway.                      5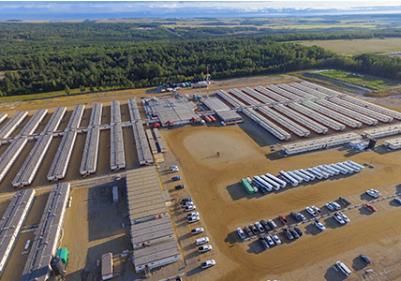
Creating Financial Flexibility

                                                         FFO 1 and Leverage Ratio                                                                                      Net Debt 1 Reduction
                                                 16                                                  4                                                        190

                                                 14                                                                                                           170   176
                                                        14                                           3.5
   Funds From Operating Activities ($millions)

                                                 12
                                                                           12                                                                                 150           153

                                                                                                            Debt to Adjusted EBITDA1
                                                                                                     3
                                                                 11

                                                                                                                                       Net Debt ($millions)
                                                 10
                                                                                   10        10                                                               130

                                                 8                                                   2.5

                                                                                                                                                              110
                                                                                                                                                                                         113
                                                 6
                                                                                                                                                                                  105
                                                                                                     2
                                                                                                                                                              90
                                                 4
                                                                                                                                                                                                87

                                                                                                     1.5
                                                                                                                                                              70
                                                 2

                                                 0                                                   1                                                        50
                                                       Q4'17    Q1'18     Q2'18   Q3'18     Q4'18                                                                   2014   2015   2016   2017   2018
                                                      Funds From Operations       Debt to Adjusted EBITDA

 1. See “Non-GAAP Measures” at the end of this document.
                                                                                                                                                                                                     6   6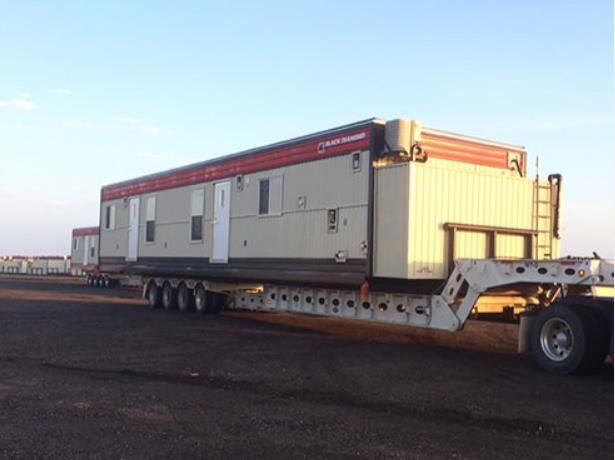
Growth Through Disciplined Capex

•   2019 capex budget of ~$35 MM (gross) funded
    through operating cash flow. Net capex of $20
    to $25 MM after used asset sales

•   MSS: $25 to $30 MM growth capital
    • Targeting 10% net fleet growth
    • New capital with ~20% ROI
    • Growth areas include BC, Ontario, and
       Southern US

•   WFS: $5 to $10 MM growth capital                Primary markets for
    • Fully utilized in some asset categories       Growth CAPEX

    • US small format accommodations
    • Australian accommodations
    • Australian space rentals
    • Introducing new products to compliment US
       accommodations
    • New capital can be deployed at ~25% ROI
       and some with > 1 year term contracts
    • Modest capital for incremental LodgeLink
       software development

                                                            7      7
Steps to Creating Value and a Better Way

                                 • Maintain existing hurdle rates for investment while
                  Improve          adding capital light products and services
                                 • Sell or repurpose underutilized WFS assets
                  Returns        • Tap into operating leverage throughout Canadian
                                   WFS asset base

                              • MSS expected to see 10% annual fleet growth from
                 Grow           organic capital investment
                              • Continue to grow and develop LodgeLink platform

                          • Expand MSS platform throughout our North American
                            footprint
              Diversify   • Investment in US and AUS business
                          • LodgeLink digital market expanded into US

  4/15/2019                                                                              8
Non-GAAP Measures
• Adjusted EBITDA is not a measure recognized under IFRS and does not have standardized
meanings prescribed by IFRS. Adjusted EBITDA refers to consolidated earnings before
finance costs, tax expense, depreciation, amortization, accretion, foreign exchange,
stock-based compensation, acquisition costs, non-controlling interests, share of gains or
losses of an associate, write-down of property and equipment, impairment, restructuring
costs, and gains or losses on the sale of non-fleet assets in the normal course of business.
• Funds from Operations is calculated as the cash flow from operating activities excluding
the changes in non-cash working capital. Management believes that Funds from
Operations is a useful measure as it provides an indication of the funds generated by the
operations before working capital adjustments. Changes in non-cash working capital
items have been excluded as such changes are financed using the operating line of Black
Diamond’s credit facilities.
• Net Debt is calculated as long-term debt excluding deferred financing costs minus cash.
4/15/2019 9 94/15/2019
THANK YOU 10
Investor Relations | investor@blackdiamondgroup.comYou can also read