Tadj Oreszczyn
UCL Energy Institute
University College London
←
→
Page content transcription
If your browser does not render page correctly, please read the page content below

Tadj Oreszczyn UCL Energy Institute University College London

Fuel Poverty

‘The first priority is therefore to ensure that by 2010
  no older householder, no family with children, and
  no householder who is disabled or has long-term
  illness need risk ill-health due to a cold home’
The UK Fuel Poverty Strategy, DTI, 2001

•   Typically 20,000 UK excess winter deaths in the UK
•   UK definition of Fuel Poverty: spend more than 10% of households
    income on fuel to maintain an adequate level of warmth.
•   Warm Front is the Governments main tool for tackling fuel poverty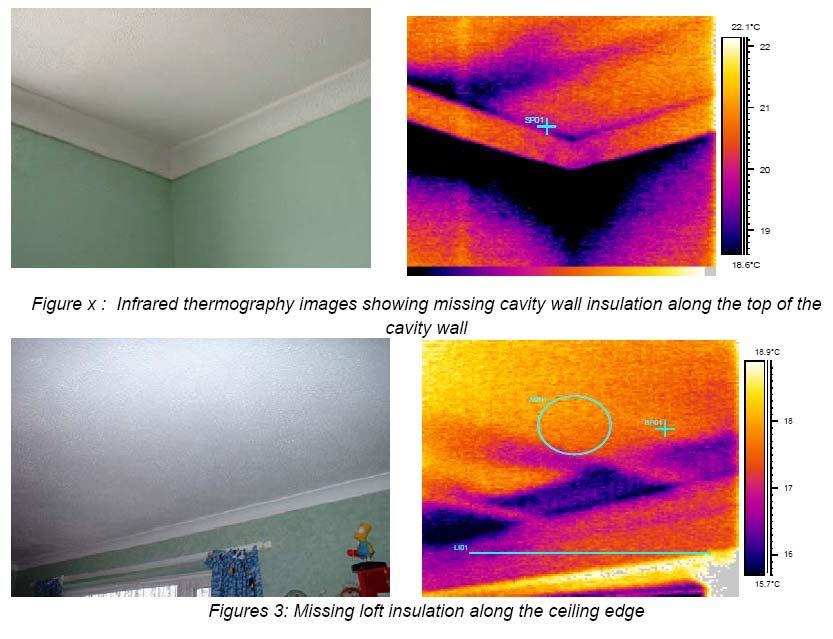
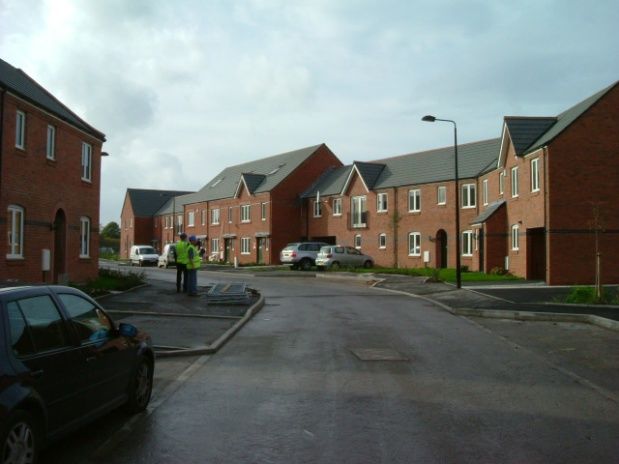
What is Warm Front ?

• Targeted at vulnerable (elderly and young) fuel poor
• In 2007/8, Warm Front received £350 million funding,
  allowing the Scheme to assist almost 270,000 households;
Warm Front

• Increases temperature in living and bedrooms
• Improves comfort
• Reduces fuel cost
• Reduces mould
• As a consequence it improves mental health and
  should reduce winter deaths
• But what does it do to energy use?
Warm Front Energy Use

• Mean energy use rises by 34%
• Two reasons
  – Occupant behaviour
     • increased temperature
                                  +
     • use of old heating

  – Not refurbished as expected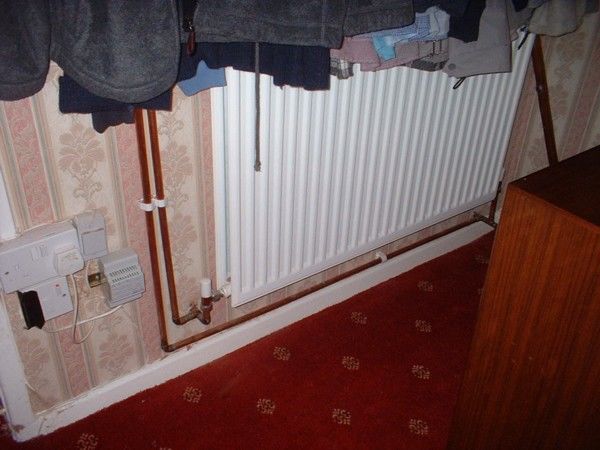
UK set in Legislation 80% reduction in Carbon
Emissions by 2050 (Climate Change Act)
• “ The good news is that reductions of this size are possible
  without sacrificing the benefits of economic growth and rising
  prosperity...”
• “But the potential will not be achieved without appropriate
  policies; financial incentives through carbon prices, taxes and
  subsidies; support for technology innovation, information and
  encouragement; and regulation when needed. The challenge is
  not the technical feasibility but making it happen.” - Commission
  for Climate Change 2008
• The “Great British Refurb”; “Whole house energy makeovers
  will be needed, and the aim is for 400,000 households a year to
  have this by 2015, with seven million homes benefiting by 2020”
Warm Front Evaluation Team
London School of Hygiene & Tropical Medicine
                                           Sheffield Hallam University
Ben Armstrong     Reader                   Roger Critchley     Visiting Research Fellow
Zaid Chalabi      Lecturer                 Jan Gilbertson      Research Fellow
Jack Dowie        Professor                Geoff Green         Professor of Urban Policy
Shakoor Hajat     Lecturer                 Mike Grimsley       Senior Lecturer
Emma              Research Fellow          Bernadette Stiell   Research Associate
Hutchinson
Megan Landon      Research Fellow          Bartlett, University College London
Wendy             Research fellow          Sung H Hong         Research Fellow
MacDowall
                                           Tadj Oreszczyn      Professor
Maryjane          Consultant
Stevens                                    Ian Ridley          Lecturer

Nicki Thorogood   Senior Lecturer
Paul Wilkinson    Senior Lecturer
National Centre for Social Research
Richard           Research Director
Boreham
Thank You
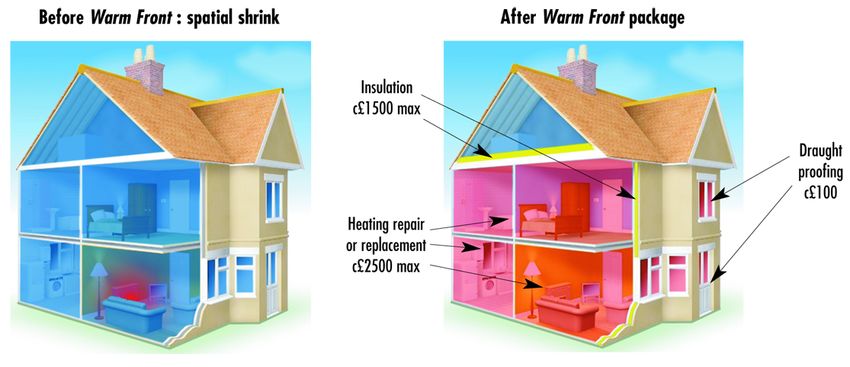
What the Warm Front Scheme can
provide?
• Insulation
– Loft
– Cavity
– Hot water tank
– Draughtproofing
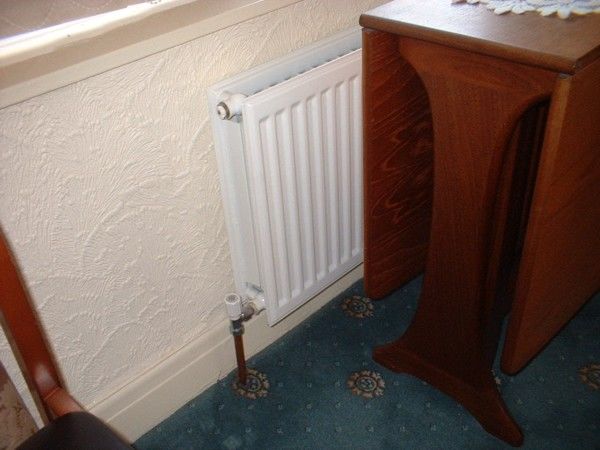
• Heating
– Gas or electric room heaters
– Central heating
– Timer controls for electric space and water heating
• Other measures
– Two low energy light bulbs
– Energy advice
– Security measures
• Up to £2,500
• around 12 million people across the UK aged
  60 and over received Winter Fuel Payments in
  the 2007/08 winter. The current rate is up to
  £200, with those over 80 (over 2.4 million
  people) receiving up to an extra £100. The
  Chancellor, in his Budget 2008 speech,
  announced an additional payment for winter
  2008/09 of £50 for households with someone
  aged 60‐79 and £100 for households with
  someone aged 80 or over. If Winter Fuel
Why is theory and practice not the same?

1. Applied physics wrongly
2. Not refurbished as modelled
3. Models do not take account of changes in
   occupant behaviour

                     ‘In theory,
                     theory and practice are the same,
                     but in practice,
                     they’re not’

                     Santa Fe Institute in Factor Four
PHYSICS APPLIED INCORECTLY:
Comparison of air infiltration rate pre- and post-warm front
Pre-Warm Front Post-Warm Front
Infiltration rate Infiltration rate
WF Scheme N N % Change
(m3/hr/m2) (m3/hr/m2)
All properties 78 17.7 (s.d. 7.1) 143 17.0 (s.d. 7.2) -4%
w/o CH 22 19.1 (s.d. 7.8) 51 16.5 (s.d. 7.3) -14%
w/ CH 56 17.1 (s.d. 6.8) 92 17.2 (s.d. 7.2) +1%Not refurbished as modelled 20% cavity wall missing in insulation (n = 85) 13% loft area missing in insulation (n = 85)
envelope defects in new housing
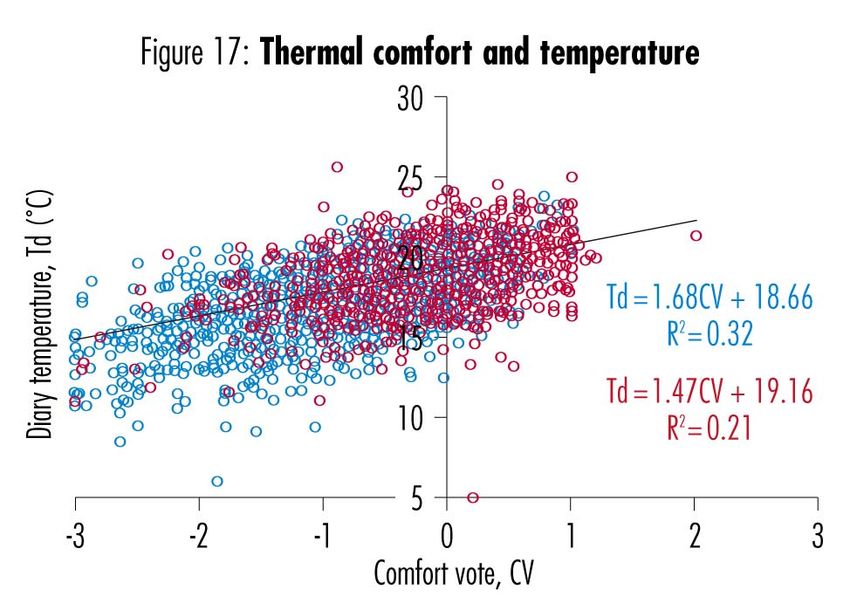
Models do not take account of
  changes in occupant behaviour
• “Rebound effect”, “Take Back”, “Comfort
  Factor”, “Take off”
• The house and its energy system is complex.
  People interact with complex systems in
  complex ways.
• Note, rebound effect only partly explains the
  difference between theory and reality and it is
  not the only change in occupant behaviour
  that has been incorrectly modelled
Theoretical boiler efficiency is not being achieved

                                          +

  “…very high proportion of tenants (80%) used some combination of
  gas fire and central heating.”

  (Energy efficient modernisation of housing: a UK case study, Bell, Lowe, 2000)
So what do we need to do to get better agreement between theory and reality? • Work with industry to improve better site practices, supply chains etc. Action research with rapid monitoring and feedback. • Socio‐technical models with feedback that can answer what impact will fuel price rise have on “Take back”. We want to revisit Warm Front properties to collect missing data and investigate the impact of price rise. • Access better data to ground models
Models require relevant data

                                         30000.0

                                         25000.0

               Average gas consumption
                 per dwelling (KWh/yr)
                                         20000.0                                             y = -16.82x + 20800
                                                                                                   2
                                                                                                  R = 0.0018

                                         15000.0

                                         10000.0
                                                   30   35   40   45      50       55   60   65            70
                                                                       Stock SAP
UK Winter Mortality • Source: National Statistics Office
Postcode Sector Average Dwelling Age vs Average Gas Consumption per Dwelling

               30000

               25000
                                                                       y = -75.102x + 167672
                                                                              2
                                                                             R = 0.4126

               20000
kWh per year

               15000

               10000

               5000

                  0
                  1920    1930    1940     1950    1960     1970     1980     1990        2000   2010   2020   2030
                                                      Mean Year of Construction
Postcode Sector Average Dwelling Age vs Average Gas Consumption per Dwelling
30000
25000
y = -75.102x + 167672
2
R = 0.4126
20000
kWh per year
15000
10000
zero carbon for
5000
all energy
0
1920 1930 1940 1950 1960 1970 1980 1990 2000 2010 2020 2030
Mean Year of ConstructionYou can also read