Electricity Prices & Competition - CER Presentation on - SEAI Conference, July 2010
←
→
Page content transcription
If your browser does not render page correctly, please read the page content below
CER Presentation on

Electricity Prices &
    Competition
SEAI Conference, July 2010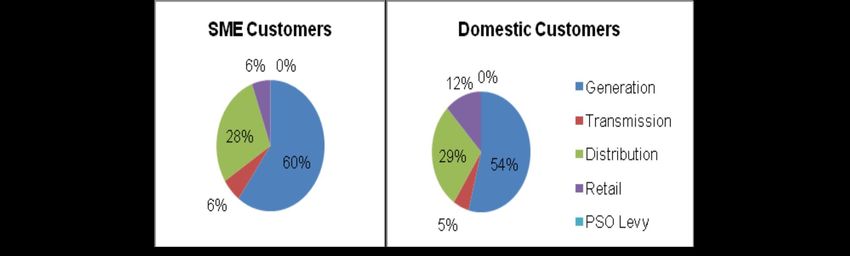
Agenda

• Who is the CER and what are our
  functions?
• What are the electricity price drivers?
• Recent fuel price trends and SEM prices
• Market contracts
• End-user retail prices
• Retail market price deregulation
Who is the CER?

• CER is Ireland‟s independent energy
  regulator
• CER regulates Ireland‟s natural gas and
  electricity markets in the interests of
  customers
• CER‟s role is to ensure a safe, secure and
  competitive supply of natural gas and
  electricity to customers
Who is the CER?

• CER is led by 3 Commissioners:
  – Michael G. Tutty, Chairman
  – Dermot Nolan, Commissioner
  – Garrett Blaney, Commissioner

• Full details of the CER‟s role at www.cer.ie
  & www.allislandproject.org
What are our functions?

• Regulate the wholesale market with NI - Single
  Electricity Market (SEM)
• Regulate energy networks - set access terms
  and prices
• Regulate end prices - electricity “Roadmap”
• Licence and monitor market players
• Customer protection and complaints resolution
• On-shore and new upstream safety functions
Electricity Price Drivers

• Generation is single biggest price driver: over
  half of a typical customer‟s bill
• Networks is 2nd biggest driver: about 1/3 of a
  customer‟s bill; less for LEUs
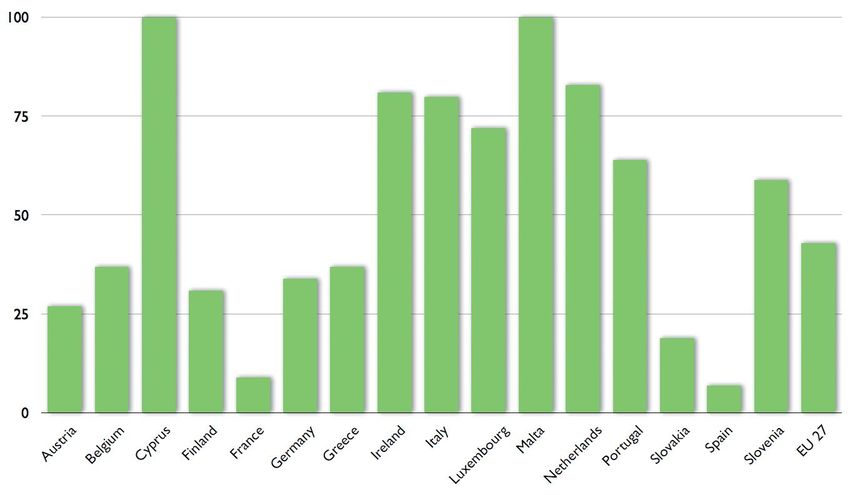
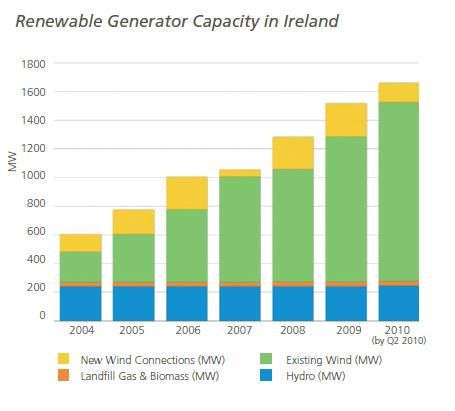
Electricity Price Drivers

• Over 80% of our generation comes from
  fossil fuels, with gas the dominant fuel

=> international fuel price, especially gas, is
   the key driver of generation costs and
   therefore Irish electricity prices - much
   more than in most EU countries
Electricity Price Drivers
Gross Electricity Generation % from Fossil Fuels, Eurozone
Electricity Price Drivers
• Generation:
  – Main reason why elec prices in Irl are higher than in many European
    countries is our fossil fuel dependence - & also why end-prices are lower
    than last year
  – Fossil fuel prices tend to be volatile: peak in „08 followed by fall followed
    by recent rise!
• Networks:
  – Capex and low population densities are the cost drivers
  – CER published “PR3” proposals last week, with a slight cut in average
    network tariffs overall this October
• PSO:
  – Govt. scheme, administered by CER, to support primarily wind & peat;
    cost estimated as €195m for next tariff year
Electricity Price Drivers • Providing a hedge, renewables are increasing - currently 15% of consumption
Fuel Prices since July „08

Source: Bloomberg
Gas Prices & the SEM
• Natural gas accounts for c. 60% of generation and is the prime
  driver of the SEM wholesale price - the SMP

Source: Bloomberg
Carbon
• Full cost of carbon emitted is
  included in the cost of electricity
• Due to fuel mix, we pay the cost of
  carbon on most of our electricity
• 2010 carbon spot price has
  increased as per graph
• Gens receive certain number of free
  carbon credits - Govt. has
  introduced a carbon levy to recover
  windfall gain, with intention to pass
  this on to LEUs
• To be administered by CER
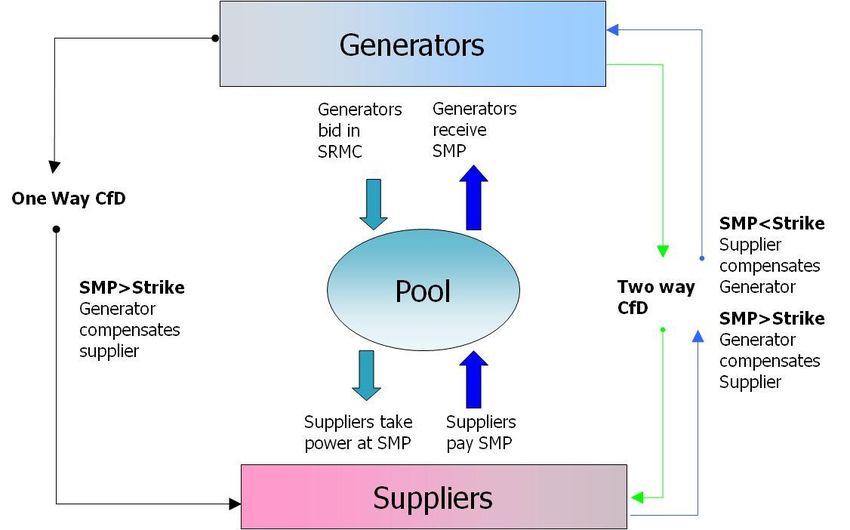
Financial Contracts (1)
Financial Contracts (2)

• Directed Contract Prices (€/MWh)
Financial Contracts (3)
• Non-Directed Contracts (NDCs):
   –   All Financial Contracts other than DCs
   –   Predominantly sold by ESB PG and NIE PPB to date
   –   Also PSO-Related Contracts, with reserve price set by RAs
   –   All sold as 2-way CfDs to date
   –   Multilateral Trading Facility with competitive auctions

• More flexibility encouraged by RAs:
   – Contracts being offered throughout the year, with monthly
     contracts being offered for first time: see AIP website

• 2010/11 Tariff Year: higher prices than DCs due to rising fuel
  prices; fuel prices putting upward pressure on end-prices
LEU Prices
Electricity & Gas Prices in Ireland
2nd Semester, July - December 2009
• Irish electricity prices remain above the European average, but
moved closer to the average for most consumers
• Prices for business fell for all levels of consumption, ranging
from:
– 5% drop for small business (band IA)
– to a 10% drop for the largest consumers (band IF)
• Medium to large business (bands ID to IF):
– 4% to 6% above the EU average, down from 10% to 13%
above in the previous semesterLEU Prices - Ireland & EU
Irish Business Electricity Prices Compared to EU 27 - all taxes
included
Based on data from SEAI report on Electricity & Gas Prices in Ireland – May 2010LEU Customer Credits
• 2010/11 Tariff Year:
– Continuation of LEU customer credits
• Financed by alternative means
• At a reduced level, to be phased out further in
2011/12
– Rebalancing of networks charges
• LEU‟s networks charges reduced by €50m per annum
• Permanent measure
– PSO
• LEU Contribution - €36mRetail Market
Deregulation
Big changes in the market place:
• Increased competition in generation & supply in recent years
• Entry of BGES and Airtricity to the domestic market
CER Roadmap consultation paper published Dec ‟09:
• Consulting on the circumstances under which the price control should
be removed from ESB CS
CER Roadmap decision paper published April „10:
• Decided on criteria under which the price controls will be removed
• CER competition review found high level of competition in LEU & all
business markets: to be price de-regulated in October.
• Domestics also seen very high switching rates: if this continues and
ESB re-branding takes place, de-regulation expected next yearDeregulation
LEU Sector
LEU Market Share (Customers) - Q4 2009 LEU Market Share (GWh) - Q4 2009
Criteria for deregulation of LEU market sector
- More than two active suppliers in the market
- Two of which have a consumption market share of 10% or more
- The combined market share (GWh) of ESBIE & ESB PES is 50%.Deregulation
- Next Steps
Competition Reviews:
• Forward looking view of market share, switching rate etc.
• Forecast Deregulation Decision, one month ahead of go-live
• Next review to be published in July
ESB Rebranding - additional requirement for the domestic
price de-regulation
Market Monitoring bi-annual publication to include:
• Number of suppliers
• Market Share (GWhs) for all suppliers
• Switching – total level of switches and switching between competitors
• Revenue – revenue earned for all suppliers to determine profitability
• Range of tariffs on offer and average prices paid by customers by tariffConsumer Survey
Published by CER and the UR on 14th June:
– Research conducted by the Research Perspective
– Covered consumer attitudes to, and awareness of, electricity
supply competition and associated issues
Key Findings For LEU Customers:
– 92% of LEU switchers found the process very easy or easy
– 86% saw their electricity bills reduced as expected;
– Cost of electricity is a significant business challenge for LEUs
– LEUs are interested in more frequent price revisions, and
would consider switching to suppliers who could provide
additional information on usage or dual fuel offeringsConsumer Survey: LEUs
Switching Data

  Total Market Switches                                           LEU Switches
  200000                                             160

  180000
                                                     140
  160000
                                                     120
  140000
                                                     100
  120000

  100000                                              80

   80000                                              60
   60000
                                                      40
   40000
                                                      20
   20000

      0                                                0

            Q1     Q2     Q3     Q4     Q1     Q2           Q1     Q2     Q3     Q4     Q1     Q2
           2009   2009   2009   2009   2010   2010         2009   2009   2009   2009   2010   2010

Total Market switches in 2009 = 454,956              Total LEU switches in 2009 = 267 or 17%
Questions and Answers
You can also read