Do you have the data to support your housing delivery strategy? - Insights - Hometrack

Page created by Randy Johnson
 
CONTINUE READING
Do you have the data to support your housing delivery strategy? - Insights - Hometrack
Insights

Do you have the
data to support
your housing
delivery strategy?
Do you have the data to support your housing delivery strategy? - Insights - Hometrack
Introduction
Over the five years to 2021 the public sector intends to develop
more than 280,000 new units across all tenures, at an estimated
cost of £55bn. Although government subsidy and debt will play a
part, over half (£31bn) of this investment will be funded directly
through sales revenue.

The Regulator of Social Housing has identified that the development
of homes for sale is a key area of risk which exposes registered
providers. This puts the onus on scrutiny panels and boards to
truly understand the risk and reward behind their development
decisions, and ensure appropriate coping mechanisms are in place
to mitigate against risks associated with exposure to the wider
market or changes in government policy.

This report showcases 4 key Hometrack metrics to reflect on
current market conditions and examine housing trends in 2018.
Analysis
  Turnover
  Each year around 10% of all property transactions are new build, however the distribution of development
  is not uniform across Great Britain. In recent years the introduction of Help to Buy, growth in LCHO, and the
  emergence of BTR has meant some local housing markets are more driven by new build than others. This is
  important as registered providers look to accelerate, and diversify, their development ambitions to help meet
  the government’s target of 300,000 homes per year.

  Chart 1 New build concentration by region

                            14%
                                     14.0%

                                                   13.9%

                            12%
                                                                12.1%

                                                                             11.9%

                                                                                           11.5%

                                                                                                         11.5%
% New build concentration

                                                                                                                                                                                           11.1%
                            10%
                                                                                                                       10.3%

                                                                                                                                                   10.2%
                                                                                                                                    10.2%

                                                                                                                                                                  9.0%
                            8%

                                                                                                                                                                           7.1%
                            6%

                            4%

                            2%

                            0%
                                     st

                                                  on

                                                               ds

                                                                             n

                                                                                          ds

                                                                                                         st

                                                                                                                       t

                                                                                                                                    d

                                                                                                                                                   t

                                                                                                                                                                          es

                                                                                                                                                                                          in
                                                                                                                                                                  r
                                                                                                                       es

                                                                                                                                               es

                                                                                                                                                               be
                                                                           er

                                                                                                                                    n
                                  Ea

                                                                                                                                                                                        it a
                                                                                                        Ea

                                                                                                                                                                          al
                                                                n

                                                                                           n
                                              nd

                                                                                                                                 la
                                                                                                                      W

                                                                                                                                              W
                                                                         st
                                                             la

                                                                                        la

                                                                                                                                                             um

                                                                                                                                                                         W
                                                                                                                               ot

                                                                                                                                                                                    Br
                                th

                                                                                                    h
                                             Lo

                                                                        Ea
                                                           id

                                                                                      id

                                                                                                                 th

                                                                                                                                             h
                                                                                                    ut

                                                                                                                               Sc

                                                                                                                                                           H
                             or

                                                                                                                                            ut
                                                           M

                                                                                     tM

                                                                                                                                                                                   at
                                                                                                                 or
                                                                                                   So

                                                                                                                                                           e
                            N

                                                                                                                                        So

                                                                                                                                                                               re
                                                       st

                                                                                                                                                        th
                                                                                                             N
                                                                              es

                                                                                                                                                                               G
                                                    Ea

                                                                             W

                                                                                                                                                    &
                                                                                                                                                   re
                                                                                                                                                 hi
                                                                                                                                              ks
                                                                                                                                               r
                                                                                                                                            Yo

  Source: Hometrack Dashboard, December 2017

  Chart 1 shows the new build concentration by region and for Great Britain as a whole. New build
  concentration is defined as the number of private housing starts in the last 12 months, expressed as a
  percentage of total transactions for the same period.

  On a regional level the highest new build concentration is in the North East (14%) followed by London (13.9%)
  and the East Midlands (12.1%). The above average level in the North East reflects a slow recovery in the
  general level of housing transactions in the region, compared to the rest of the country. Help to Buy is being
  used on a notable proportion of housing completions in the North East to support supply.

  London has registered a major increase in housing supply in the last 5 years and, while the general level of
  housing turnover has also grown, so has new supply. However, developers are starting to migrate out of
  London as affordability constraints bite and turnover starts to decelerate.
Chart 2 12 month price change relative to 5 year compound annual growth rate

                                                                                                              5 year (CAGR)         12 month price change
                         10%
 12 month price change

                         8%

                         6%

                         4%

                         2%

                         0%
                               on

                                         n

                                                   st

                                                              t

                                                                            ds

                                                                                              r

                                                                                                         ds

                                                                                                                       t

                                                                                                                               es

                                                                                                                                            d

                                                                                                                                                         st
                                                              es

                                                                                                                     es
                                                                                          be
                                       er

                                                                                                                                           n
                                                  Ea

                                                                                                                                                     Ea
                                                                                                                               al
                                                                             n

                                                                                                          n
                           nd

                                                                                                                                        la
                                                             W

                                                                                                                    W
                                     st

                                                                                         um
                                                                          la

                                                                                                       la

                                                                                                                              W

                                                                                                                                       ot
                                              h

                                                                                                                                                    th
                          Lo

                                    Ea

                                                                        id

                                                                                                     id
                                                         h

                                                                                                                  th
                                              ut

                                                                                                                                     Sc
                                                                                     H

                                                                                                                                                or
                                                         ut

                                                                     M

                                                                                                  tM

                                                                                                               or
                                             So

                                                                                     e
                                                        So

                                                                                                                                                N
                                                                    st

                                                                                    th

                                                                                                              N
                                                                                                es
                                                                   Ea

                                                                                 &

                                                                                               W
                                                                               re
                                                                            hi
                                                                          ks
                                                                           r
                                                                        Yo

Source: Hometrack house price indices, December 2017

The compound annual growth rate (CAGR) is the
mean annual growth rate of an investment over a
specified period of time longer than one year.

The North, along with Scotland and Wales, have
outperformed their long run average with the North                                                Scrutiny panels will not be
East registering a 2.4% increase on the 5 year CAGR                                               able to rely on the market
of 1.9%. These markets are less mature in their
recovery following the 2007–2009 financial crisis,
                                                                                                  outperforming their
and therefore still have headroom for growth as they                                              modelling assumptions for
rise off a low base.
                                                                                                  marginal schemes
In London and the South East, house prices have
performed strongly over the past five years but have
started to see low single digit growth with small
declines in prime London. This has implications on
development cashflows as scrutiny panels will not
be able to rely on the market outperforming their
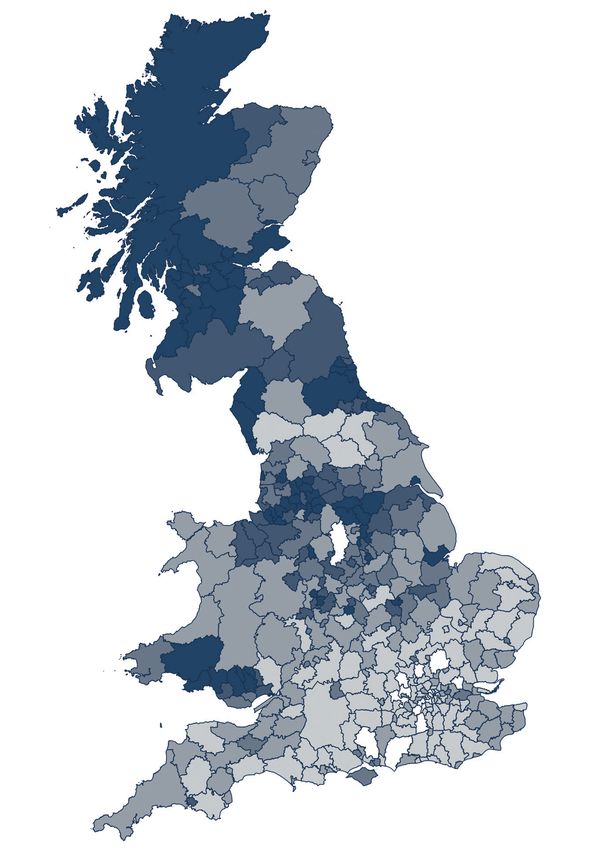
modelling assumptions for marginal schemes.
Chart 3 Price to earnings ratio for a 2-bed resale property

Price to earnings ratio

     Below 4

     4–5

     5–6

     6–7

     7–8

     Above 8

Source: Hometrack Dashboard, December 2017
Based on gross weekly single person earnings

                                                The London average price to earnings ratio sits at
                                                14x, rising to 18x for the inner London boroughs.
  There are opportunies for                     This makes for a challenging environment for first
  other tenures such as private                 time buyers to enter the market. However, it does
                                                highlight the opportunity for other tenures such
  rent, discount market rent or                 as private rent, discount market rent or low cost
  low cost home ownership to                    home ownership to pick up the slack in terms of
  pick up the slack in terms of                 routes to delivering the extra homes demanded.

  routes to delivering the extra                Once again, the Midlands and the North
                                                present the strongest all-round opportunities
  homes demanded                                for development in the medium term, with an
                                                average price to earnings ratio of below 5x.
Chart 4 Gross yield

                                                       Postcode   Area         Gross yield

                                                         L20      Bootle       10.4%

                                                         DL4      Shildon      10.3%

                                                         L4       Everton      10.0%

                                                         SR1      Sunderland   9.8%

                                                         FY1      Blackpool    9.5%

                                                         DL17     Sedgefield   9.3%

                                                         DN31     Grimsby      9.3%

                                                         M8       Manchester   9.2%

                                                         L6       Liverpool    9.1%

                                                         L9       Liverpool    8.5%

                                                         CH41     Birkenhead   8.4%

                                                         CV1      Coventry     8.4%

                                                         HU3      Hull         8.2%

                                                         HD1      Kirklees     8.1%

                                                         DN1      Doncaster    8.1%

Source: Hometrack Dashboard, December 2017

Chart 4 highlights the top 15 performing
postcodes in terms of gross yield (the annual
return on investment) across Great Britain.            When looking inward, yield
12 of the top 15 markets are based in the North        can be a useful tool in
West or Yorkshire. We would expect this gap to
narrow as prices continue to grow over the coming
                                                       assessing existing assets
years. On average London and the South return a        and benchmarking their
yield of circa 4%, but there are still some enclaves
outperforming their counterparts, namely in
                                                       performance when identifying
Barking and Dagenham (5.7%).                           regeneration opportunities
When looking inward, yield can be a useful tool        within registered providers’
in assessing existing assets and benchmarking          own asset base
their performance when identifying regeneration
opportunities within registered providers’ own
asset base.
In a rapidly evolving housing market you need access to accurate
and up to date intelligence, so you can base critical business
decisions on fact.

The UK’s leading housebuilders and housing associations rely on
Hometrack’s accurate, independent market intelligence to inform
their housing strategy. Whether it’s understanding the competition
and local market, or optimising price and reducing downside risk,
Hometrack helps businesses make critical decisions by transforming
residential property data into actionable insight.

Hometrack has over 15 years of experience working with over
130 Housing Associations and Local Authorities. Our Public
Sector team have knowledge of directly working within the sector,
providing them with unique insight and understanding of the
challenges registered providers face.

Hometrack’s insights are regularly used to:
• Aid research and strategic planning
• Support development and sales teams with impartial market intelligence
• Unlock the latent value of assets

                Contact Hometrack’s Residential Real Estate team

                      Ross Allan – rallan@hometrack.com
                     Rob Owens – rowens@hometrack.com

                                                   020 3744 0410 | hometrack.com
You can also read