Unpacking the Driving Forces of Historical Electricity Generation Cost Change In Korea : Market Forces vs Technological Learning
←
→
Page content transcription
If your browser does not render page correctly, please read the page content below
Unpacking the Driving Forces of Historical
   Electricity Generation Cost Change In Korea
    : Market Forces vs Technological Learning

               Donghyun Choi, Jiyong Eom, Cheolhung Cho*
                                 KAIST
                        *cheolhung@kaist.ac.kr
                               2021/06/08

                                       1st IAEE Online Conference

This research was supported by the National Research Foundation of Korea (NRF) grants (NRF-
2019K1A3A1A78112573). The views and opinions expressed in this study are those of the authors alone.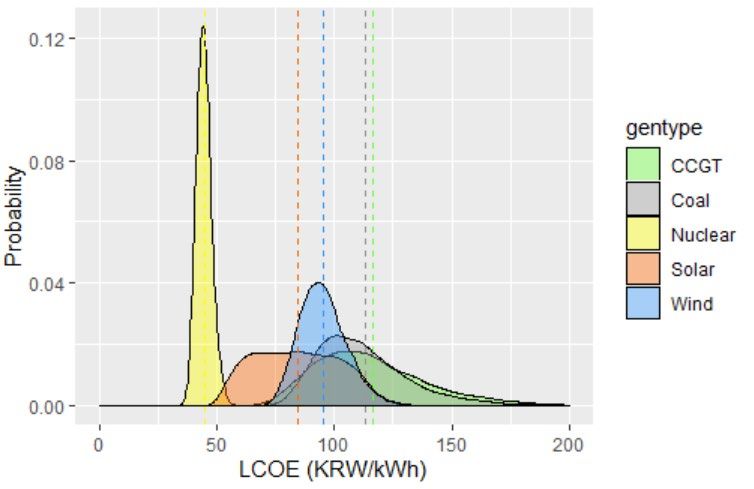
(1) Introduction
• Electricity generation in Korea (9th BPLE*)
   - Promote low-carbon power generation technologies
   - Limiting additional unit of nuclear power plants
   - Conventional power generating sources will remain dominant in 2030

                                                                                (Source: Buchholz, 2019)

                      < Electricity generation share by technology in Korea >

 * 9th Basic Plan for Long-term Electricity Supply & Demand                                       2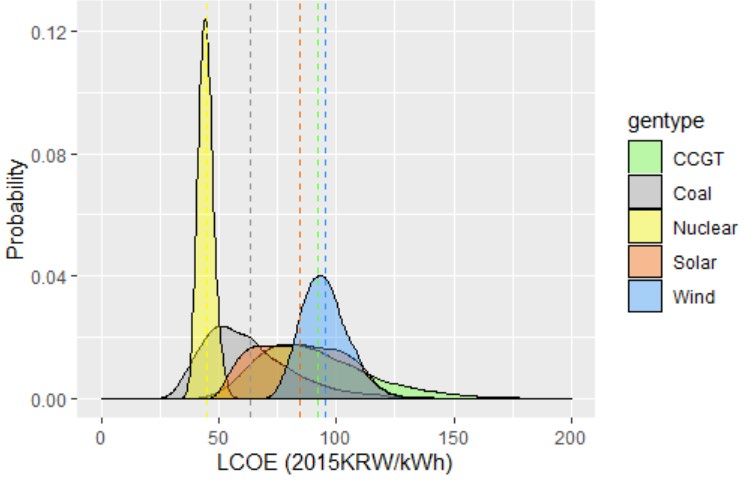
(1) Introduction
• Cost of decarbonizing energy system
  - Replacing coal with gas: Reduce emission, Increase volatility of cost
  - Renewable: Costly (up to now), Increase the energy self-sufficiency

• Research Question
  - Will renewable electricity generation likely to become cost-competitive?
  - How technology learning and market uncertainties affect the future LCOE?
  - What are enabling policy, technology, market condition for energy transition?

                                                                  Technology
                                                                  Learning

                                                                  Market
      LCOE Trends                                                 Uncertainty

                                                                                3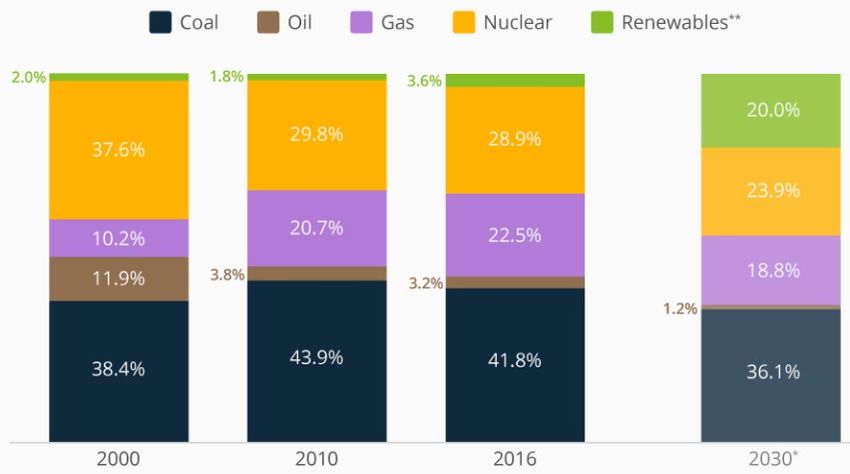
(2) Literature Review
• LCOE (Levelized Cost Of Electricity)
    - Measure to compare cost-competitiveness of different generation sources
    - Fuel cost, O&M cost, Capital cost are converted in $/kwh unit
• Historical LCOE
  - Decades of empirical plant level cost data: McNerney et al. (2011), Koomey &
    Hultman (2007), Boccard (2014)
    - Focus on construction cost: Grubler (2010), Lovering et al. (2016)
• Stochastic LCOE
    - Uncertainty in fuel price, carbon price, construction duration, renewable generation
    - Cross technology comparison: Heck et al. (2016), Lucheroni and Mari (2017)
    - In-depth technology analysis: Aldersey-Williams & Rubert (2019), Geissmann &
    Ponta (2017)
•   Contribution
    - Stochastic LCOE projection based on trends & distributions from historical data
    - Cross-technology comparison to draw implications in the context of energy transition

                                                                                             4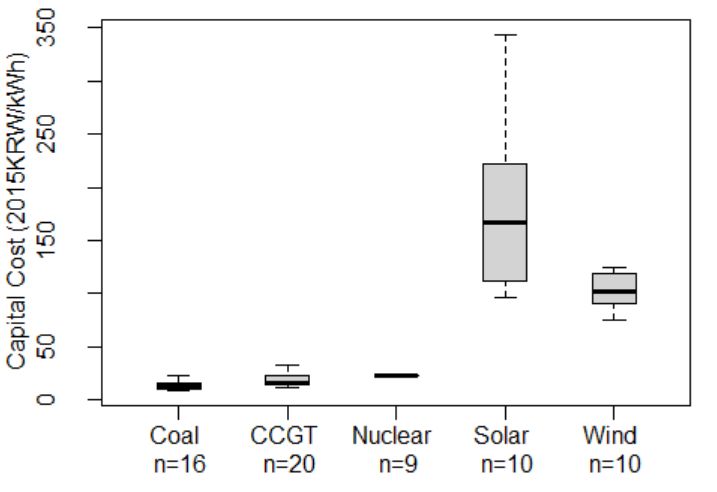
(3) Method
• Data
     - Extensive plant-level data* for conventional technologies
       (Coal: Steam turbine using bituminous coal, Gas: Combined cycle)
     - Commercial scale renewable plants (Solar >100kW ; Wind >1MW unit)
     - Sources: KITA, EPSIS, KEPCO, KPX, and BNEF

                                                             < Data coverage >
                 (as of 2019)                          CPP               CCGT                     NPP      Solar       Wind
                                                        60                 187                      26     N/A          N/A
           A. Number of plants
                                                      (36.9)              (32.5)                  (21.8)   (8.1)        (1.3)
            in operation (GW)
                                                        58                 174                      26      198          57
           B. Number of plants
                                                      (36.4)              (31.0)                  (21.8)   (0.62)      (1.14)
            in analysis (GW)
                                                     97.1%               93.0%                 100%         N/A         N/A
           Data coverage (B/A)                      (98.6%)             (95.4%)               (100%)       (7.7%)     (87.8%)

                                                                                                                    (Source: KPX)

* Plant-level data is limited to construction cost while other data is technology-year-specific                                 5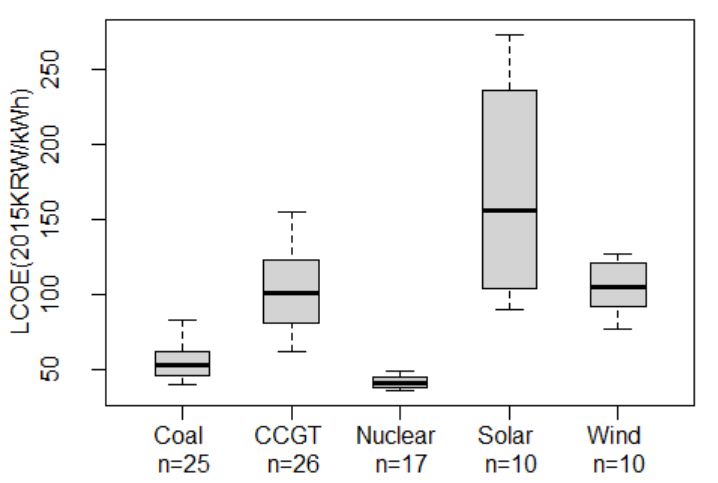
(4) Analysis
• LCOE trends
  - LCOE as of 2017: Nuclear < Coal < CCGT < Solar < Wind
  - Renewable sources are still expensive, but their LCOE is decreasing
• LCOE Volatility
  - LCOE of nuclear is stable while that of fossil-fuel based technologies are volatile
  - LCOE volatility of the CCGT was larger than that of Wind

                   < LCOE trends and volatility of each technology>

                                                                                   6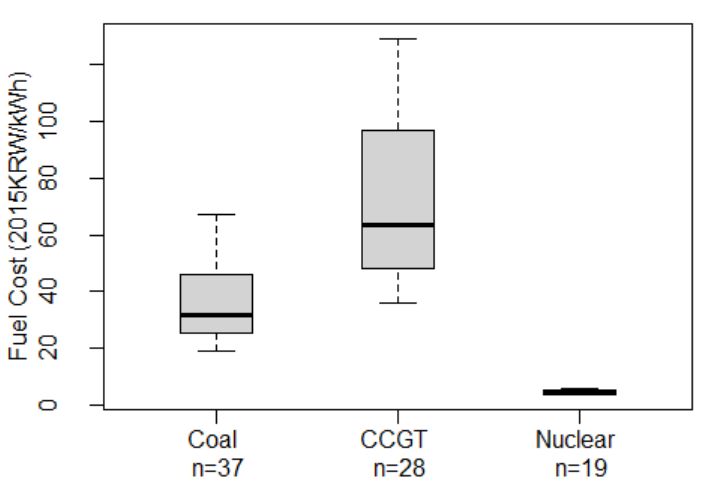
(4) Analysis
   • Source of volatility
     - Fuel cost: Fossil fuel import price (Coal, Gas)
     - O&M cost:
       1) Capacity factor change as a peak-load generator (CCGT)
       2) Increased maintenance due to enhanced safety regulations (Nuclear)
     - Capital cost: Matured technologies show small volatilities while renewables
     show high volatilities

               (a) Fuel cost                                  (b) O&M cost*                                   (c) Capital cost

* We could not get representative O&M cost data. We assumed O&M cost is proportional to capital cost for LCOE calculation        7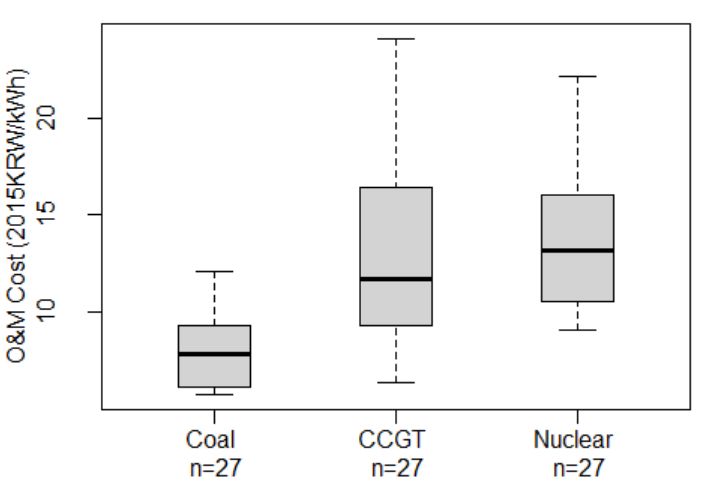
(4) Analysis
• Technology Learning
  - Learning rates were derived with construction cost – accumulated capacity
  - Conventional technologies show negative learning
  - Solar technology shows substantial cost decrease while wind did not
• Unit construction cost of CCGT was the lowest while that of solar was the
  highest in average

                                            < Learning rate of each technology >
                                          Coal         CCGT          Nuclear         Solar          Wind
       Period                         1984 - 2017    1992-2019      1978 - 2019    2005-2019      2004-2019
       Learning rate                     -2.23%       **
                                                           -6.70%     -1.71%       ***
                                                                                         23.74%    -0.36%
       R2                                  0.01            0.14        0.03              0.62       0.00
       Mean (KRW / kW)                 1,380,266      829,673       2,540,236      4,535,774      2,584,806
       Standard deviation               330,892       156,964        402,651       3,540,212       716,829

Notes: ***: P < 0.001, **: P < 0.05, *: p < 0.1                                                               8
(5) Future Projection
• Distribution of key parameters
- Market factor: derive probability distribution based on historical data*
- Technology factor: Learning rate
- Policy factor: Optimal carbon price escalation rate (Peck & Wan, 1996)**
Conventional Renewable
Coal CCGT Nuclear Solar Wind
Life time (years) 40 30 40 25 25
Fuel Import Price Probability distribution N/A
Market
Capacity Factor Probability distribution
factor
Interest rate 4.5%
Thermal Efficiency Historical maximum N/A
Technology Learning rate &
Construction cost
factor Uniform distribution within a 95% confidence interval
Specific O&M cost Fixed at the most recent value
Policy
Carbon Price Probability distribution
factor
* We derive distribution using AD test, Shapiro-Wilcox test, and Kolmogorov-Smirnov test to derive probabilistic distribution 9
** Carbon price distribution was also derived from the ETS market price with assumed 7% cost escalation in (Peck & Wan, 1996).(5) Future Projection
• Monte Carlo Simulation
- Pair-wise comparison of 10,000 Monte Carlo simulated samples
- Cost reversal probability (CRP) reveals the probability of one technology
become cheaper than the other technology
ex) CRP (Coal, CCGT) = 18.8% CRP (Coal, Solar) = 7.6%
< 2017 LCOE Distribution based on simulation >
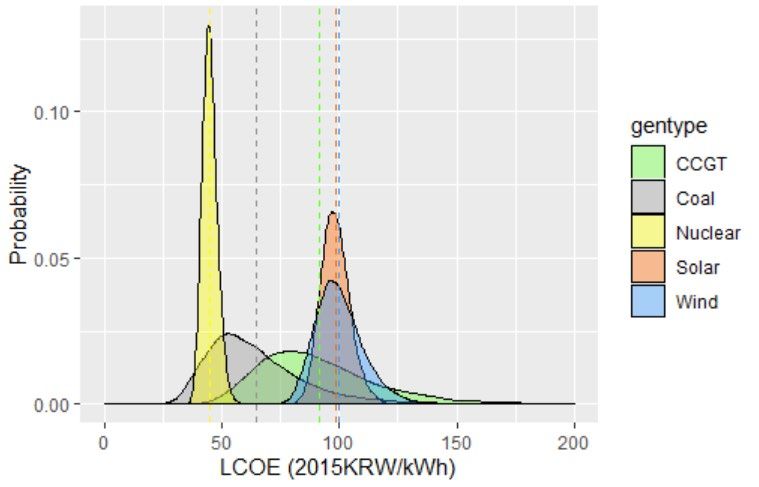
10(5) Future Projection
• Energy Transition
- Without policy intervention, solar will become cheaper than CCGT, but remain
relatively expensive compared to baseload technology
CRP (Coal, Solar) = 20.7% CRP (Coal, Wind) = 9.2%
- Carbon pricing will relatively make renewables more cost competitive.
CRP (Coal, Solar) = 85.2% CRP (Coal, Wind) = 77.6%
Fossil-fuel
based tech
(a) 2030 LCOE distribution (b) 2030 LCOE with carbon pricing
* The mean carbon price in 2030 is 51,267 KRW/ton (around $46/ton) 11(5) Future Projection
• Coal to Gas switching
- Another strategy to reduce carbon intensity of the energy system
- If coal keeps current capacity factor (85%), slight increase in CF of CCGT
above 50% will make CCGT cost competitive
- Combination of carbon pricing and increase use of CCGT can phase-out the
coal power
< Capacity factor of Coal and CCGT when order change probability is same >
* Dashed line shows the capacity factor of coal and CCGT in 2017, which is 48% 12(6) Conclusion
• The change in LCOE of fossil-fuel based power has been accounted for
mainly by shifting fuel import prices, while that of nuclear power has
been driven primarily by O&M costs.
• No policy measure on the table would keep coal power plants cost-
competitive. Carbon pricing is pivotal to accelerate the nation's low-
carbon energy transition.
• Transition away from fossil fuel-based power generation decrease the
sector's reliance on imported fuel, reducing the overall volatility of
power generation cost and promoting the nation's energy security.
• Limitations: We did not consider the potential multivariate relationship
between cost parameters and additional system-level costs of
renewables arising from the intermittency. Future research would
investigate the contribution of these effects
13References
• Aldersey-Williams, J., & Rubert, T. (2019). Levelised cost of energy–A theoretical justification and
critical assessment. Energy policy, 124, 169-179.
• Buchholz, K. (June 20, 2019). Korea’s Ambitious Plan to Grow Renewables [Digital image].
Retrieved June 06, 2021, from https://www.statista.com/chart/18454/electricity-generation-in-
korea-by-type/
• Boccard, N. (2014). The cost of nuclear electricity: France after Fukushima. Energy Policy, 66, 450-
461.
• Lucheroni, C., & Mari, C. (2017). CO2 volatility impact on energy portfolio choice: A fully
stochastic LCOE theory analysis. Applied Energy, 190, 278-290.
• Peck, S. C., & Wan, Y. S. (1996). Analytic solutions of simple optimal greenhouse gas emission
models. In Economics of atmospheric pollution (pp. 113-121). Springer, Berlin, Heidelberg.
• Grubler, A. (2010). The costs of the French nuclear scale-up: A case of negative learning by doing.
Energy Policy, 38(9), 5174-5188.
• Geissmann, T., & Ponta, O. (2017). A probabilistic approach to the computation of the levelized
cost of electricity. Energy, 124, 372-381.
• Heck, N., Smith, C., & Hittinger, E. (2016). A Monte Carlo approach to integrating uncertainty into
the levelized cost of electricity. The Electricity Journal, 29(3), 21-30.
• Koomey, J., & Hultman, N. E. (2007). A reactor-level analysis of busbar costs for US nuclear plants,
1970–2005. Energy Policy, 35(11), 5630-5642.
• McNerney, J., Farmer, J. D., & Trancik, J. E. (2011). Historical costs of coal-fired electricity and
implications for the future. Energy Policy, 39(6), 3042-3054.
14You can also read