Climate Drivers
Global Change Ecology
      Botany 275
←
→
Page content transcription
If your browser does not render page correctly, please read the page content below
Climate Drivers
Global Change Ecology
Botany 275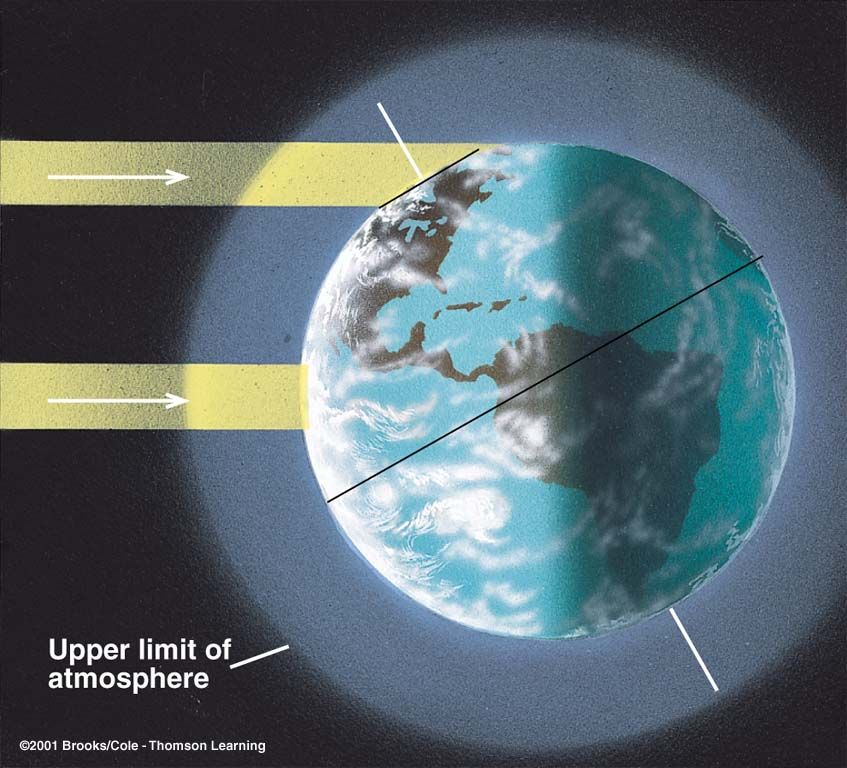
External and Internal
 Drivers of Climate

   External Drivers
     -Sunspot Cycles
     -Orbital Variations
   Internal Drivers
     -Plate Tectonics
     -Volcanic Activity
     -Albedo
     -Greenhouse Effect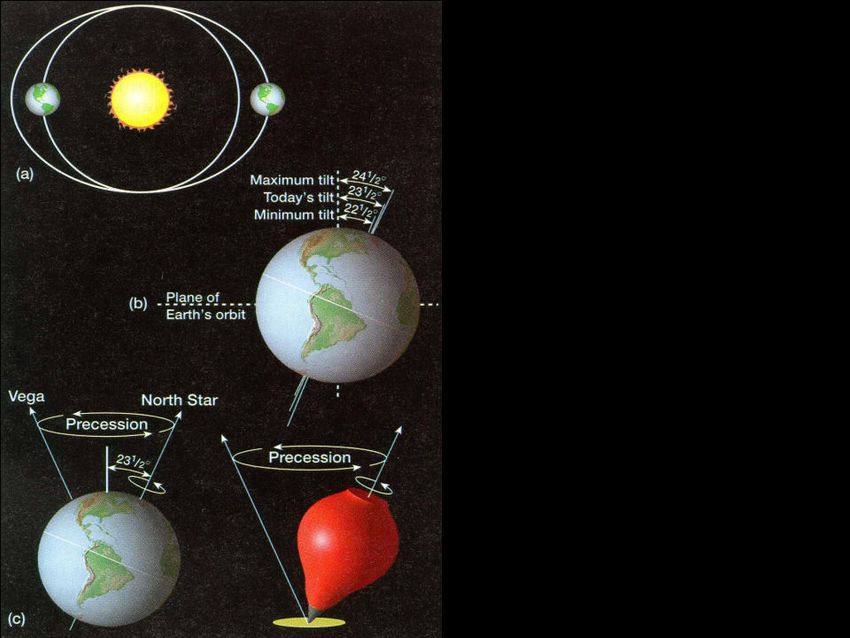
Climate forcing mechanisms

Mechanism                               Time period
1. Solar Forcing
     Solar intensity (sunspots)         (10 s to 100 s of years)
     Orbital Variations                 (Thousands of years)
2. Plate Tectonics                      (Millions of years)
     Mountain building, continent locations
3. Albedo                               (all time scales)
4. Aerosols                             (1-10 years)
     Volcanoes, pollution
5. Greenhouse Effect                     (all time scales)
     CO2, Methane, Water vapor
6. Land use                             (1 to 100 s of years)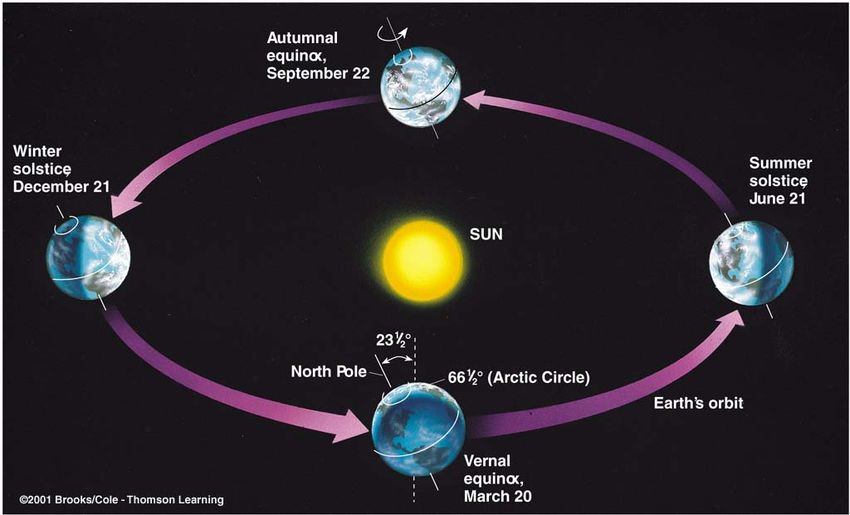
Climate Drivers
Incoming solar energy
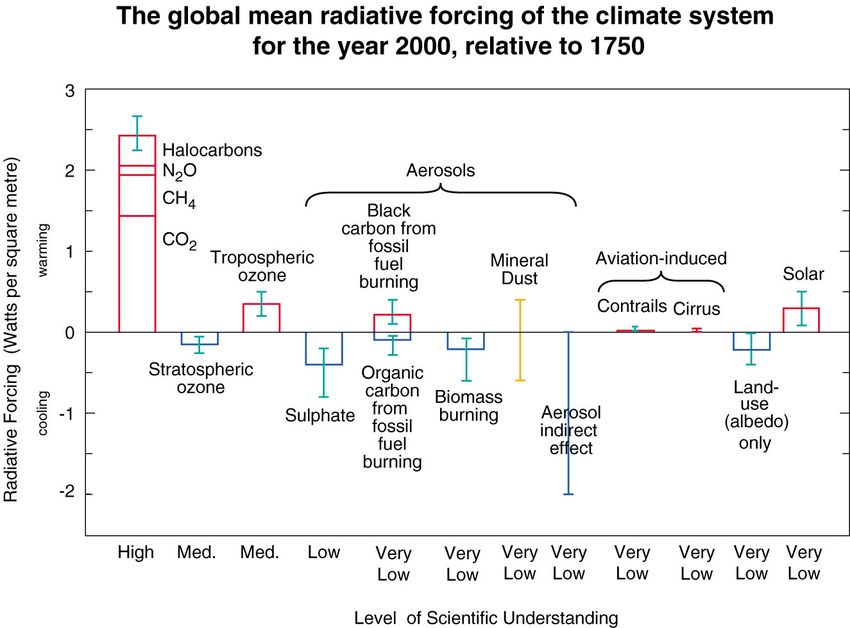
Radiative

           Forcing of Climate Change

Measured

 in units of watts per square meter (watts/m2)

Average solar radiation reaching the earth at the top of
the atmosphere=1370 watts/m2
This equates to 343 watts/m2 when distributed
uniformly over the earth s surface.

For reference: A doubling of CO2 from pre-industrial
level of 280 ppmv to 560 ppmv results in radiative
forcing of about 4 watts/m2,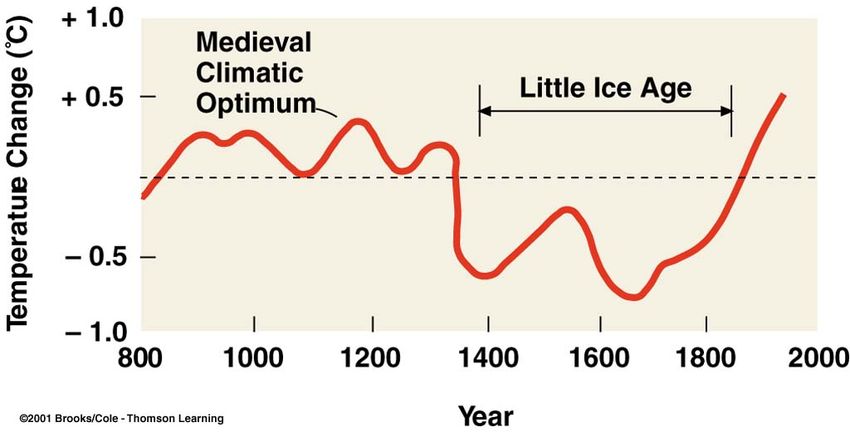
Estimated solar irradiance variations
                   1750-2000
One way to measure
solar intensity is from
satellite observations,
which are available only
since the late 1970 s.
These show solar
variations of about 0.2
watts/m2. This graph
shows estimates of
changes in solar output
since 1750.
Figure 2.17
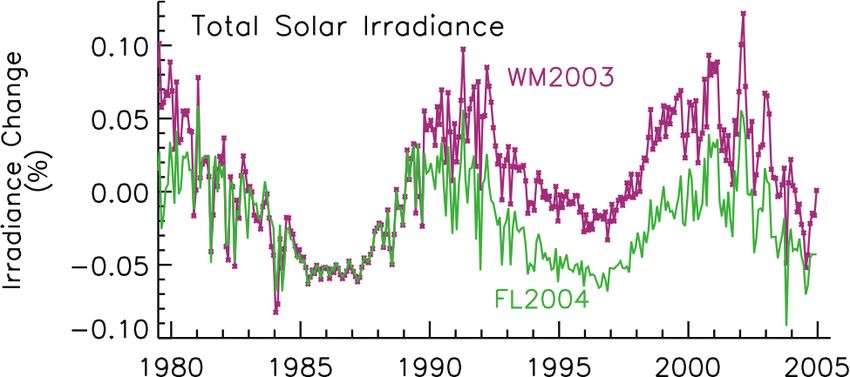
Figure 2.16
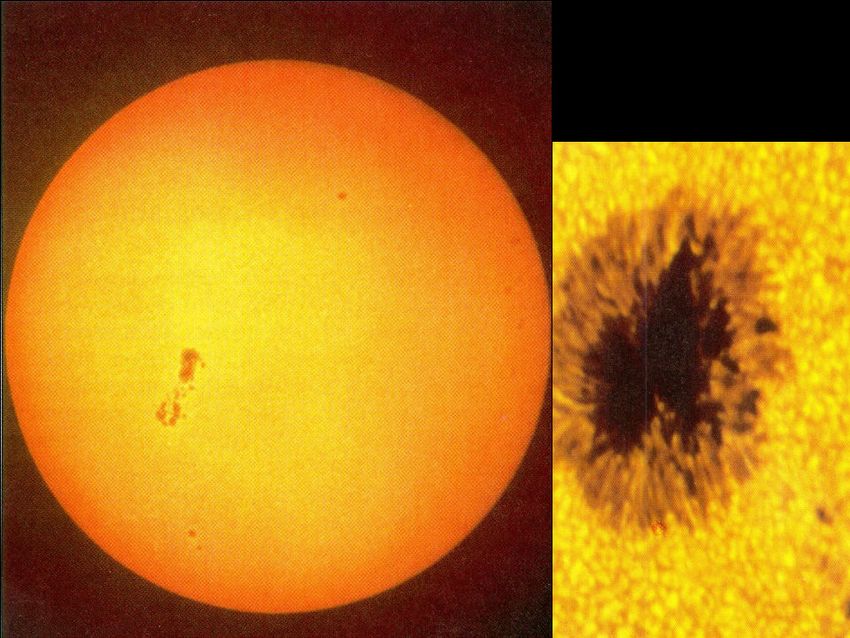
Sunspots
Sunspot Cycles
Number of sunspots

                                      Maunder
Climate Drivers
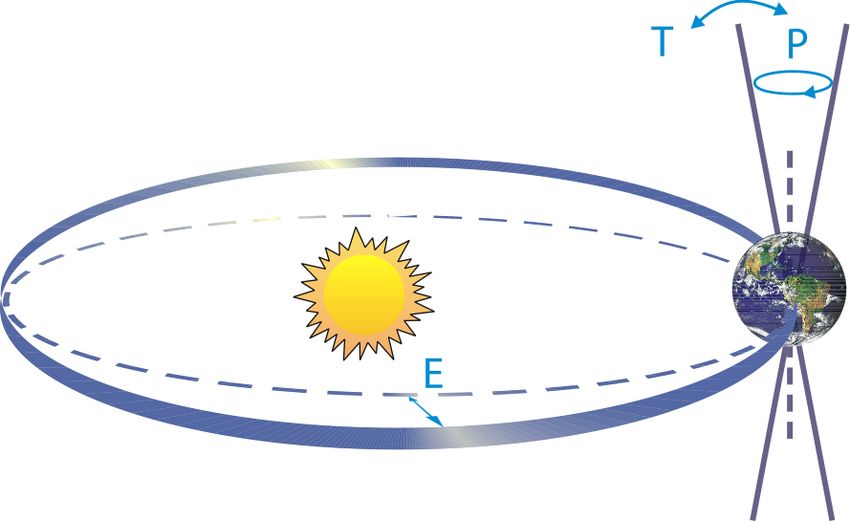
Orbital Variations or Milankovitch
CyclesMilutin Milankovitch 1879-1958
http://earthobservatory.nasa.gov/Library/Giants/Milankovitch/Current Eccentricity
Variation in Axial Obliquity, 40,000 year cycle
 Tilt of the axis

                http://earthobservatory.nasa.gov/Library/Giants/Milankovitch/
Precession of the equinoxes, ~19,000 to 23,000 year
Cycle: Direction of tilt Wobbling top
http://earthobservatory.nasa.gov/Library/Giants/Milankovitch/Orbital Variations: Milankovitch Cycles Orbital Eccentricity. Shape of the Earth s orbit (cycles ~100,000 years) – changes the distance between the Earth and Sun Axial tilt (cycles over 41,000 years) – changes noon day Sun elevation and daylength Precession of the equinoxes (cycles over 19,000-23,000 years) – changes when winter and summer occur on Earth.
Insolation at 65 degrees north latitude
from the present to 1 million years ago

                              Berger 1991
Vostok time series and insolation
Atm
TempQuestion: 1. How do Milankovitch cycles (e.g., changes in orbital parameters) lead to the onset and termination of ice ages? (e.g., warm summers & cold winters, cool summers and warm winters, etc.) 2. Propose a sequence of events or processes considering that the overall change in insolation is small (e.g., ~0.25 watts/m2), but that the ice ages are global.
-35
                                                               GISP2
                                                               (N. Atlantic SSTs)
per mille
VSMOW

            700                                                Methane
      -45
            ppbv
                                                               CO2
      275
            400

   ppmv     100
                                                               Sea-Level
                                                               (Ice Volume)
             m
     175

       50                                   July (45 deg. N)
             0
                        warm

    W/m2                                                       Insolation

                        cold

            January (45 deg. N)
      -50
                   25        20  15       10     5    0
                                Calendarof
                            Thousands    ka years ago
-35
GISP2
(N. Atlantic SSTs)
per mille
VSMOW
700 Methane
-45
ppbv
CO2
275
400
ppmv 100
Sea-Level
Small ice sheets
(Ice Volume)
m
175
50 0 July (45 deg. N)
Large ice sheets
W/m2 Insolation
January (45 deg. N)
-50
25 20 15 10 5 0
Calendarof
Thousands ka years ago-35
GISP2
(N. Atlantic SSTs)
per mille
VSMOW
700 Methane
-45
ppbv
CO2 (from ice cores)
275
400 High CO2
ppmv 100
Sea-Level
(Ice Volume)
m
175 Low CO2
50 0 July (45 deg. N)
W/m2 Insolation
January (45 deg. N)
-50
25 20 15 10 5 0
Calendarof
Thousands ka years agoGISP2
warm
-35 (Oxygen isotopes-
Measures air
per mille temperature)
VSMOW
700 cold
Methane
-45
ppbv
CO2 (from ice cores)
275
400
ppmv 100
Sea-Level
(Ice Volume)
m
175
50 0 July (45 deg. N)
W/m2 Insolation
January (45 deg. N)
-50
25 20 15 10 5 0
Calendarof
Thousands ka years agoMilankovitch Theory of Ice Ages
The Milankovitch (1941) theory of the ice ages assumes that
summer insolation anomalies at high latitudes in the Northern
Hemisphere (NH) drive the ice ages: minimum summer
insolation allows snow and ice accumulated in the cold
season to survive, while maximum summer insolation tends
to melt the ice sheets.
Hansen et al. 2007. Climate change and trace gases. Phil. Trans. R. Soc. A. 1925-1954.Alternative Theory of Ice Ages
Hansen et al. 2007 suggest that spring is the critical season for
terminations, because the albedo feedback works via the large
change in absorbed sunlight that begins once the ice/snow
surface becomes wet, after which the surface albedo remains
low until thick fresh snow accumulates. A spring maximum of
insolation anomaly pushes the first melt earlier in the year,
without comparable shortening of autumn melt, thus abetting
ice sheet disintegration. And an increase of GHGs stretches
the melt season both earlier and later, while also increasing
midsummer melt.
Hansen et al. 2007. Climate change and trace gases. Phil. Trans. R. Soc. A. 1925-1954.Figure 3. (a) Temperature, CO2, and sea level (SL), (b) late spring
(April,May,June) insolation at 60 degrees N and (c) late spring (October,
November, December) insolation at 75 degrees S.
Hansen et al. 2007. Climate change and trace gases. Phil. Trans. R. Soc. A. 1925-1954.Could both theories contribute to
glacial cycles?
Perhaps the Milankovitch theory (summer/winter insolation)
could lead to the initial formation of ice sheets, but the Hansen
theory leads to the sudden termination.Vostok Ice Core Hansen et al. 2007. Climate change and trace gases. Phil. Trans. R. Soc. A. 1925-1954.
Question:
1. The increase in temperature in the
   Vostok ice core seems to preceed
   CO2 rise by several hundred years.
   How do you account for this? What
   does this imply about the role of
   CO2?

2. How do would you respond to a
   sceptic that uses this result to argue
   that we therefore should not be
   concerned about rising CO2 levels?
Question:

1. How do would you respond to a
   sceptic that argues that solar output
   and sunspot activity control global
   temperatures (and therefore we
   should not be concerned about rising
   CO2 levels) ?
Solar forces have affected
   the climate system

 1
     Radiative forcing (W/m2)

 0

-1

-2

-3

-4
  1900                          1950   2000
Figure SPM.2
Question:
What is the role of external forcing
 likely to be in recent warming?
Question:
1. What seasonal distribution of
insolation do you expect to lead to
onset and end of ice ages?
(e.g., warm summers & cold winters, cool summers
and warm winters, etc.)
2. Why? Propose a sequence of events
or processes that explain and support
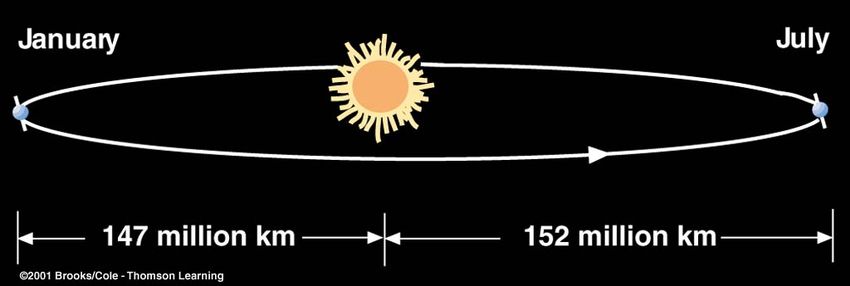
your answer to 1.Variation in Orbital Eccentricity (~100,000 year cycle)
perihelion
aphelion
http://earthobservatory.nasa.gov/Library/Giants/Milankovitch/SPM 3
External and Internal
 Drivers of Climate

External
    -Sunspot Cycles (Decades)
    -Orbital Variations (Thousands of years)
Internal
    -Plate Tectonics (Millions of years)
    -Volcanic Activity (1-3 years)
    -Albedo (All time scales)
    -Greenhouse Effect (All time scales)
What is climate ?
•Climate is average
weather
and its variability
for a particular region
over a period of time
Climate is what we expect,
weather is what we get.What is climate change?
•Climate change is a shift in climate relative to a
given reference time period
•It is caused by:
Natural factors
-Solar variability
-Volcanic dust levels
-Internal variability
-Geological change
Human factors
- Greenhouse gases
- Aerosols
-Ozone depletion
-Land use changeProxy data also indicate that the recent warming is
likely unprecedented in at least the past millennium
Source: IPCC(2001)Review
FAQ 6.1, Figure 1
What are the periodicities associated with each orbital
variation?Questions: 1. How do you expect orbital eccentricity and precision to interact to affect seasonal insolation? 2. How about obliquity and precision? 3. Under what conditions might we expect most seasonal variation in insolation?
Record of oxygen isotopes in ocean sediment over
 the last 800,000 years shows several glaciations
    (The last glaciation was 18,000 years ago)

                                      Warm (interglacial)

        Thousands of Years Ago
                                           Cold (glacial)
You can also read