Trattamento nutrizionale in geriatria
←
→
Page content transcription
If your browser does not render page correctly, please read the page content below
CORSO RESIDENZIALE
            Inquadramento e strategie terapeutiche
            dell'anziano diabetico
                                  Napoli, 24 ottobre 2017

Trattamento nutrizionale in geriatria

         Prof. Angela A. Rivellese
         Dipartimento di Medicina Clinica e Chirurgia
         Università degli Studi di Napoli ‘’ Federico II’’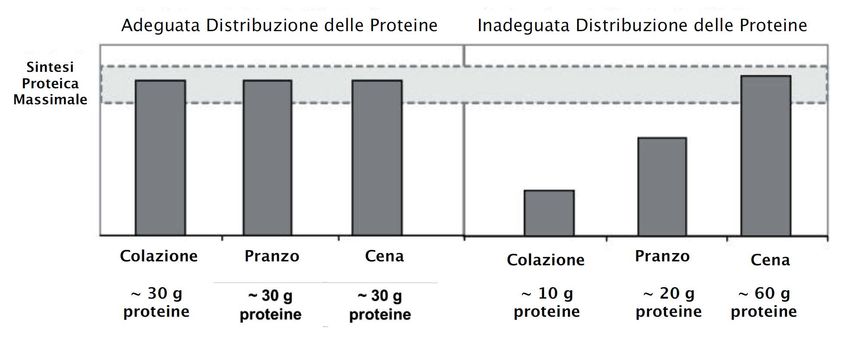
Dichiaro di aver ricevuto negli ultimi due
anni compensi o finanziamenti dalle
seguenti Aziende Farmaceutiche e/o
Diagnostiche:

- Sanofi
- GSK
- MEDTRONIC
Gestione del diabete nel paziente anziano(>75 a)

                     (Sinclair A et al. – Lancet Diabetes Endocrinol, 2015)
Agenda
La dieta nell’ anziano: apporto calorico e perdita di
peso
Fattori nutrizionali e fragilità
La dieta nell’ anziano : apporto proteico e di altri
componenti
Dieta e funzione cognitiva
Conclusioni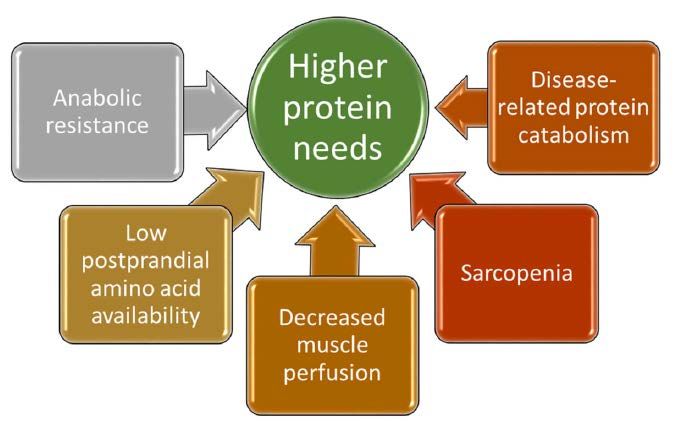
Modificazioni della composizione corporea
               e della massa muscolare nell’anziano

(modificato da Shock NW et al.,1966; Frontera W. et al.,1991)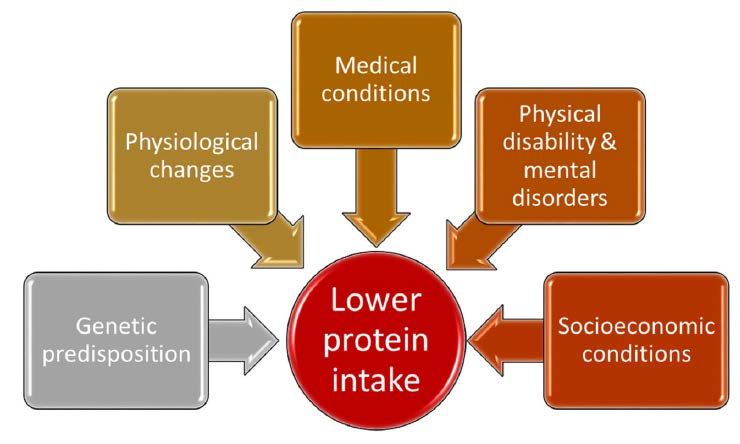
Dispendio energetico giornaliero
       in relazione all’età

                    (McGandy RB et al. – J Gerontol, 1966)
Fabbisogno energetico medio in età geriatrica
               Altezza (m)   Peso (Kg)     MB (Kcal/die)               Fabbisogno energetico (Kcal/die) per un LAF di:

   Uomini                                                       1,45              1,60                1,75               2,10

  30-59 anni      1,60         57,6            1550             2250              2480               2710                3260

                                                                1,40              1,50                1,60               1,75

  60-74 anni                                   1380             1940              2080               2220                2420

  ≥75 anni                                     1300             1820              1950               2080                2280

   Donne                                                        1,45              1,60                1,75               2,10

  30-59 anni      1,60         57,6            1330             1930              2130               2330                2790

                                                                1,40              1,50                1,60               1,75

  60-74 anni                                   1220             1700              1830               1950                2130

  ≥75 anni                                     1190             1660              1780               1900                2080

Formule per il calcolo del fabbisogno energetico:                                                                Larn 2014, SINU
Uomini                                                     Donne
30-59 anni: 11,6 x Peso Corporeo + 879 x LAF               30-59 anni: 8,7 x Peso Corporeo + 829 x LAF
60-74 anni: 11,9 x Peso Corporeo + 700 x LAF               60-74 anni: 9,2 x Peso Corporeo + 688 x LAF
≥75 anni: 8,4 x Peso Corporeo + 819 x LAF                  ≥75 anni: 9,8 x Peso Corporeo + 624 x LAF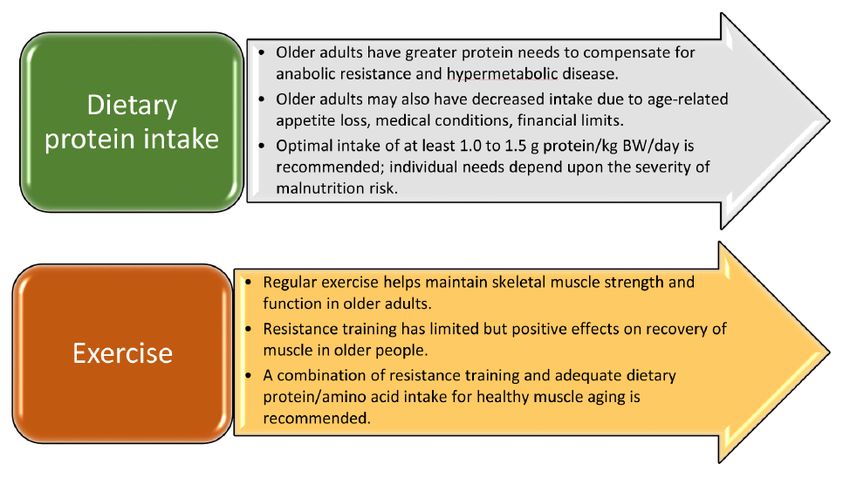
La perdita di peso intenzionale nell’
      anziano è pericolosa?
No se ottenuta in maniera adeguata

                                        (2008)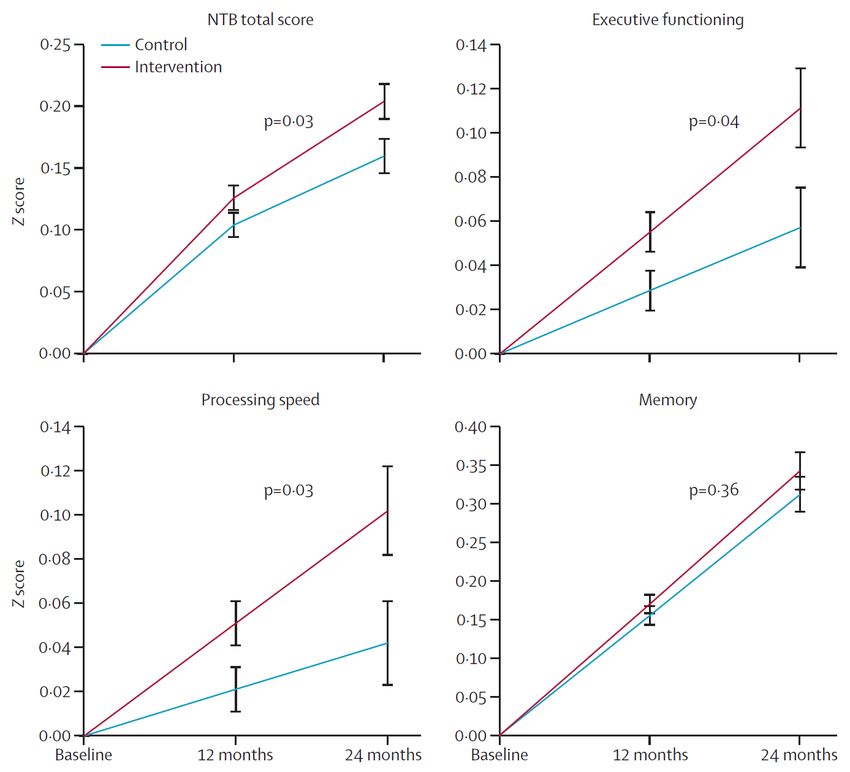
Variazione di peso, massa magra e grassa
dopo un anno di intervento in anziani fragili

                           Control   Exercise   Diet       Diet+ Exercise

   Lean body mass change      -       2% ↑      5% ↓               3% ↓
   Fat mass change            -       5% ↓      17% ↓             16% ↓
                                                        (Villareal DT et al. – N Engl J Med, 2011)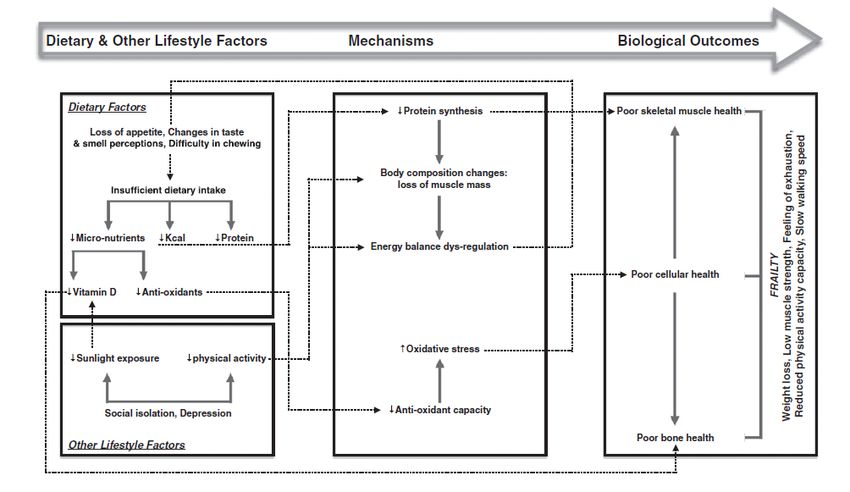
Variazione di parametri oggettivi e soggettivi
     di fragilità dopo un anno di intervento

FSQ: Functional Status Questionnaire; PPT: Physical Performance Test;
VO2peak: the peak oxygen consumption                                    (Villareal DT et al. – N Engl J Med, 2011)
Agenda
La dieta nell’ anziano: apporto calorico e perdita di
peso
Fattori nutrizionali e fragilità
La dieta nell’ anziano : apporto proteico e di altri
componenti
Dieta e funzione cognitiva
ConclusioniPatogenesi della fragilità e della sarcopenia
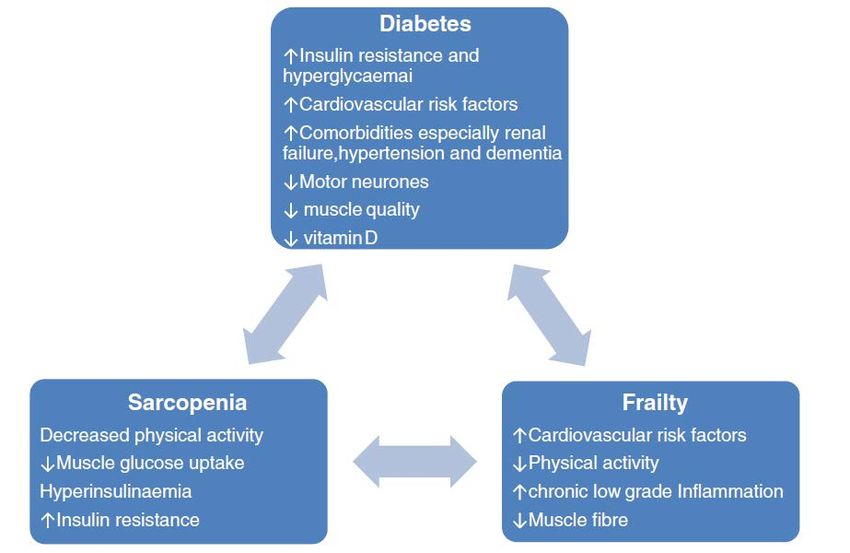
(Sinclair AJ et al. – J Diabetes Complications, 2017)Relazione tra diabete, sarcopenia e fragilità
(Sinclair AJ et al. – J Diabetes Complications, 2017)Relazione tra dieta e fragilità
(studi prospettici)
PROTEINE
Association (positive/
Outcome/ negative associations
Study Dietary Follow-up
Study Outcome refer to the direction of
population assessment period
measure the significant association
observed in each study
Houston et al. Subsample ABG Dietary protein Body composition/ 3 years Positive association between
(2008) (N = 2066, 53.2% intake estimated Lean mass and protein intake and lean mass
women) by FFQ appendicular lean and appendicular lean mass
mass was preservation.
measured by
DXA
Beasley et al. WHI; 24,417 Protein intake as Frailty/Modified 3 years Negative association between
(2010) women estimated by FFQ Frailty criteria protein consumption and
≥65 years incident frailty
Lana et al. 1871 community Diet history for Frailty/Modified 3.5 years Negative association between
(2015) dwelling milk products Fried criteria low-fat dairy products
individuals ≥60 consumption consumption and incident
years (51.5% frailty
women)
(Yannakoulia M et al. – Metabolism, 2017)Relazione tra dieta e fragilità
(studi prospettici)
MICRONUTRIENTI
Association (positive/
Outcome/ negative associations
Study Dietary Follow-up
Study Outcome refer to the direction of
population assessment period
measure the significant association
observed in each study
Semba Subsample Serum vitamins Frailty/Fried criteria Negative association between
et al. VHAS A, D, E, B6, and serum carotenoids levels and
(2006) (N = 766) B12, carotenoids, incident frailty
15
folate, zinc, and Positive association between
selenium number of micronutrient
deficiencies and risk of frailty
Semba Subsample Serum Walking speed/Time Negative association between
et al. VHAS carotenoids needed for 4-m walk 15 high oxidative stress and
(2007) (N = 545) levels walking speed
Alipanah Subsample Serum Walking speed/Walk 4- Negative association between
et al. VHAS carotenoids m course serum carotenoids and walking
(2009) (N = 687, levels speed decline
15
moderately to
severely
disabled)
Lauretani Subsample Plasma Walking disability/ Negative association between
et al. InChianti carotenoids Walking tests total plasma carotenoids and
6 years
(2008) (N = 928, level walking disability
55.7% women)
(Yannakoulia M et al. – Metabolism, 2017)Associazione tra deficit di Vitamina D e fragilità (Zhou J et al. Maturitas, 2016)
Relazione tra modelli alimentari e fragilità
                         (studi prospettici)
                                                                                                          Association (positive/
                                                          Outcome/                                        negative associations
               Study                                                          Follow-up
   Study                     Dietary assessment           Outcome                                        refer to the direction of
             population                                                        period
                                                          measure                                      the significant association
                                                                                                         observed in each study
Shikany      Subsample       FFQ                     Frailty/Fried Criteria   4.6 years        Negative association between diet quality (Diet
et al.       MrOS                                                                              Quality Index) and incident frailty
(2014)       (Ν = 5925)

Chan         Subsample Os    Dietary Quality index   Frailty/Morley et al.    4 years          Negative association between diet quality (Diet
et al.       Study           Adherence to the        Criteria                                  Quality Index) and incident frailty
(2015)       (N = 2724,      Mediterranean Diet                                                No association between Mediterranean diet and
             50.3% women)    Score                                                             frailty

Leon-Munoz   Subsample       FFQ                     Frialty/Fried Criteria   3.5 years        Negative association between adherence to a
et al.       ENRICA                                                                            prudent diet (as identified by factor analysis) and risk
(2015)       (N = 1872,                                                                        of frailty
             48.5% women)
Talegawkar   Subsample       Mediterranean Diet      Frialty/Fried Criteria   6 years          Negative association between adherence to
et al.       InChianti       Score                                                             Mediterranean diet and incident frailty
(2012)        (N = 690,
             51.7% women)
Leon-Munoz   Subsample       Mediterranean Diet      Frialty/Fried Criteria   3.5 years        Negative association between adherence to
 et al.      ENRICA          Adherence Screener,                                               Mediterranean diet and incident frailty
(2014)        (N = 815))     Mediterranean Diet
                             Score

Milaneschi   Subsample       Mediterranean Diet      Physical Performance/    9 years          Negative association between adherence to
et al.       InChianti       Score                   Short physical                            Mediterranean diet and physical and
(2011)       (N = 935,                               Performance Battery                       mobility decline
             55.6% women)
Shahar       Subsample ABC   Mediterranean Diet      Walking speed/Walk a     8 years          Negative association between adherence to
 et al.      (N = 2225,      Score                   20-m course                               Mediterranean diet and mobility decline
(2012)       50.1% women)

                                                                                          (Yannakoulia M et al. – Metabolism, 2017)
Stili di vita e fragilità : possibili meccanismi
(Yannakoulia M et al. – Metabolism, 2017)Relazione tra dieta e fragilità (RCTs)
Exercise Nutritional Intervention
Study N Outcome Results
intervention intervention period
Kim and Lee 87 community dwelling No Daily supplementation 3 months Physical The daily supplementation
(2013) frail older individuals of 400 kcal, 25 g protein, 9.4 g functioning moderately decreased
(79.3% women) essential amino acids, 400 mL progression of mobility and
water functional decline
Zak 80 frail community Yes Daily supplementation 7 weeks Muscle The role of nutrition
et al. dwelling and of 300 kcal strength supplementation was
(2009) institutionalized significant only when
individuals 60–95 years combined with resistance
(80% women) exercises
Bonnefoy 57 frail elderly Yes 400 kcal protein/ energy daily 9 months Fat free mass Dietary supplements
et al. (88% women) supplementation and muscle increased muscle power by
(2003) power 57% after a 3-month period,
but not after a 9-month
period
Hutchins-Wiese 126 postmenopausal No 2 fish oils (1.2 g EPA and DHA) 6 months Frailty/Fried Improvement in walking
et al. women criteria speed was observed after the
(2013) consumption of fish oils
Chin 139 independently Yes Daily consumption of two 17 weeks Psychological No significant improvement
et al. living, frail individuals enriched foods with vitamins D, E, well-being observed
(2002) (28.1% women) B1, B2, B6, folic acid, B12, C and
Ca, Mg, Zn, Fe, I.
Abizanda 91 frail older individuals Yes Daily intake of two bottles of 200 3 months Functional Improvement in function,
et al. (70.3% mL with 300 kcal, 20 g protein, 3 status, nutritional status, and quality
(2015) women) g fiber, 500 IU vitamin D, and 480 strength, of life
mg Ca nutritional
status, quality
of life
Rydwik 96 community dwelling Yes Dietary counseling 3 months Physical No significant improvement
et al. frail older individuals 9-month activity and observed
(2010) ≥75 years follow-up activities of
(60.4% women) daily living
(Yannakoulia M et al. – Metabolism, 2017)Agenda
La dieta nell’ anziano: apporto calorico e perdita di
peso
Fattori nutrizionali e fragilità
La dieta nell’ anziano : apporto proteico e di altri
componenti
Dieta e funzione cognitiva
ConclusioniFabbisogno proteico (Deutz NEP et al. – Clin Nutr, 2014)
Raccomandazioni per l’intake di proteine
  e esercizio fisico (adulti > 65 anni)

Recommendations
For healthy older adults, we recommend a diet that includes at
least 1.0 to 1.2 g protein/kg body weight/day.                           Pay attention
For certain older adults who have acute or chronic illnesses, 1.2           to renal
to 1.5 g protein/kg body weight/day may be indicated, with                 function!
even higher intake for individuals with severe illness or injury.
We recommend daily physical activity for all older adults, as
long as activity is possible. We also suggest resistance training,
when possible, as part of an overall fitness regimen.

                                                      (Deutz NEP et al. – Clin Nutr, 2014)
Relazione tra quantità di proteine assunte
per singolo pasto e risposta anabolica
(modificato da Paddon-Jones D et al. - Curr Opin Clin Nutr Metab Care, 2009)Nutrient composition of the habitual diet in people
with type 2 diabetes (TOSCA Study)
< 65 years ≥ 65 years
P-value
(n. 1637) (n. 931)
Energy (Kcal) 1961±684 1817±668Micronutrient composition of the habitual diet in people with type 2 diabetes.
Tosca Study
Recommended Intake* Intake in the study cohort
< 65 years ≥ 65 years
Corrected for 1000 Kcal < 65 years ≥ 65 years P-value
(n. 1637) (n. 931)
Iron (mg) 5.3 6.8±0.9 7.0±1.0Agenda
La dieta nell’ anziano: apporto calorico e perdita di
peso
Fattori nutrizionali e fragilità
La dieta nell’ anziano : apporto proteico e di altri
componenti
Dieta e funzione cognitiva
ConclusioniDieta Mediterranea e rischio di
disfunzione cognitiva moderata
(Sigh B et al. – J Alzheimers Dis, 2014)Dieta Mediterranea e rischio di Alzheimer
(Sigh B et al. – J Alzheimers Dis, 2014)Funzione cognitiva dopo Dieta Mediterranea
(Valls-Pedret C et al. – JAMA, 2015)A diet naturally-rich in polyphenols:
decreases lipid levels in the postprandial period
reduces oxidative stress (urinary isoprostanes)
improves glucose tolerance likely by increasing
- early insulin secretion (30 minutes)
- insulin-sensitivity (OGIS)
In our trial, the effect of polyphenols on clinical outcomes seem to be
related mainly to:
FLAVAN-3-OLS
FLAVANONES
FLAVONES
OXIDATIVE STRESS
and
POSTPRANDIAL GLUCOSE EARLY INSULIN
LIPID RESPONSE RESPONSE SECRETIONFunzione cognitiva dopo 8 settimane di consumo
di succo di arancia ricco o povero in flavanoni
(Kean RJ et al. – Am J Clin Nutr, 2015)Agenda
La dieta nell’ anziano: apporto calorico e perdita di
peso
Fattori nutrizionali e fragilità
La dieta nell’ anziano : apporto proteico e di altri
componenti
Dieta e funzione cognitiva
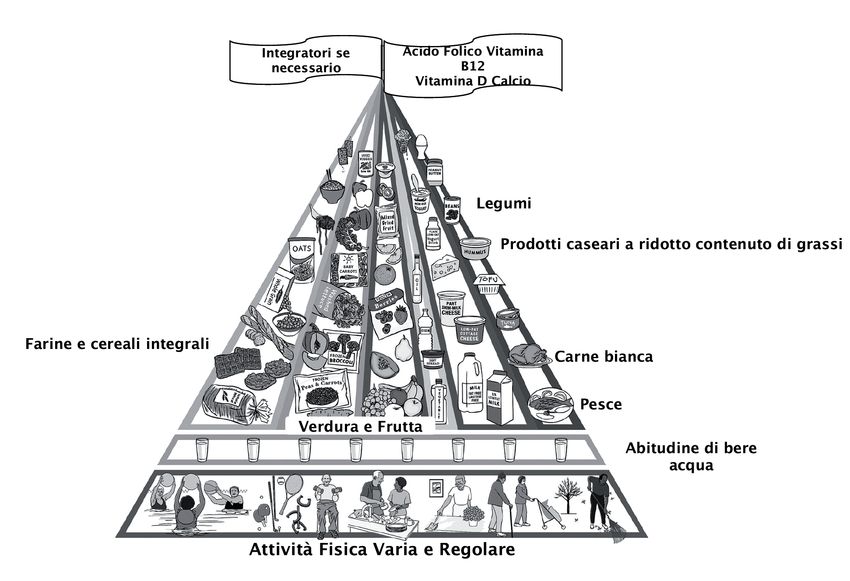
ConclusioniPiramide alimentare dell’anziano
(modificato da Lichtenstein AH et al. – J Nutr, 2008)Alimenti
La Dieta Mediterranea è caratterizzata da:
Elevato consumo di frutta, vegetali, legumi, e
carboidrati complessi
Basso consumo di carne e moderato di pesce
Basso consumo di grassi animali e zuccheri semplici
Olio d’oliva come fonte di grassi
Basso-moderato consumo di vino rosso ai pastiRaccomandazioni per il mantenimento
della massa muscolare nell’invecchiamento
(Deutz NEP et al. – Clin Nutr, 2014)Performance cognitiva dopo 2 anni di
intervento multifattoriale (FINGER study)
(Ngandu Y et al. – Lancet, 2015)You can also read