Session 3 Family Planning Indicators - James Kiarie
←
→
Page content transcription
If your browser does not render page correctly, please read the page content below
Family Planning through the lens of global strategies, measurement and
                                 human rights
                       Family Planning Indicators
                                   Session 3
                         An Online Evidence-based Course 2021

      James Kiarie MBChB, Mmed, MPH

      Department of Sexual Reproductive Health and Research
      Twitter @HRPresearch

1
Health indicators
❑      Term “indicator” derived from the Latin “indicare”,
       meaning to announce, point out or indicate.
❑      Health indicators are quantifiable characteristics of a
       population used as supporting evidence for describing
       the health of a population1
❑      Ideal health indicators:
         –      Valid: It must measure what it is supposed to measure
         –      Reliable: Same result if measured by different people
         –      Sensitive: They should show variations in different situations
         –      Specific: Changes must occur only in the situation concerned
         –      Practical/feasible: Data for the indicator readily available

       1 Health indicator. Wikipedia, 2021.
       https://en.wikipedia.org/wiki/Health_indicator#:~:text=Health%20indicators%20are%20quantifiable%20characteristics%20of%20a%2
       0population,evidence%20for%20describing%20the%20health%20of%20a%20population.
2   Twitter @HRPresearch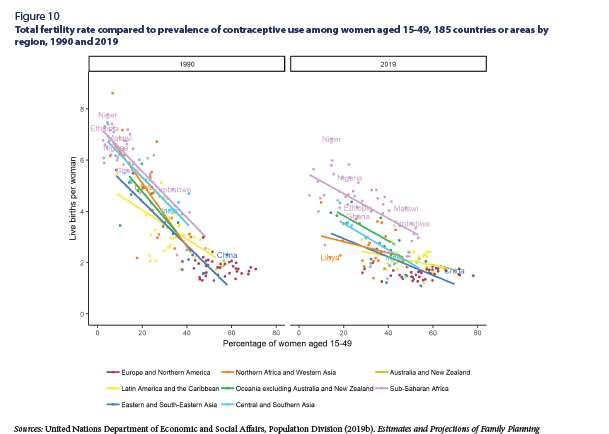
Family planning indicators
❑       The family Planning Reproductive Health Data base lists 90
        indicators including covering different aspects such as source of
        supply, method type, integration with other services, counseling
        and information, continuation and discontinuation, fertility,
        pregnancy spacing and timing1

❑       FP included in 3 SDG indicators
          – Indicator 3.7.1: Demand satisfied with modern methods
          – Indicator 5.6.2: Number of countries with laws and regulations that
            guarantee full and equal access to women and men aged 15 years and
            older to sexual and reproductive health care, information and education
          – Indicator 5.6.1: Women’s ability to make their own informed decisions
            about their sexual and reproductive health
❑       FP2020’s 18 Core Indicators based on a results chain measuring
                 Enabling       Process of                                                  Impact of
                                                     Output of          Expected
               environment      delivering                                                contraceptive
                                                      services          outcomes
                  for FP         services                                                      use

     1 Measure Evaluation: Family Planning and Reproductive Health Indicators Database.
     https://www.data4impactproject.org/prh-family-planning-and-reproductive-health-indicators-database/
3   Twitter @HRPresearch
At what level do family planning indicators measure
• CONTRACEPTIVE USE
• FERTILITY
Individual • MATERNAL AND CHILD
interpersonal HEALTH
• FP SUPPLIES
• EQUITY
Health system and • ACCESS
community • SERVICE PROVISION
• DEMAND
• POLICIES,
Enabling environment • FINANCING
• PROGRAMS
4 Twitter @HRPresearchCommon enabling environment indicators
❑ Domestic government family planning expenditures
❑ Donor expenditures on family planning
❑ Laws and regulations that guarantee full access to
family planning services
❑ Evidence that preservice and/or in service curricula
includes postpartum postpartum family planning
5 Twitter @HRPresearchCommon health system / community indicators
❑ Stock outs: Percentage of facilities stocked out, by method offered,
on the day of assessment.
❑ Method availability: Percentage of primary SDPs that have at least
3 modern methods of contraception available on day of
assessment.
❑ CYP: Couple-Years of Protection.
❑ Method Information index: An index measuring the extent to
which women were given specific information when they received
family planning services.
❑ Unmet need: Percentage of women with an unmet need for
modern methods of contraception.
❑ Number or percent of service delivery points which offer a range
of appropriate contraceptive options for postpartum women.
❑ Percent of postpartum women with unmet need for contraception.
6 Twitter @HRPresearchCommon individual level indicators
❑ mCPR: Modern contraceptive prevalence rate Percentage
of women using a modern method of contraception.
❑ Demand Satisfied: Percentage of women whose demand is
satisfied with a modern method of contraception.
❑ Discontinuation & Method Switching: 12-month
contraceptive discontinuation and switching rate.
❑ Method Mix: Percentage of women using each modern
method of contraception.
❑ Unintended Pregnancies: Number of unintended
pregnancies.
❑ Number or percent of maternal and child health services
clients who received counseling about LAM.
7 Twitter @HRPresearchSources of data
❑ Population surveys such as the Demographic Health
survey (DHS), PMA2020 surveys, Reproductive Health
Survey (RHS), Multiple Indicator Cluster Surveys
(MICS) and other nationally representative surveys
❑ Service Provision Assessment (SPA) Surveys
❑ Service statistics
❑ Logistic reports
❑ Financial tracking such as the WHO Commission on
Information and Accountability and the UNFPA-NIDI
FP resource flows survey
8 Twitter @HRPresearchUnderstanding specific FP indicators
❑ CPR
❑ Demand Satisfied
❑ Unmet need
9 Twitter @HRPresearchContraceptive prevalence rate
❑ The percentage of women who are using (or whose
partner is using) a contraceptive method at a particular
point in time.
❑ Numerator can include:
– All methods
– Modern methods
❑ The denominator used can be:
– All reproductive age (15-49 years) women
– All women in union (married)
❑ Can be disaggregated by wealth quintile, age,
urban/rural, ethnicity
10 Twitter @HRPresearchUnmet need
❑ The percentage of fecund women of reproductive age who
want no more children or to postpone having the next child
but are not using a contraceptive method.
❑ Women using a traditional method are assumed to have an
unmet need for modern contraception.
❑ Women who are pregnant or less than six months
postpartum who did not intend to become pregnant at the
time they conceived and were not using a contraceptive
method are assumed to have an unmet need for modern
contraception.
❑ Though the concept seems straightforward, the calculation is
extraordinarily complex. In DHS, its calculation is based on
answers to 15 questions
11 Twitter @HRPresearchDemand satisfied
The percentage of fecund women of reproductive age who want
no more children or to postpone having the next child, and are
currently using a contraceptive method
Related to CPR and
Unmet need
12 Twitter @HRPresearchUsing FP indicators in decision making
❑ The S Curve
❑ Contraceptive prevalence and fertility
❑ The demand curve
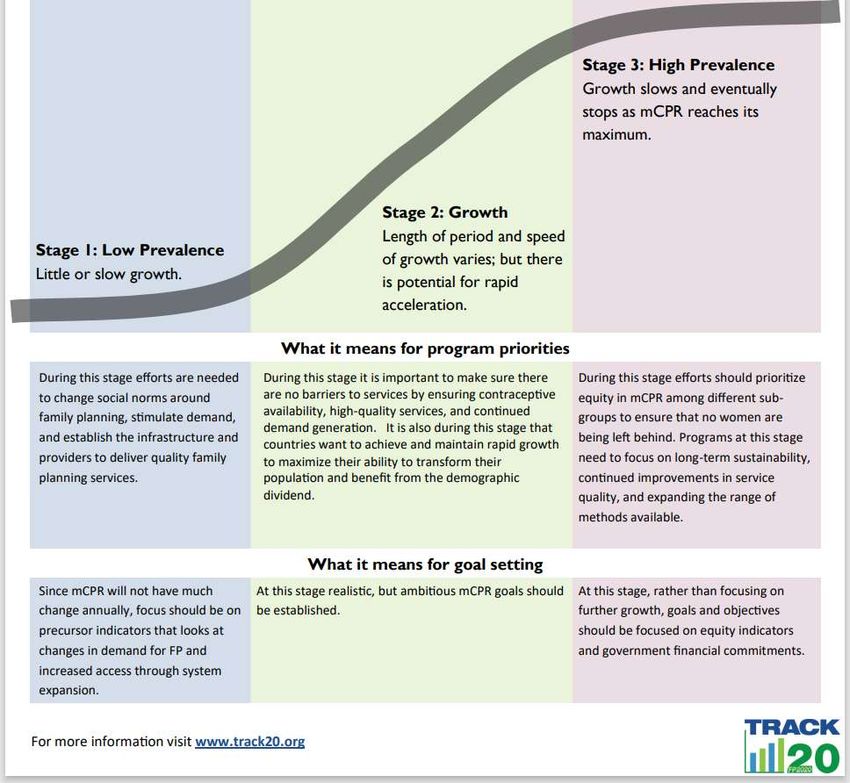
13 Twitter @HRPresearchThe S Curve Historical data shows us that modern contraceptive prevalence (mCPR) grows in an S-shaped pattern. Understanding this concept can assist in: Identifying program priorities Setting realistic targets for growth and contraceptive prevalence goals Maximizing the potential of obtaining the demographic dividend 14 Twitter @HRPresearch
Contraceptive prevalence and fertility

                              B       D   C

                                  A

                                              B

                          A
                          B
                          C
15   Twitter @HRPresearch
                          D
The
demand Kenya
curve Nepal
Cambodia
http://www.track2
0.org/pages/data_
analysis/publicatio
ns/special_topics/
demand_curve.ph
p
Niger
Chad
❑ The curve represents the likely maximum mCPR that could be reached in a country given their level of demand.
❑ Where gap is small or modest (orange or yellow dot), growth in mCPR may be limited without further changes
in demand. Need to prioritize interventions that address underlying social norms orset realistic expectations
about future growth.
❑ Where the gap is large (green dot), likely room for further mCPR growth from investments to improve and
expand family planning service delivery. Demand less likely to be a constraint.
❑ Concept is not applicable where mean ideal number of children is low (grey dot).
16 Twitter @HRPresearchConclusions
❑ Family planning indicators are important health
indicators
❑ The indicators vary widely globally and even within
countries
❑ Measurement of FP indicators is complex and uses
various data sources
❑ FP indicators have important applications for policy
and management planning
17 Twitter @HRPresearchReadings and videos
❑ Read the Family Planning and the 2030 Agenda for
Sustainable Development Data Booklet
https://www.un.org/en/development/desa/population/publications/pdf/family/familyPlanning_DataBooklet_2019.pdf
❑ Listen to the FP2030 Data Webinar: Advancing the
Family Planning Measurement Agenda from 11.30
minutes to 30.20 minutes.
https://www.youtube.com/watch?v=TSuRyETYB_c
❑ If you have questions discuss with your coach and
submit any that you would like discussed in the
webinar.
18 Twitter @HRPresearchThank you
Follow us on Twitter @HRPresearch
Website who.int/reproductivehealth
19You can also read