Downwind of the Flames: NASA Applied Science
←
→
Page content transcription
If your browser does not render page correctly, please read the page content below
Downwind of the Flames:
                Assessing and Predicting
         Wildfire Smoke Related Morbidity
  Using Satellites, In-Situ Measurements, and Models

                        Jeff Pierce
Sheryl Magzamen, Emily Fischer, John Volckens, Gabriele Pfister
     Bonne Ford, Ryan Gan, Will Lassman, Katelyn O’Dell

           This work is funded by NASA project number NNX15AG35G.   1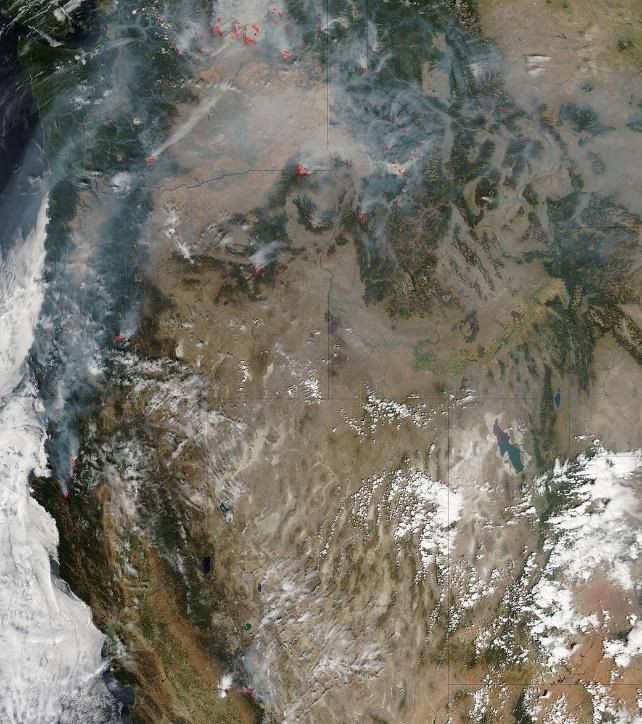
Project Overview
Objectives:
1: Estimate the respiratory and cardiovascular health risks for specific
demographic populations exposed to wildfire PM.

2: Evaluate and develop forecast tools that predict wildfire PM
concentrations, population exposure, and the potential increased morbidity
due to wildfire smoke.

Team:
CSU Atmospheric Science: Jeff Pierce, Emily Fischer, Bonne Ford,
                         Katelyn O’Dell
CSU Mechanical Engineering: John Volckens
CSU Environmental Health: Sheryl Magzamen, Ryan Gan
NCAR: Gabriele Pfister

                                                                             2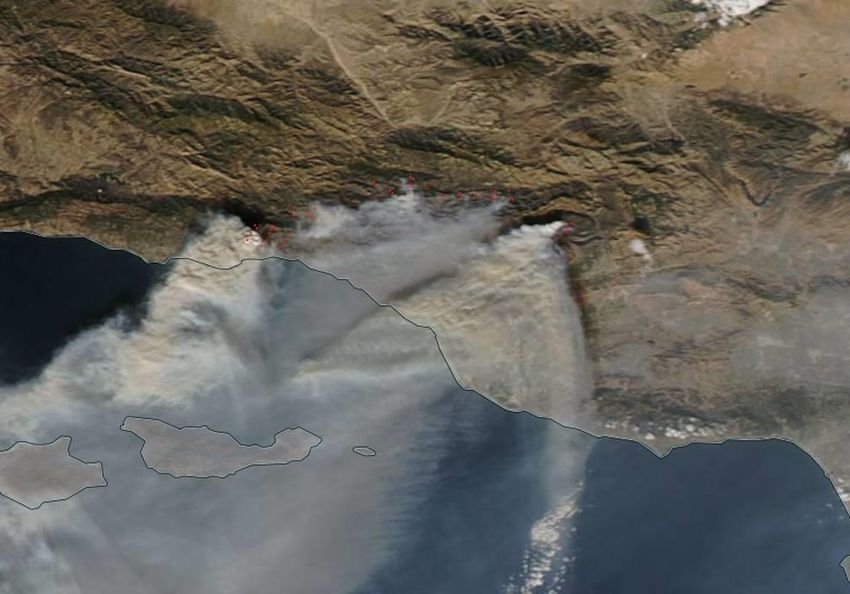
Role of wildfire emissions in air quality
 is increasing
Anthropogenic Emissions have decreased

                               epa.gov

                                         3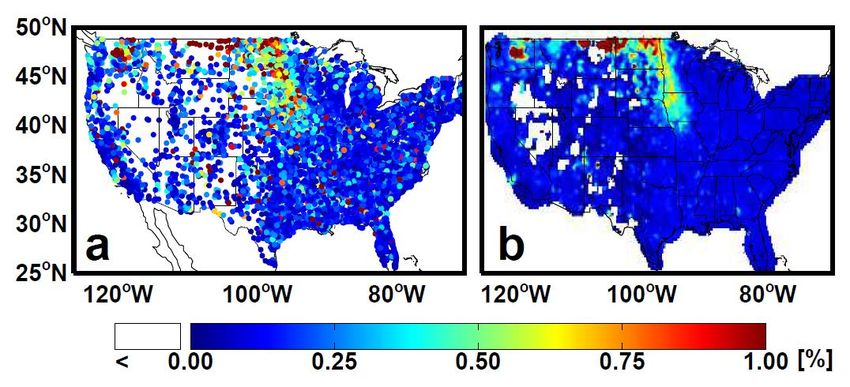
Role of wildfire emissions in air quality
 is increasing
Anthropogenic Emissions have decreased

                                               epa.gov

Wildfire Frequency has increased
   western U.S. forest wildfires and spring-summer
   temperature

                                           Westerling et al., 2016   4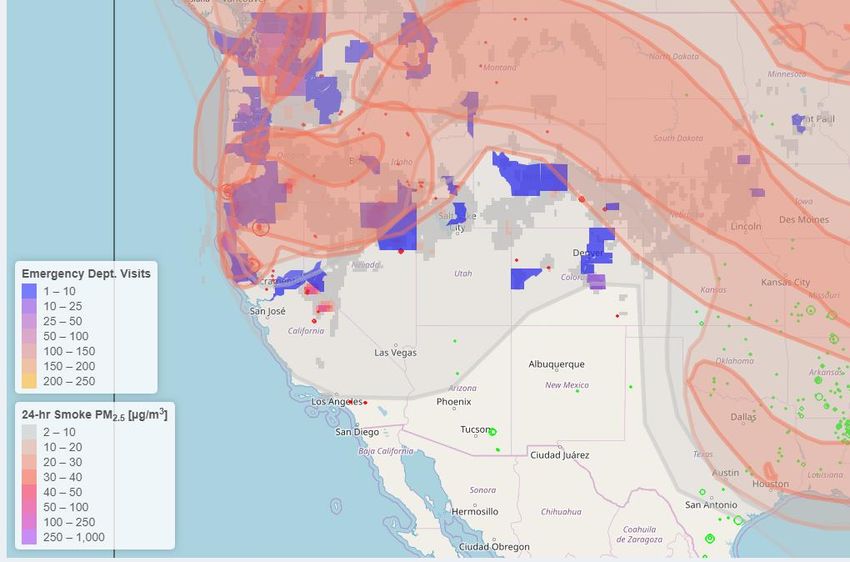
Role of wildfire emissions in air quality
 is increasing
Anthropogenic Emissions have decreased

                                                                     Large portions of the US
                                                                     experience smoke

                                               epa.gov

Wildfire Frequency has increased
   western U.S. forest wildfires and spring-summer
   temperature

                                           Westerling et al., 2016                              5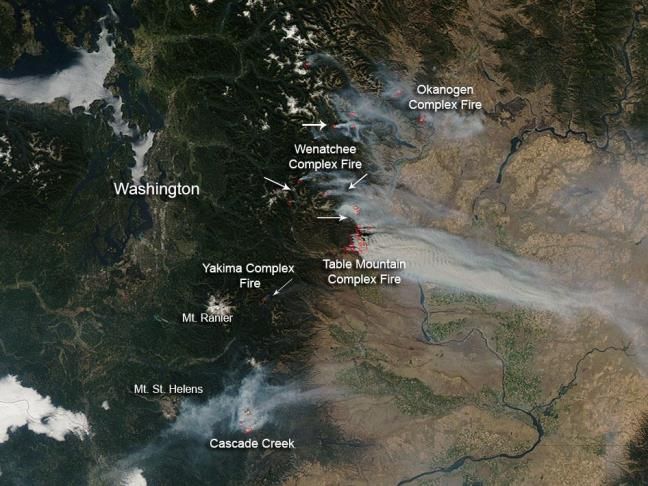
PM2.5 is not improving in the summer
in much of the west

   Summer PM2.5 trends from 2006-2016 (O’Dell et al., 2018)   6
Using satellites, we can split this trend into
   smoke and non-smoke trends (2006-2016)

       Split using Hazard Mapping System smoke product with information from NASA and
       NOAA satellites.

                                                                                        7
(O’Dell et al., 2018)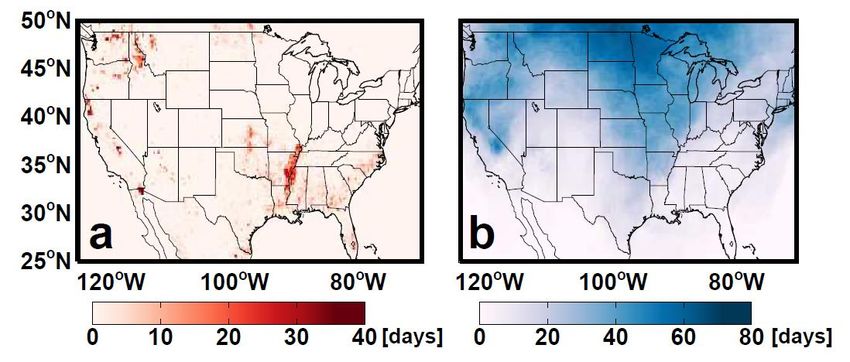
Using satellites, we can split this trend into
   smoke and non-smoke trends (2006-2016)

                                                    8
(O’Dell et al., 2018)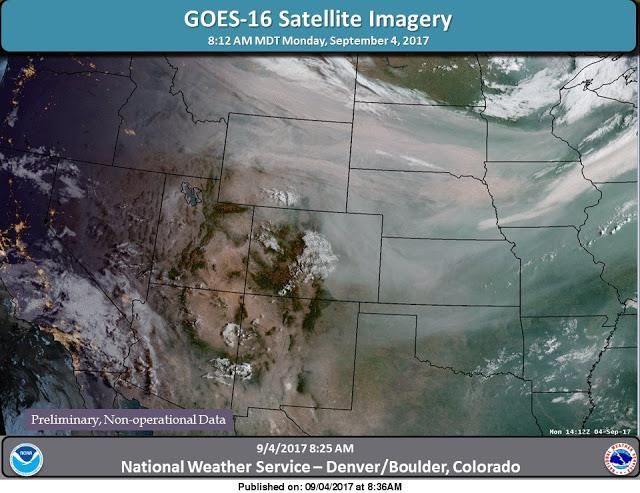
Using an Earth System Model, we predict smoke to
continue to offset improvements in anthropogenic
emissions

                     PM2.5 [μg m-3]

Ford et al. (2018)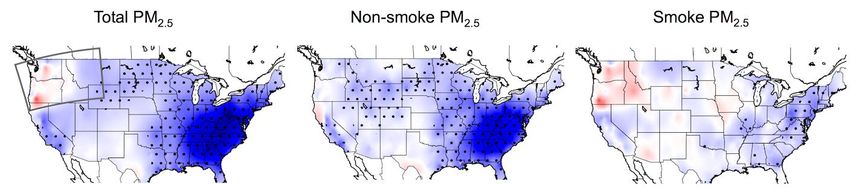
What risk does this wildfire smoke
exposure pose to the population?
The answer to this question will help public
  health agencies better inform the public

                                               10
What risk does this wildfire smoke
exposure pose to the population?
The answer to this question will help public
health agencies better inform the public
But means that we need to know:
where, when, who, and what? 11Project Overview
12Objective 1: Health risks
13Fire seasons and locations
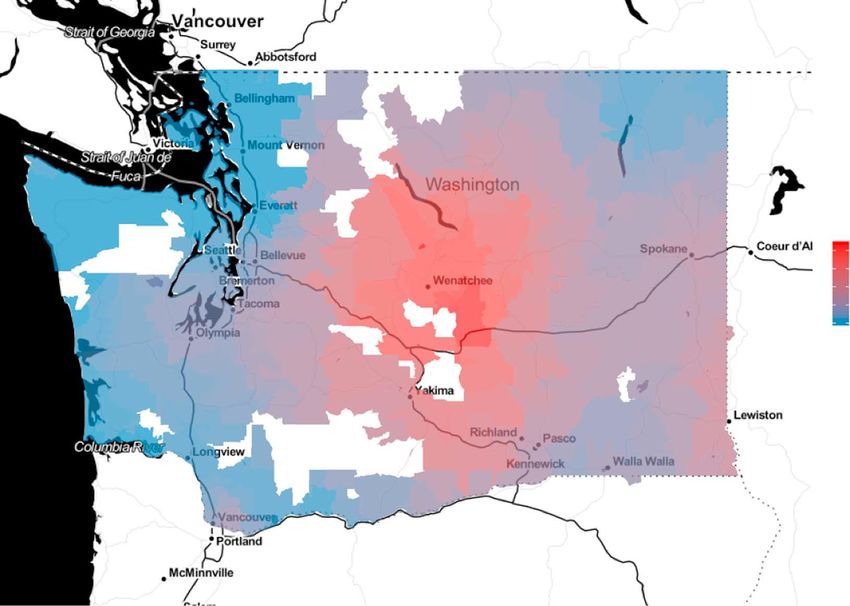
Washington 2012:
Western US 2015:
# Days
NASA image courtesy LANCE/EOSDIS MODIS
Rapid Response Team, GSFC
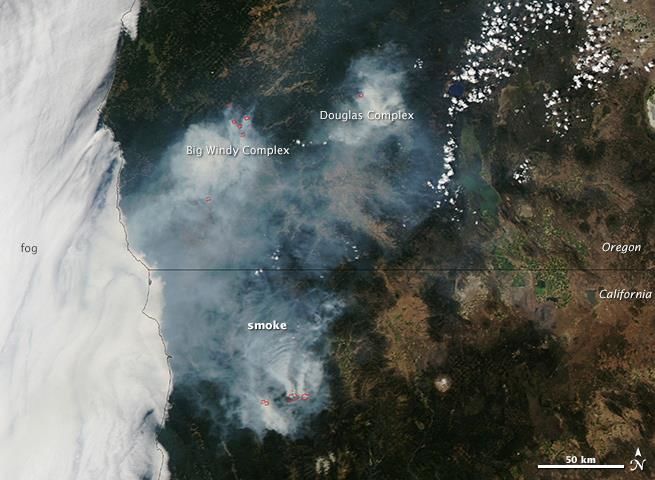
Oregon 2013:
Colorado 2012:
# smoke days NASA images courtesy LANCE/EOSDIS
14
NASA image courtesy LANCE/EOSDIS MODIS
Rapid Response Team, GSFCWe model wildfire smoke PM2.5 using
geographically weighted regression
MODIS AOD WRF-Chem PM2.5 Surface Monitors
GWR PM2.5
15
(Methods described in Lassman et al., 2017)Method to Assess Relationship Between
Wildfire Smoke and Health Outcome
Blended wildfire smoke PM2.5 concentrations
Join smoke estimates to health data
Assess relationship using case-crossover study design
16Consistent relationship between smoke and
asthma, but no observed association with
cardiovascular outcomes
Respiratory Outcomes Cardiovascular Outcomes
10 µg m-3 PM 2.5 increase
Odds Ratio
17
Gan et al. (2017, 2018)Odds Ratio
10 µg m-3 PM 2.5 increase
How do we translate this risk?
18Objective 2: Forecast tool
19Health Forecast Tool
20
rgan.atmos.colostate.edu/smoke_forecaster/ as well as CDC smoke-health forecast toolHealth Forecast Tool
Have partnered with Communications
researchers at CSU and they are testing with
the Colorado Department of Public Health and
the Environment
Continued work with Rish at CDC
21
rgan.atmos.colostate.edu/smoke_forecaster/ as well as CDC smoke-health forecast toolGoals for remainder of grant
● Test/implement app with CDPHE
and continue work with CDC
● Finish Colorado 2012 and 2015 analysis
● Comparing concentration-response functions assigned using
address, ZIP-code, and county (estimating smoke exposure at
different grid resolutions).
● A multi-state and year investigation of wildfire smoke on
morbidity and mortality (with CDC)
● Using distributed lag models
● Exposure estimates for western US and individual states
22Papers
Gan, R. W., B. Ford, W. Lassman, G. Pfister, A. Vaidyanathan, E. Fischer, J. Volckens, J. R. Pierce, S. Magzamen
(2017): Comparison of wildfire smoke estimation methods and associations with cardiopulmonary-related
hospital admissions, GeoHealth, 1, doi:10.1002/2017GH000073.
Lassman, W., B. Ford , R. W. Gan, G. Pfister, S. Magzamen, E. V. Fischer, and J. R. Pierce (2017): Spatial and
Temporal Estimates of Population Exposure to Wildfire Smoke during the Washington State 2012 Wildfire
Season Using Blended Model, Satellite, and In-Situ Data, GeoHealth, 1, doi: 10.1002/2017GH000049.
Ford, B., M. Burke, W. Lassman, G. Pfister, and J. R. Pierce: Status Update: Is smoke on your mind? Using social
media to assess smoke exposure, Atmos. Chem. Phys., doi:10.5194/acp-17-7451-2017, 17, 7541-7554,
2017.
Ford, B., M. Val Martin, S. E. Zelasky, E. V. Fischer, S. C. Anenberg, C. L. Heald, J. R. Pierce: Future Fire Impacts
on Smoke Concentrations, Visibility, and Health in the Contiguous United States, GeoHealth,
https://doi.org/10.1029/2018GH000144, 2018
Pratt, J. R., R. W. Gan, B. Ford, S. Brey, J. R. Pierce, E. V. Fischer, S. Magzamen: A National Burden Assessment
of Estimated Pediatric Asthma Emergency Department Visits that May be Attributed to Elevated Ozone
Levels Associated with the Presence of Smoke, Env. Mon. Assess., in press, 2018.
O’Dell, K., B. Ford, E.V. Fischer, J.R. Pierce: Wildfires and Summer PM2.5 Trends in the United States, submitted
to Env. Sci. Tech., 2018.
Gan, R.W., J. Liu, B. Ford, K. O’Dell, A. Vaidyanathan, A. Wilson, J. Volckens, G. Pfister, E. V. Fischer, J.R. Pierce,
S. Magzamen: The association between wildfire smoke exposure and asthma-specific medical care
utilization following the 2013 Douglas Complex fire in Oregon, submit within several weeks to Env. Health
Perspectives, 2018
23ARL Review
Starting ARL: 2
Current ARL: 8 (Objective 1), 7 (Objective 2)
Projected Ending: 8
ARL 7 –Application Prototype in Partner’s Decision Making
24Extra slides
25Health Outcomes
Hospital claims data from the Washington State Comprehensive
Hospital Abstract Reporting System (CHARS) for the year of
2012; hospital claims only
All payers all claims (APAC) data from the Oregon Health
Authority (OHA) for the year of 2013; any filed claim (including
hospital claims) and pharmacy claims
Hospital claims data from the Colorado Hospital Association
(CHA) for the years 2011 to 2015; hospital claims only
26Exposure to wildfire smoke can be
difficult to assess
# Days with a Fire Reported*
June – September 2017
*using HMS
products
27Exposure to wildfire smoke can be
difficult to assess
# Days with a Fire Reported* # Days with Smoke*
June – September 2017 June – September 2017
*using HMS
products
28Exposure to wildfire smoke can be
difficult to assess
# Days with a Fire Reported* # Days with Smoke*
June – September 2017 June – September 2017
*using HMS
products
Smoke events are episodic,
maybe of short duration,
have varying magnitude and
may impact a small
population
29Team Goals:
1. Produce accurate smoke 10 µg m-3
50 µg m-3
exposure data for several 100 µg m-3
different wildfires
2. Determine health effects
specific to (short-term)
smoke exposure
30Team Goals:
1. Produce accurate smoke 10 µg m-3
50 µg m-3
exposure data for several 100 µg m-3
different wildfires
2. Determine health effects
specific to (short-term)
smoke exposure
Methods:
Estimate wildfire smoke PM2.5 concentrations
Use smoke estimates with hospital/health claims data
Assess relationship using case-crossover study design
31We combine information from different
tools to determine smoke concentrations
In-situ monitors Chemical Transport Model
Satellite observations % of Facebook posts (only for 2015/2016)
32We combine information using
Geographically Weighed Regression
33Consistent relationship between smoke and
asthma, but no observed association with
cardiovascular outcomes
Respiratory Outcomes Cardiovascular Outcomes
10 µg m-3 PM 2.5 increase
Odds Ratio
34Results for Washington 2012 and
Oregon 2013
Washington 2012 Oregon 2013
10 µg m-3 increase 10 µg m-3 increase
Health Outcome Odds Ratio 95% CI Odds Ratio 95% CI
All Respiratory 1.05 1.03-1.08 1.01 0.98-1.03
Asthma 1.08 1.02-1.14 1.09 1.04-1.14
Cardiovascular
1.00 0.98-1.03 0.99 0.97-1.02
Disease
Heart Failure 1.02 0.96 – 1.07 1.05 0.97-1.13
Respiratory
-- -- 1.08 1.07-1.09
Rescue Medication
35You can also read