Oxford City District Summary 2020 - Published July 2020 - Oxfordshire Insight
←
→
Page content transcription
If your browser does not render page correctly, please read the page content below
Oxford City
                               District Summary
                                      2020
                                  Published July 2020
Oxford City District Summary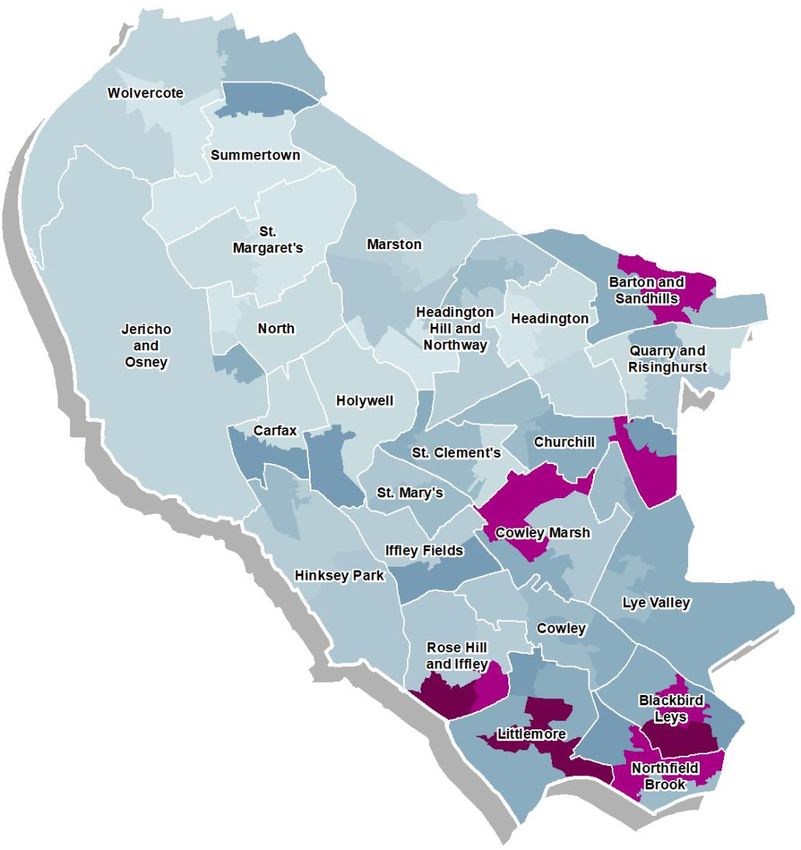
2
Introduction to the District Summary for Oxford City
This is a summary report for Oxford City and includes the following key areas
highlighted in the JSNA 2020 Oxfordshire report:
Historical and projected population change
Public Health England 2020 health summary
Key health and wellbeing facts and figures 2020
A district inequalities summary (tartan rug)
Indices of Multiple Deprivation 2019
Other resources include:
JSNA 2020 Oxfordshire report
Oxford City District Summary
Public Health Dashboards
Health Needs Assessments
Community Health and Wellbeing Profiles
JSNA Bitesize EMAIL: JSNA@Oxfordshire.gov.uk
WEB: insight.oxfordshire.gov.uk/jsna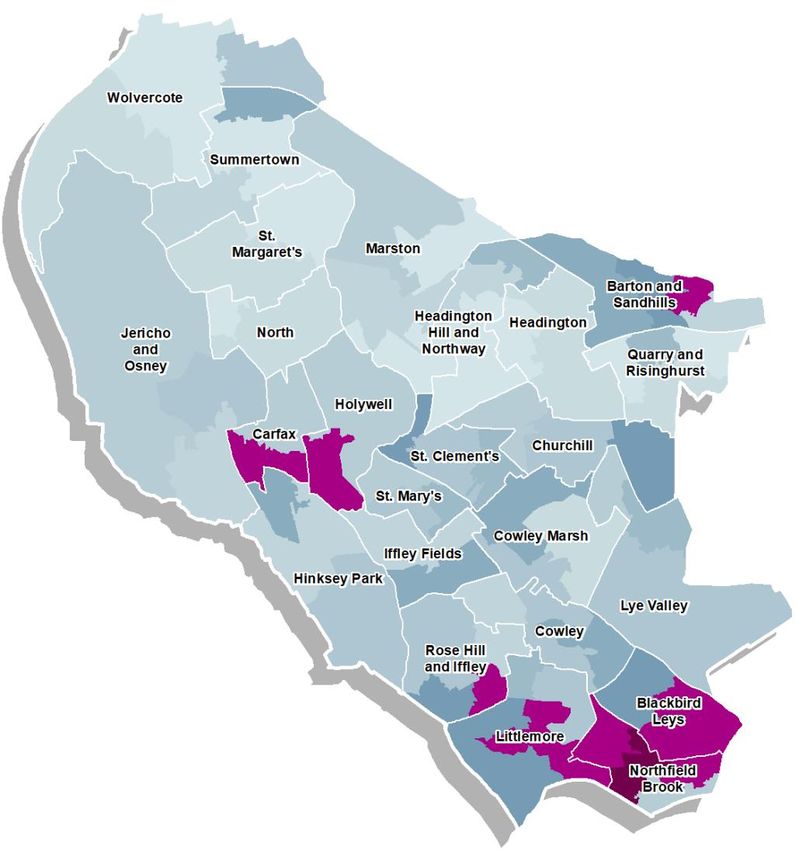
3
Oxford City Population
Historical population change 2008 to 2018
In mid-2018 there were
154,300 residents in Oxford Female 2008 Male 2008
City. 85+
80-84
There were 2,900 people 75-79
aged 85+ in Oxford 70-74
65-69
60-64
Between 2008 and 2018 the 55-59
population increased by 50-54
45-49
+7%, just below 40-44
Oxfordshire (+8%) and 35-39
30-34
England (+8%). 25-29
20-24
The population pyramid 15-19
shows females and males 10-14
5-9
by 5-year age and a slight
Oxford City District Summary
0-4
increase in the younger 15,000 10,000 5,000 0 5,000 10,000 15,000
segment of the population Female 2018 Male 2018
ages 5-9, 10-14 and 15-19.
Source: ONS mid-2018 population estimates released June
2019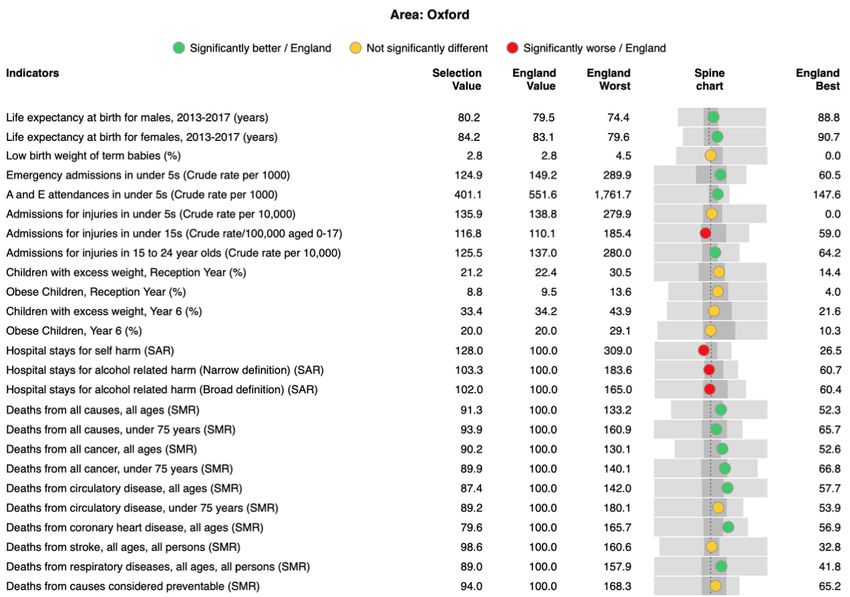
4
Population Forecast
The housing-led forecasts 200,000
Oxford by broad age (10 year forecast)
show the population of Oxford
180,000
increasing from 159,600 in
160,000 age 65+
2017 to 176,200 by 2027
(+16,600, +10%). 140,000
120,000
The biggest population 100,000 age 18-64
increase is predicted in the
80,000
15-19 (+20.4%) and 35-
60,000
39(+31.8%) years olds
40,000 age 0-17
segments.
20,000
Major housing development -
sites are Barton Park and the
Northern Gateway (near
Oxford City District Summary
Wolvercote).
Source: JSNA Bitesize Oxfordshire’s Population Forecasts5
Health Summary for
Oxford City
The Public Health
England local health
profile for Oxford
shows that though
there are many
indicators similar or
better than the
national average,
there is a number
that are
significantly worse
Indicators that are
worse than average
are hospital stays
for self-harm,
estimated diabetes
diagnosis rate,
alcohol-specific
hospital stays,
GCESs achieved,
Oxford City District Summary
new cases of
sexually transmitted
infections, and new
cases of
tuberculosis
Source: PHE, Local Health – Public Health England6
Oxford City 2020 health and wellbeing facts and figures 2020
PRIMARY
7.5% 1,622 154,300 EARLY
PRE-BIRTH% BIRTH 16.2% SCHOOL
YEARS
Mothers Babies Oxford Children living in
smoking at birth born population low income families
476 45 30 59 SECONDARY 407 240
SCHOOL
15-24s diagnosed Under 18s hospital Under 18 Not in education, Year 6 children Reception children
with Chlamydia admissions for conceptions employment or overweight or obese overweight or obese
alcohol (3 years) training
WORKING
2,015 £494,985 £29,818 £35,295 2,800 43
AGE
Apprenticeship Average Average Average Adults are Killed or seriously
participants house price female salary male salary unemployed injured on roads
325 3,229 15,757 75.8% 2,280 53.8% 10,320 118
Alcohol hospital Adults with Adults Adults are Adults have chronic Adults Adults Homeless households
admissions coronary heart diagnosed with physically obstructive pulmonary overweight smoke in priority need
aged 40-64 disease depression active disease or obese
32 726 18,851 25 1,245 3,270 6,946 6,984
Deaths from Deaths from Adults with long- Deaths from New Sexually Occurrences of Households in Adults with
Oxford City District Summary
suicide (3 years) cancer (3 years) term illness or drug misuse Transmitted domestic fuel poverty diabetes
disability (3 years) Infections abuse
END OF OLDER
LIFE 62.7% 84.5 80.2 1,008 2,327 495 PEOPLE 11,725
Died at Average Average Adults with People had a Hospital Unpaid
home female life male life dementia stroke admissions due carers
expectancy expectancy to falls
Updated June 2020
http://insight.oxfordshire.gov.uk/cms/joint-strategic-needs-assessment Icons designed by Freepik from Flaticon7
Oxford inequalities Significantly worse than
Headington Hill and Northway
Oxfordshire or England
summary Statistically similar to
Quarry and Risinghurst
Barton and Sandhills
Oxfordshire or England
Rose Hill and Iffley
Jericho and Osney
Northfield Brook
Significantly better than
Blackbird Leys
Cowley Marsh
In Oxford, wards with the most
Summertown
Hinksey Park
St Margaret's
St Clement's
Iffley Fields
Oxfordshire or England
Headington
Wolvercote
Littlemore
Lye Valley
indicators worse than
Churchill
Holywell
St Mary's
Marston
Cowley
Carfax
North
Oxfordshire or England are
Blackbird Leys, Northfield Life expectancy at birth (Males) 2 3 3 3 2 2 3 2 2 0 3 2 3 2 1 1 3 2 2 2 1 3 2 2
Brook, Barton and Sandhills, Life expectancy at birth (Females) 3 3 2 2 2 2 2 2 2 2 2 2 2 2 2 2 3 2 2 2 1 2 1 1
Healthy life expectancy at birth (Males) 3 3 3 3 3 3 2 2 3 3 3 2 3 3 2 1 3 2 3 3 1 3 2 2
and Littlemore. Except Healthy life expectancy at birth (Females) 3 3 3 3 3 3 2 2 2 3 2 2 3 3 2 1 3 2 3 3 1 3 1 1
Littlemore, these wards have Disability-free life expectancy at birth (Males) 3 3 3 3 3 3 2 2 3 3 3 2 3 3 2 1 3 2 3 3 1 3 2 2
no indicators significantly Disability-free life expectancy at birth (Females) 3 3 3 3 3 3 3 2 2 3 3 2 3 3 2 1 3 3 3 3 1 3 1 1
3 3 2 3 3 3 1 3 2 3 3 1 3 3 2 1 3 1 3 3 1 3 1 1
better than average Income deprivation affecting children
Income deprivation 3 3 1 3 3 3 1 2 3 3 3 1 3 3 2 1 3 2 3 3 1 3 1 1
Child development at age 5 years 2 2 2 3 2 2 2 2 2 2 2 2 2 3 2 2 3 2 2 2 2 2 2 2
Six out of twenty-four wards Hospital admissions for injury, ages 0-4 years 2 2 2 2 2 2 2 2 2 2 2 2 3 2 2 2 2 2 2 2 2 2 2 2
have no indicators worse than Emergency hospital admissions, ages 0-4 years 2 2 2 2 2 2 2 2 1 2 2 1 3 2 2 2 2 2 3 2 2 2 2 2
average: Jericho and Osney; Obesity: Reception year 3 3 0 2 3 2 2 2 2 0 2 2 2 2 2 0 3 2 3 2 0 2 2 2
3 3 2 2 2 3 2 2 2 2 0 2 3 3 2 2 3 2 3 2 0 2 2 2
Marston; North; St. Margaret's; Obesity: Year 6
Hospital admissions for injury, ages 0-14 years 3 2 2 3 2 2 2 2 2 2 2 2 3 2 2 2 2 2 2 2 2 2 2 2
Summertown; and Wolvercote Hospital admissions for injury, ages 15-24 years 3 3 1 2 2 2 1 1 2 1 2 1 3 2 2 1 3 2 3 1 1 1 2 2
Hospital admissions for self-harm 3 3 2 3 2 2 1 2 2 2 3 1 3 2 2 2 3 2 3 2 1 2 2 2
The indicators with the most Hospital admissions for alcohol-attributable conditions 3 3 3 3 2 3 1 1 2 3 3 1 3 3 1 2 3 1 3 2 1 2 1 1
wards worse than average are Emergency hospital admissions for COPD 3 3 2 3 2 3 2 2 1 2 2 1 3 3 1 1 3 1 3 2 1 2 1 1
Emergency hospital admissions for CHD 2 3 2 2 2 2 1 1 2 2 2 2 2 2 2 1 2 2 2 2 1 2 1 1
health state life expectancies Emergency hospital admissions for Stroke 2 3 2 2 2 2 2 2 2 2 2 1 2 2 1 2 2 2 2 2 1 2 2 1
and deprivation indicators
Oxford City District Summary
Emergency hospital admissions for heart attack (MI) 2 3 2 2 2 2 2 2 2 2 2 1 2 2 2 2 3 2 2 2 1 2 1 1
Emergency hospital admissions for hip fracture, over 65s 2 3 2 3 2 2 2 2 2 2 2 2 2 2 2 2 3 2 2 2 2 2 1 1
All cancer incidence (new cases of cancer) 2 2 2 2 2 2 2 2 2 2 2 2 2 2 2 2 2 2 2 2 2 2 2 2
Data are shown at ward level for ward boundaries in Deaths from all cancers, age under 75 years 2 2 2 2 2 2 2 2 2 2 2 2 2 2 1 1 2 2 2 2 2 2 1 2
place in 2016. Health state life expectancy indicators Deaths from circulatory disease, age under 75 years 2 2 2 2 2 2 2 2 2 2 2 2 2 2 2 2 2 2 2 2 1 2 1 2
use ward boundaries in place prior to 2016 which may Deaths from respiratory diseases 3 3 1 1 1 1 1 1 2 1 1 1 1 1 2 2 3 1 1 1 2 1 2 2
be different from current boundaries and cause Deaths from stroke 2 3 2 2 2 2 2 2 2 2 2 1 2 2 1 2 2 2 2 2 1 2 2 1
discrepancies in the tartan rug. These indicators are Preventable mortality 2 2 2 3 2 2 2 2 2 1 2 2 2 2 1 1 2 2 2 2 1 2 1 2
shown in a paler colour scheme.
For more information, see the Inequalities Indicators Excel Pack8
Index of Multiple Deprivation 2019 at national level
Oxford has moved up 16 places
and it is now ranked 182th out of
317 local authorities where 1 is
most deprived and 317 is least
deprived.
The map shows that an LSOA
(Lower Layer Super Output Areas)
in Northfield Brook is amongst
the 10% most deprived areas.
Areas in Barton, Blackbird Leys,
Carfax, Rose Hill and Littlemore
are amongst the 20% most
deprived areas nationally.
Even though Oxford is relatively
Oxford City District Summary
less deprived compared to 2015
it continues to be the most
deprived district in Oxfordshire.
The decile bar above shows LSOAs
grouped according to how deprived
Source: Indices of Multiple Deprivation 2019 EXPLORE the data for districts and small areas they are , where 1 is most deprived
Mapped by District Data Analysis service with our interactive deprivation dashboard and 10 is least deprived.9
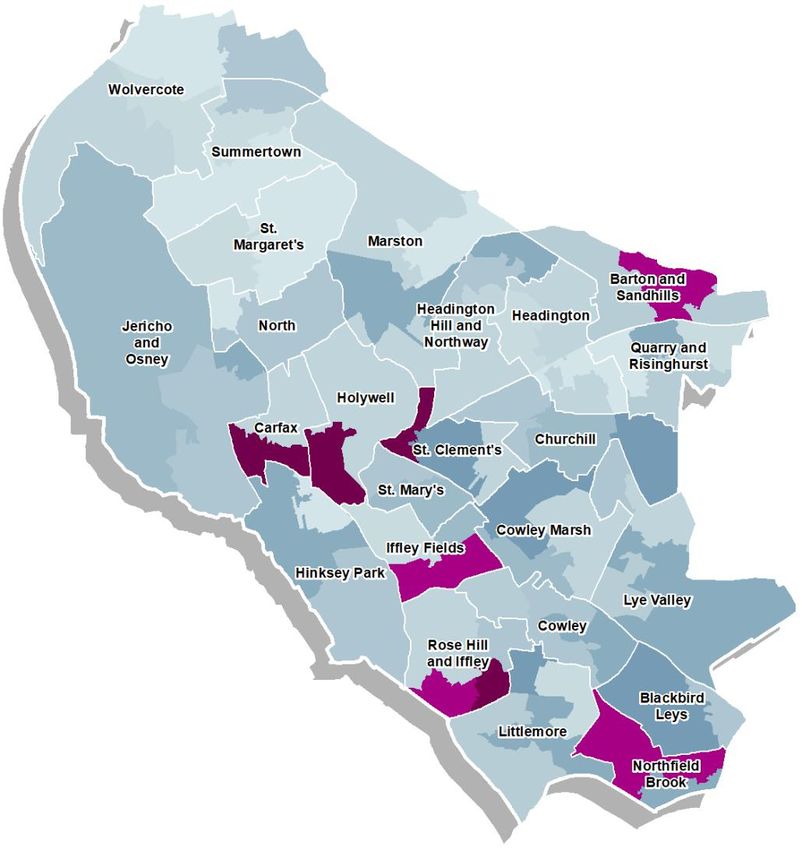
IMD Ranking within Oxford
This map shows how the LSOAs
within Oxford compare to each
other.
Areas that score within the 10%
most deprived LSOAs in Oxford
are in parts of Barton and
Sandhills, Blackbird Leys,
Carfax, Hollywell, Northfield
Brook, and Rose Hill & Iffley.
Parts of Barton & Sandhills,
Blackbird Leys, Churchill,
Littlemore, Northfield Brook
Rosehill & Iffley, and
Oxford City District Summary
St.Clement’s are within the 20%
most deprived areas within
Oxford.
The decile bar above shows LSOAs
grouped according to how deprived
Source: Indices of Multiple Deprivation 2019 EXPLORE the data for districts and small areas they are , where 1 is most deprived
Mapped by District Data Analysis service with our interactive deprivation dashboard and 10 is least deprived.10
Income Deprivation Affecting Children Index 2019
The Income Deprivation
Affecting Children Index
(IDACI) is the proportion of
children age 0-15 living in
income deprived families.
The most deprived areas of
IDACI in Oxford were in parts
of Blackbird Leys,
Littlemore, and Rose Hill &
Iffley, all in the 10% most
deprived areas nationally.
The least deprived areas in
Oxford are located in parts
on St. Margaret's, North,
Oxford City District Summary
Summertown and
Wolvercote.
The decile bar above shows LSOAs
grouped according to how deprived
Sources: Indices of Multiple Deprivation 2019 Explorer/ EXPLORE the data for districts and small areas they are , where 1 is most deprived
Joint Strategic Needs Assessment 2020 with our interactive deprivation dashboard and 10 is least deprived.11
Income Deprivation Affecting Older People Index 2019
The Income Deprivation
Affecting Older People Index
(IDAOPI) is the proportion of
those age 60 or over who
experience income
deprivation.
The most deprived areas on
the IDAOPI in Oxford are in
parts of Barton & Sandhills,
Carfax and St. Clements,
all in the 10% most deprived
areas nationally.
The 10% least deprived
areas are in parts of
Oxford City District Summary
Headington, Summertown,
Iffley Fields and
Wolvercote.
The decile bar above shows LSOAs
grouped according to how deprived
Sources: Indices of Multiple Deprivation 2019 Explorer/ EXPLORE the data for districts and small areas they are , where 1 is most deprived
Joint Strategic Needs Assessment 2020 with our interactive deprivation dashboard and 10 is least deprived.12
Finding out more
The latest JSNA giving health and wellbeing facts and figures for Oxfordshire is
available on Oxfordshire Insight
Oxfordshire 2020 JSNA report
ANNEX: Inequalities indicators ward level data
Ward inequalities indicators excel pack including OCCG and District summaries
Public Health Dashboards
Health Needs Assessments
Community Health and Wellbeing Profiles
Public Health England provides a wide range of health indicators and profiles on
Fingertips
ONS population estimates and population projections for county and districts,
benefits claimants and the annual population survey are available from
Oxford City District Summary
www.nomisweb.co.uk
Oxfordshire County Council population forecasts are published on Oxfordshire Insight
(select “future population change”)
http://insight.oxfordshire.gov.uk/cms/population-0You can also read