Free Windows Health Monitor - User Guide - 2013 Zoho Corporation Pvt. Ltd. All rights reserved.
←
→
Page content transcription
If your browser does not render page correctly, please read the page content below
User Guide

                                     Free Windows Health Monitor

© 2013 Zoho Corporation Pvt. Ltd. All rights reserved.
Table of Contents

Overview ……………………………………………………………………………………… 2

Getting Started ………………………………………………………………………………. 3

      Add server ……………………………………………………………………………. 3

      Using the domain username/password ...…………………………………………. 3

Settings...……………………………………………………………………………………… 4

      Configure Thresholds ………………………………………………………….……. 4

      Port Scanning ……………………………………………………………………….. 4

            Custom Selection ……………………………………………………………. 4

            Range Selection.……………………………………………………………... 5

      Reports & Email……………………………………………………………………… 5

            Reports……………………………………………………………………….. 5

            Email ………………………………………………………………………….. 5

      Retain Settings ……………………………………………………………………… 6

Tree View …………………………………………………………………………………….. 6

Server View ………………………………………………………………………………….. 7

Dashboard View ...…………………………………………………………………………. 8

System Requirements...……………………………………………………………………. 9

FAQ...…………………………………………………………………………………………10

Contact Us………………………………………………………………………………….. 13

User Guide: ManageEngine Free Windows Health Monitor   Page 1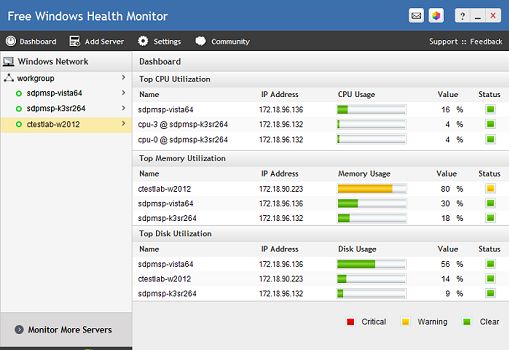
OVERVIEW
What is Windows Health Monitor?
Windows Health Monitor is a tool that monitors all the Windows and Client server OS
versions in real-time from a remote location. You can monitor up to 20 Windows
devices simultaneously using the tool.
What the Tool does?
Check configuration details of the devices:
Find the Server name, IP Address, OS, total and available memory, disk type,
total and available disk space, disk read and write rate.
Server view
Monitor the critical performance parameters of all Windows devices like CPU
utilization, disk space, memory utilization, device response time and network
bandwidth usage.
Dashboard View
Access the performance parameters of top 3 servers in terms of the memory,
CPU and disk utilization.
TCP Port scanning
Scan either a specific TCP ports or the ports within a specific range.
Report & Email
Email the real-time performance parameter report of the selected device in PDF
format.
User Guide: ManageEngine Free Windows Health Monitor Page 2
GETTING STARTED
Add Server
To configure a device for monitoring, click the 'Add Server' icon and enter the following
information:
System Name/IP
Domain/Workgroup*
User Name
Password
Using the Domain Username/Password
Check "Save as Domain Username/Password", if the domain username is being
used. When "Save as Domain Username/Password" is checked, the tool retains the
same domain user name/password while adding the other servers from the same
domain latter.
Fig. Add Server Window in tools’ UI
* You can find the domain name for Windows devices in Control Panel by following the
path Control Panel ---> System and Security ---> System
User Guide: ManageEngine Free Windows Health Monitor Page 3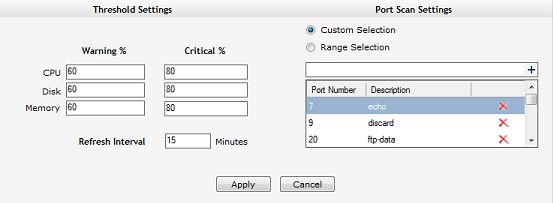
SETTINGS
Configure Thresholds
Set thresholds at two levels – warning & critical and identify an impending fault well in
advance.
Click on settings and update the warning and critical values for CPU, Disk and
memory
Set the refresh interval in minutes
Click on Apply to save the settings.
Fig. Settings window of Windows Health Monitor
Port Scanning:
The tool helps you keep a tab on your devices' open ports. Two types of port
selections are possible - 'Custom Selection' and 'Range Selection'.
Click on ‘Settings’ to access the port scan settings. The two selection options are
explained below:
(a) Custom Selection
The 'Custom Selection' option lets you select individual ports irrespective of its range
for scanning. Upon checking the 'Custom Selection' option, the tool presents a list of
ports in the scroll down that are scanned by default with the option to add/delete. To
add additional ports, type the port number in the box and click on the add symbol.
User Guide: ManageEngine Free Windows Health Monitor Page 4(b) Range Selection
The 'Range Selection' option lets you select ports within a continuous range for
scanning. Use this option when your requirement is to scan all the ports within a
specified range. Select the 'Range Selection' option and set the ‘From’ and ‘To’ Port
Numbers.
Fig. Port Scan Settings – Custom & Range Selection
REPORT & EMAIL:
Save and Email the real-time performance report of the selected server from the tool.
(a) Reports:
Select the server from the tree view and click on 'Generate
Server Report' (left to refresh server icon). Choose the file
path and save the report. A snapshot highlighting the same
is shown to your right. The output would be saved in
Fig. Report button in Tools’ UI
PDF format.
(b) Email
Configure your Email in the tool and send real
time performance report of servers from the tool.
To configure, click on Email icon and click on
Settings in the ‘Send Email’ pop up. Fill in the
SMTP Server Name, Port, UserName, Password,
and Sender Email address. Enter the recipient
Email address in ‘Email To’ box, attach the Fig. Email settings window in tools’ UI
report saved in your local disk and click on send.
User Guide: ManageEngine Free Windows Health Monitor Page 5Note: The default SMTP port number is 25. Please contact your Email administrator if
it is otherwise.
Retain Settings
Windows Health Monitor retains the threshold, port scan and Email settings for
subsequent restarts.
TREE VIEW:
The tool provides a domain based tree view of the connected servers in the left side of
GUI. Just double click the domain name to expand or collapse the devices linked to
the particular domain.
Fig. Domain based tree view of added devices
User Guide: ManageEngine Free Windows Health Monitor Page 6SERVER VIEW:
Use server view for monitoring the performance parameters of the devices individually.
Click on the server to be monitored from the tree view. The tool populates the
following parameters in dial graph:
CPU Utilization
Disk Space – used and free
Memory Utilization
Device Response time
Open Ports
Network Bandwidth Status – Data Rx and Tx
Fig. Server view of a selected device
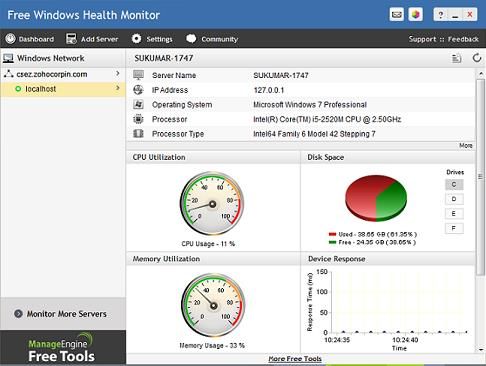
User Guide: ManageEngine Free Windows Health Monitor Page 7DASHBOARD VIEW
Dashboard view is a utility to highlight the high resource consuming devices among
the connected machines. It packages the performance parameters of the top 3 servers
based on the Memory utilization, CPU usage and Disk utilization. To access the
dashboard view, click on Dashboard from the menu. Below is a snapshot of the
dashboard view form the tool:
Fig. Dashboard view of highlighting the top 3 resource consuming devices
selected device
On clicking a specific device in the Dashboard view, the tool directly navigates to the
server view of the selected device. The dashboard view helps to zero down the
devices experiencing potential problems. Thereby, you don’t have to laboriously
monitor the devices individually.
User Guide: ManageEngine Free Windows Health Monitor Page 8SYSTEM REQUIREMENTS Hardware • CPU: 1 GHz (x86 processor) or 1.4 GHz (x64 processor) and higher versions • Memory: Minimum 512 MB of RAM • Disk Space: Minimum 3 MB of disk space before installation and less than 10 MB of disk space after installation Software: • Any versions of Microsoft Windows server and client Operating Systems • Microsoft .Net Framework 3.5 Note: You can download Microsoft .NET Framework 3.5 from here User Guide: ManageEngine Free Windows Health Monitor Page 9
FAQ

1. Unable to connect to the server?

   (a) Check whether the host server is connected to the network
   (b) Check whether the host server is up and running
   (c) Check if the host server is behind firewall. If yes, then check whether port 445
      and 135 are accessible. If not accessible, then open the port by configuring the
      firewall.
   (d) In extreme cases, check whether the system resources are over utilized and
      could not respond to polling from the tool.

2. I have downloaded the tool but it is not running. What should I do?

   This problem can be due to either one of the below reasons:

   (a) Microsoft .Net Framework not installed in your system.
   (b) A lower version of Microsoft .Net Framework installed in your system.

   The tool requires Microsoft .NET Framework 3.5 for running. The bin directory of
   the tool is provided with a utility ‘Check_Dot_Net_version.exe’. Run this utility
   from the command prompt to find the .Net version installed your system.

   You can download and install Microsoft .Net framework 3.5 from here

3. While adding a new device, I get the error message, “Error in fetching the data”.
   What should I do?

   This problem might be due to issues in WMI services running in the remote
   machine. Restarting the remote machine’s WMI service might fix the issue. To
   restart the WMI service, from your remote machine go to Start/run, type
   services.msc and press Enter. In the services window find Windows
   Management Instrumentation service and restart it.

User Guide: ManageEngine Free Windows Health Monitor                         Page 10
4. I am getting a start-up error message, “The program can't start because
msvcr100.dll is missing from your computer”. What should I do?
The Error occurs when .Net Framework version is below 3.5. Please install
the Microsoft Visual C++ Redistributable package and run the Free Windows
Health Monitor. Choose he appropriate download links given below:
Download links: 32 bit systems; 64 bit systems.
5. While connecting to a remote device, I get the error message, “Error Code: -
2147024891 (Access is Denied)”. What should I do?
From your remote device, Goto Run, type dcomcnfg and hit enter. Double click on
Console Root --> Component Services --> Computers --> My Computer.
Right click and click on properties. Select Default Properties tab in the pop-up
window and check Enable Distributed Computer on this computer. Try
connecting to the remote server again after enabling this setting.
Fig. Settings - My Computer Properties
User Guide: ManageEngine Free Windows Health Monitor Page 116. While connecting to a remote device, I get the error message, “Error Code: - 2147023174 (The RPC server is unavailable)”. What should I do? This error occurs when the remote device is behind the firewall and RPC Port 135 is closed. Open the port by configuring the firewall and reconnect the device. User Guide: ManageEngine Free Windows Health Monitor Page 12
CONTACT US

 Email us if you have any queries - ‘free-tools@manageengine.com’

 To download other Free Tools: http://www.manageengine.com/free-tools.html

 To know more about other ManageEngine products: http://www.manageengine.com/

 Engage with the fellow admins: https://community.manageengine.com/

User Guide: ManageEngine Free Windows Health Monitor                Page 13
You can also read