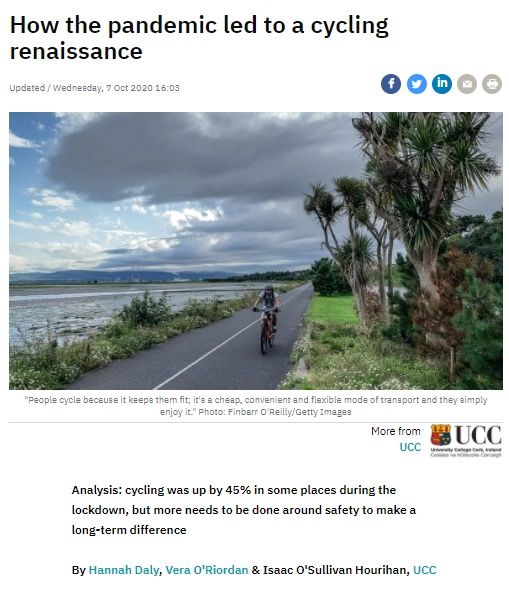
What can more walking and cycling achieve for Ireland's climate targets?
←
→
Page content transcription
If your browser does not render page correctly, please read the page content below
What can more walking and cycling achieve for Ireland’s climate targets?

Vera O’Riordan 1,2, Tomás Mac Uidhir 1, 2, Brian Ó Gallachóir 1, 2, Fionn Rogan 1, 2, Hannah
Daly 1, 2
1 Energy  Policy and Modelling Group, MaREI Centre, Environmental Research Institute, Co. Cork, Ireland
2School   of Engineering, University College Cork, Co. Cork, Ireland
Ireland’s commitments to Climate Action

                                          A legal obligation to a 51%
                                          reduction in GHG
                                          emissions for Ireland by
                                          2030 compared to 2020.

                                          This roughly translates to
                                          7% per year reduction in
                                          GHG emissions

                                          Targets for sustainable
                                          technologies, public
                                          services and low carbon
                                          schemes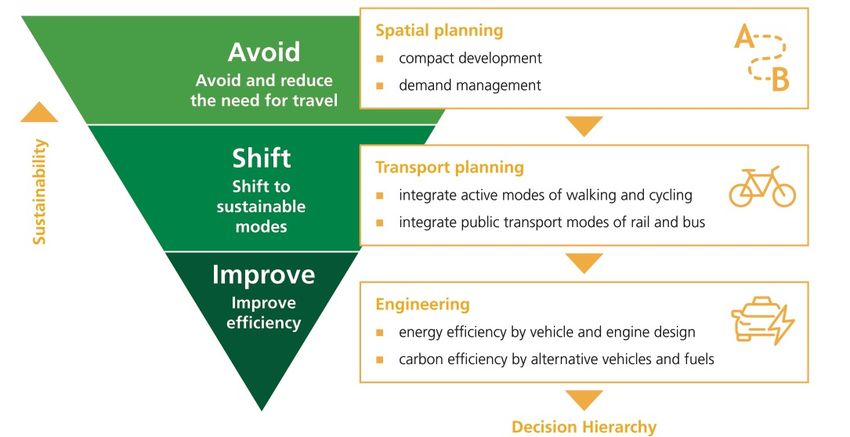
Policy Context
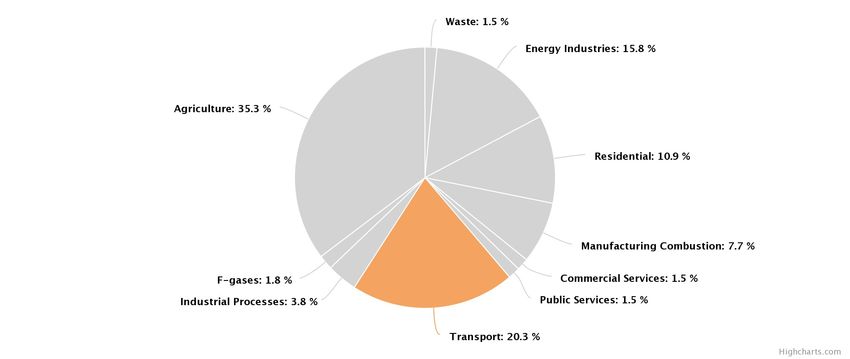
Where do Ireland’s Green House Gas Emissions come from?
[1] Environmental Protection Agency, 2021 accessible at https://www.epa.ie/ghg/transport/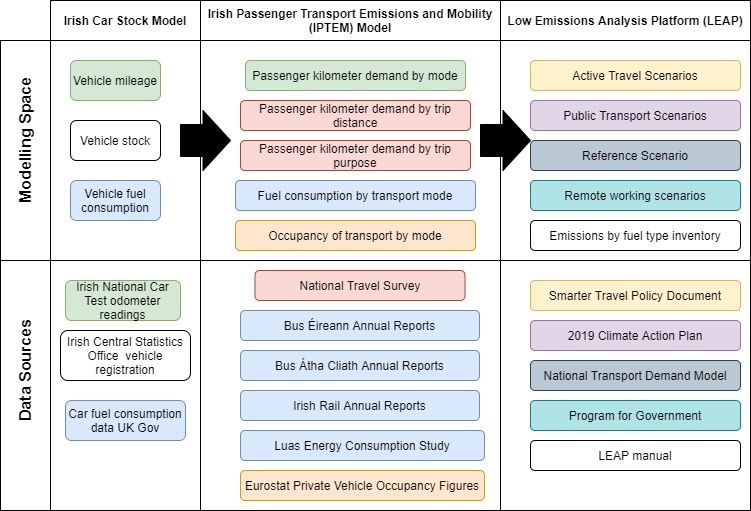
Policy Makers & Energy System Modellers

       Policy makers                         Modellers

 • Policy documents
                                          • Modelling Tools
 • Needs of the public
                                          • Analytical capacity
 • Emissions targets
                                          • Policy blind spots
 • Modelling blind spots
Avoid-Shift-Improve Framework

[2] Environmental Protection Agency, 2020. Ireland's Environment - An Integrated Assessment 2020. [online] Available at:
Irish Passenger Transport Modelling Framework
Irish Passenger Transport Emissions and Mobility Model

    The Irish Transport Emissions and Mobility Model (IPTEM Model)
    provides a historical look and a future projection of the total passenger
    transport demand by:
    1. Mode
    2. Trip length
    3. Trip purpose

    For Ireland. It is based on the Irish Car Stock Model [3] and the National
    Travel Survey [4]

[3] Daly, H., Ó Gallachóir, B.P., 2011. Modelling private car energy demand using a technological car stock model. Transp. Res. Part D Transp.
Environ. https://doi.org/10.1016/j.trd.2010.08.009
[4] Central Statistics Office, National Travel Survey, https://www.cso.ie/en/statistics/tourismandtravel/nationaltravelsurvey/
Private car is the most common transport mode in Ireland
                                   70
                                                                                                                               Cycling + walking =
                                                                                                                   Bus         1% of PKM
                                   60                                                                   Rail/Dart/Luas
                                                                                                Lorry/Motorcycle/Other
  Passenger Kilometres (billion)

                                   50                                                            Private car - Passenger

                                   40
                                                                                                                                   Private car
                                                                                                 Private car - Driver              = 82% of
                                   30                                                                                              distance
                                                                                                                                   travelled
                                   20

                                   10

                                   -
                                        2009   2010   2011   2012   2013   2014   2015   2016      2017      2018       2019
                                                                                                                               Data Source: CSO
Passenger transport demand by trip purpose

                                        70
                             Billions

                                                                                                              To eat or drink
                                                                                                                  Education
                                        60                                                                            Other
Passenger Kilometres (Pkm)

                                                                                                           Personal business

                                        50                                                              Visit family / friends
                                                                                               Entertainment / leisure / sports
                                        40
                                                                                                 Companion / escort journey

                                        30
                                                                                                                    Shopping
                                        20

                                        10                                                                           Work

                                        -
                                             2009   2010   2011   2012   2013   2014   2015   2016     2017        2018          2019
Occupancy rates of transport modes in Ireland

                              160
                                              139.5
Average Occupancy (Persons)

                              140
                                                            121.7
                              120
                              100
                               80
                               60
                               40                                          34.4
                               20                                                         8.7
                                                                                                     1.5         1.0
                                0
                                         Irish Rail         Luas         Dublin Bus   Bus Éireann   Car    Walking/Cycling

       Occupancy is the average number of people travelling in a mode of transport. It is based on an estimation from recorded
       passenger numbers from Bus Éireann, Dublin Bus and Irish Rail Annual Reports [5], [6], [7]. Private vehicle occupancy
       estimates are based on Eurostat figures [5].
Emissions per passenger kilometre for transport modes in Ireland
140
120
Emissions per passenger
kilometre (gCO2/pkm)
100
80
60
40
20
0
Private Vehicle Irish Rail Bus Éireann Dublin Bus Luas Walking/CyclingLow Emissions Analysis Platform - LEAP
Exploratory climate action targets are applied using the LEAP simulation model and
scenario analysis. This allows the construction of pathways to low carbon transport and
the estimation of carbon budgets for the period 2020 – 2030 [6].
Identify 2030 Transport Scenario Carbon
LEAP
targets
Data Analysis Budget
• Use annual uptake
Low Emissions Analysis
• Irish Passenger rates as scenario Carbon budgets for
Platform that
Transport Emissions inputs for transport period 2020 - 2030 for
Identify key government calculates the enables
and Mobility Model improvements, each scenario
end year targets for 2030 scenario analysis and
• Irish Car Stock Model demand reductions
GHG accounting
and modal shift
[6] Mac Uidhir, T., Rogan, F., Gallachóir, B.Ó., 2020. Develop a LEAP GHG Ireland Analytical Tool for 2050 Report No. 349. Available at:
https://www.epa.ie/pubs/reports/research/climate/Research_Report_349.pdf (Date Accessed: 16th December 2020)Active Travel Scenarios based on the Smarter Travel Policy Document Scenario Assumptions Reference • Assumes no change in share of transport modes from 2019 levels Cycling accounts for 10% of • Share of cycling passenger kilometres increases until it reaches the value of passenger the shortest trips kilometres that represents 10% of the shortest trips Cycling and walking 450,000 • Walking and cycling trips increase proportionally to their current shares until 450k trips per day trips per day are either by walking or cycling Cycling accounts for 10% of • Cycling rate increases for work related travel until 10% of passenger kilometres for work passenger kilometres by work is by cycling 2030 Cycling is 10% of work and • Cycling rate increases for work and education related travel until 10% of passenger education passenger kilometres for work and education is by cycling kilometres Cycling accounts for 10% of • Cycling accounts for 10% of trips of typical cycling length trips of typical cycling journey length Cycling accounts for 10% of • Cycling services 10% of ALL passenger kilometre demand each year (This is equivalent ALL passenger kilometres to the rate of cycling in the Netherlands)
7                                Reference
                                                                         Cycling is 10pc of work pkm
Passenger Transport Emissions (MTCO2)

                                        6                                Cycling accounts for 10pc of shortest trips
                                                                         Cycling is 10 pc of ALL pkm by 2030
                                        5                                Cycling and walking 450k trips per day
                                                                         Cycling accounts for 10pc of trips with typical
                                        4                                cycling journey lengths
                                            Dip in passenger transport
                                            emissions due to COVID-19
                                        3

                                        2

                                        1

                                        0
                                          18
                                          19
                                          20
                                          21
                                          22
                                          23
                                          24
                                          25
                                          26
                                          27
                                          28
                                          29
                                          30
                                        20
                                        20
                                        20
                                        20
                                        20
                                        20
                                        20
                                        20
                                        20
                                        20
                                        20
                                        20
                                        20
Active Modes - Results
Scenario Reduction in 2030
compared to 2020
MtCO2
Active modes = 10% of shortest trips 0.5
Cycling = 10% of trips with typical cycle journey length 0.9
Active modes = 450k trips per day 1
Actives modes = 10% of all PKM by 2030 0.7
Active modes = 10% of work and education PKM 0.3
Active modes = 10% of work PKM 0.2Highlights
• In 2019, 1.7% of trips were made by bike, far below the 2009 “Smarter Travel” 10% target for 2020 [7]
• Private car is the most common transport mode in Ireland - many more journeys could be via public
transport or active modes
• Active modes could deliver between 0.2 and 1 MTCO2 emissions reduction in 2030.
• E-bikes may extend the potential for longer car trips to be replaced [8]
• Demand reduction scenarios – the Irish Passenger Transport Modelling Framework could
investigate the impacts of remote work on passenger transport emissions
• The individual impact of these policy measures will be different than the sum of the emission savings, due
to the interaction effect – this is an area for future work
[7] Department of Transport, “Smarter Travel: A Sustainable Transport Future,” 2009. [Online]. Available:
http://www.smartertravel.ie/sites/default/files/uploads/2012_12_27_Smarter_Travel_english_PN_WEB%5B1%5D_0.pdf.
[8] J. E. Bourne et al., “The impact of e-cycling on travel behaviour : A scoping review,” J. Transp. Heal., vol. 19, no. August, p. 100910, 2020, doi: 10.1016/j.jth.2020.100910.Our impact
Conclusion

                        “Healthy Planet, Healthy Communities”

         • Active modes of travel reduce car usage – free the roads for those who really need them

         • The health benefits of exercise are well researched, walking and cycling infrastructure can
           facilitate this

         • By reducing CO2 emissions by switching from car use to bike use, we look after our physical
           health, mental health and the wellbeing of our planet by reducing CO2 emissions
Questions & suggestions welcome!
Thanks for listening!
vera.oriordan@ucc.ie @veraoriordan
marei.ie/people/vera-oriordan/ @VeraRORiordanMany short journeys could be active modes
Proportion of passenger travel demand by overall journey distance, 2019References [1] Environmental Protection Agency, 2021 accessible at https://www.epa.ie/ghg/transport/ [2] Environmental Protection Agency, 2020. Ireland's Environment - An Integrated Assessment 2020. [online] Available at:
Scenario Analysis

         • Scenario analysis uses a simulation tool to compare a new target, which is
           quantified in a new scenario against the ‘Business as Usual’ or ‘no target’
           scenario which is called the “Reference” scenario

         • By comparing the relative difference in emissions, we can get an insight into the
           effectiveness of the policy target in reducing carbon dioxide emissions if it is
           achieved by a given date.

         • More details about the LEAP Ireland 2050 model can be found here [9].

[6] Mac Uidhir, T., Rogan, F., Gallachóir, B.Ó., 2020. Develop a LEAP GHG Ireland Analytical Tool for 2050 Report No. 349. Available at:
https://www.epa.ie/pubs/reports/research/climate/Research_Report_349.pdf (Date Accessed: 16th December 2020)
COVID-19 & Passenger Transport Demand
TII Traffic Counter Data
Website Modelling Tools
2020 traffic volumes index to 2019
20
• Irish Car Stock Model
10
0 [1]
-10
-20
2020 • Irish Passenger
-30
%
-40 2019 Transport Emissions
-50 and Mobility Model
-60
-70
-80 • LEAP Ireland 2050 [9]
Jan Feb Mar Apr May Jun Jul Aug Sep Oct Nov
[3] Daly, H., Ó Gallachóir, B.P., 2011. Modelling private car energy demand using a technological car stock model. Transp. Res. Part D Transp. Environ.
https://doi.org/10.1016/j.trd.2010.08.009
[6] Mac Uidhir, T., Rogan, F., Gallachóir, B.Ó., 2020. Develop a LEAP GHG Ireland Analytical Tool for 2050 Report No. 349. Available at:
https://www.epa.ie/pubs/reports/research/climate/Research_Report_349.pdf (Date Accessed: 16th December 2020)% Reduction of traffic volumes in 2020
5
0
relative to 2019
-5
-10
-15
-20
-25
-30
BUS CAR CARAVAN HGV_ART HGV_RIG LGV MOTORBIKE
Vehicle ClassYou can also read