BTSF Better Training for Safer Food - Process CCP identification in cheese production and scientific safety assurance indicators
←
→
Page content transcription
If your browser does not render page correctly, please read the page content below

Better Training for Safer Food
             BTSF

Process CCP identification in cheese
  production and scientific safety
       assurance indicators
            Paolo Daminelli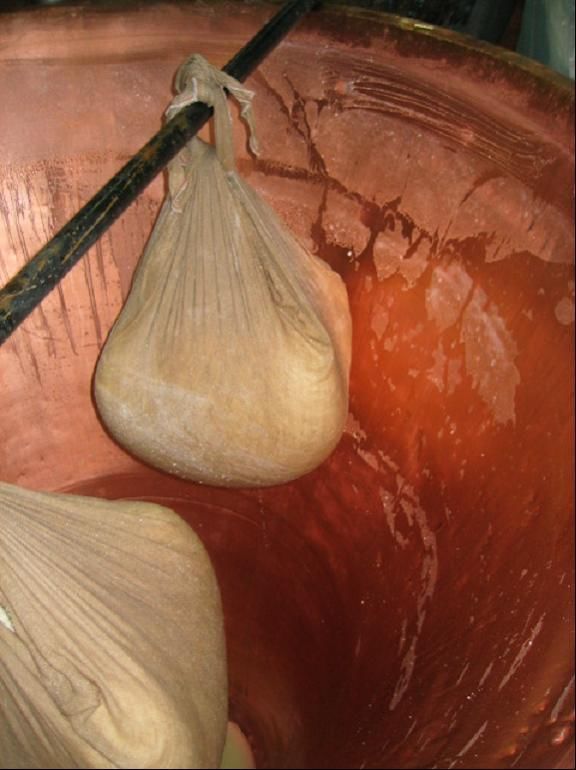
Microbiological risk analysis
• Use of computational tools as
  decision aid in microbial risk
  analysis
• Predictive model used by
  • Industry
                             improve food safety
  • Regulatory agency
  • Academy                  qMRA
                                            2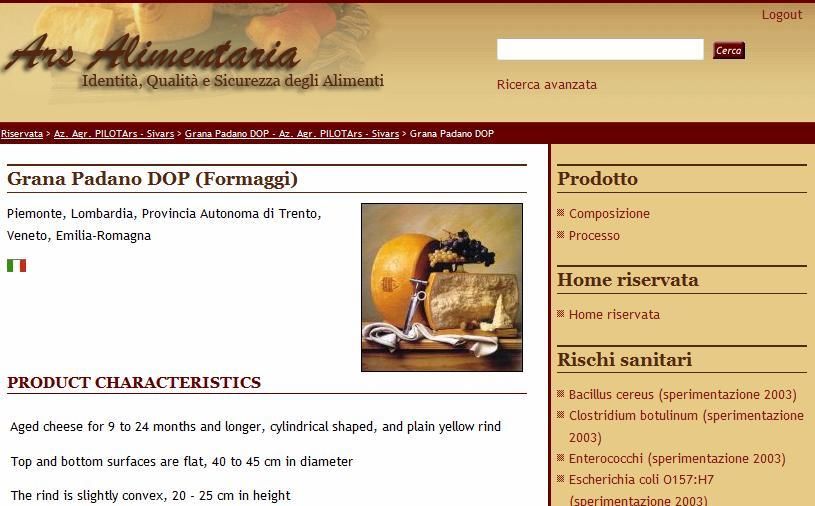
3
For a better understanding...
  Italian cheeses
457 kind of cheeses in Italy (OJ 147 26-6-2007)
  • 2.026 cheese factory that produce 1.154.036 TON
    (ISTAT)
     96.600.000 euro export market value
     +20% in value, +8% in quintal (ISTAT)

  Grana Padano   mozzarella   Gorgonzola Taleggio   4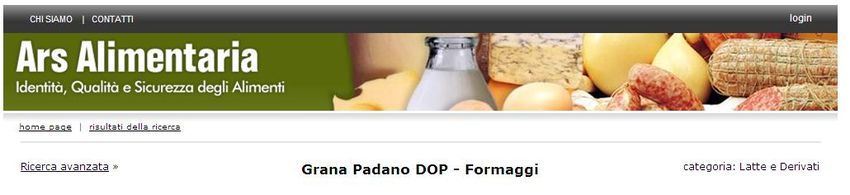
Cheese process

Preservation of constituents of milk (fat and
protein) via isoelectric (acid) or enzymatic (rennet)
coagulation and curd ripening

Two of the principles of food preservation: lactic
acid fermentation and reduction of water activity
      Temperature ? It is not mentioned…
      Which are the safety indicators?

                                                    5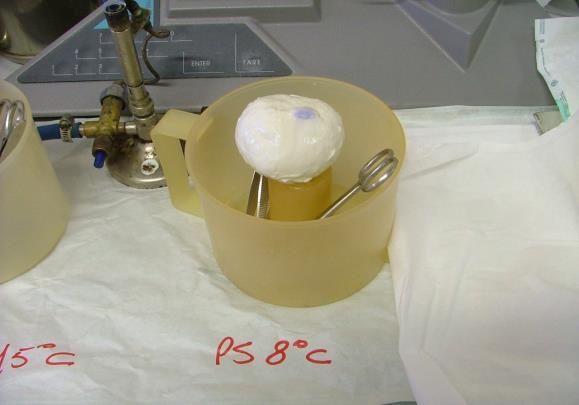
How to improve the cheese safety

 • I need to know:
    • The hazard
    • The CCP of process and storage
    • The behaviour of the hazard in the
      substrate trough database, literature,
      experimental design (Dynamic pH, aw,
      temp, LAB)
    • DATA BANK information
     www.Combase.cc
     www.ars-alimentaria.it
                                           6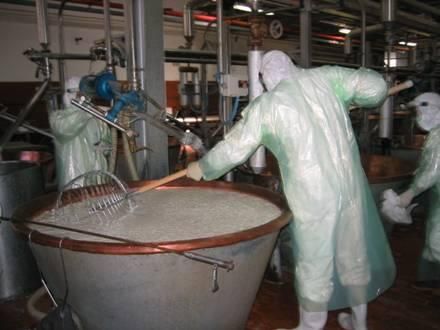
www.Combase.cc

                 7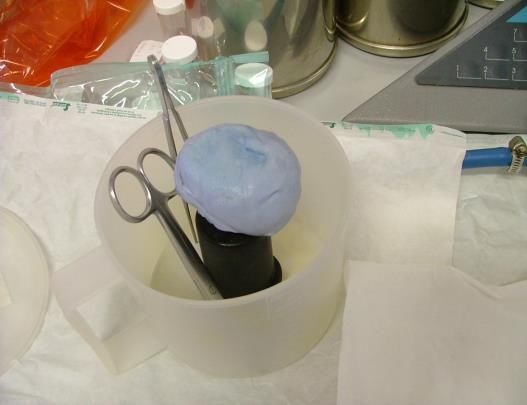
Primary model: Dmfit a tool to
 calculate the rate of observed data

                            Data fit
                            with
                            different
                            model

                                        8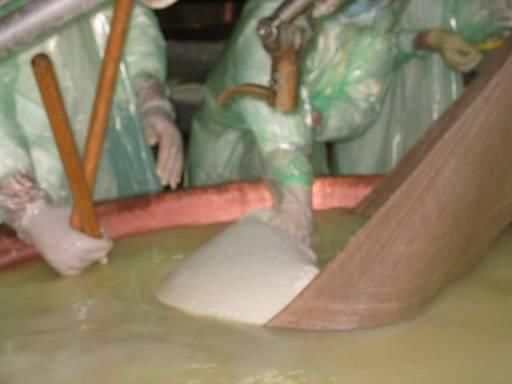
Secondary model a tool to predict how
 the environment affect the rate

     Compare observed data with prediction

                                             9
Predictive model: : growth, death, survival

                          Dynamic model:
                          The rate changes
                          As a function of
                          T,pH,aw,CO2..

                                             10
Flow chart is too poor to characterise
the CCP
milk
coagulation
cutting the curd
whey drainage
curing
1112
13
Safety criteria

• Following Regulation (EC) 2073/2005

  • Salmonella spp.
  • Listeria monocytogenes
  • Staphylococcal enterotoxins

                                        14
Safety criteria
• Absence in 25 g (Ss)
• Absence in 25 g or 100 cfu/g(Lm)
• Ready-to-eat foods are able or not to
support the growth of L. monocytogenes
• Products placed on the market during
their shelf-life or
• Before the food has left the immediate
control of the food business operator who
has produced it
15Safety criteria
• Unable to support the growth
Products with pH ≤ 4.4 or aw ≤ 0.92,
Products with pH ≤ 5.0 and aw ≤ 0.94,
Products with a shelf-life of less than five
days shall be automatically considered to
belong to this category. Other categories of
products can also belong to this category,
subject to scientific justification.
16Process hygiene criteria:
During the manufacturing process when the
E. coli and coagulase positive staphylococci
count is expected to be highest.
• Improvements in production
hygiene and selection of raw
materials.
• We need to know the process.
17Cheese Process
• Many cheeses many processes… It is not
possible to standardize.. we need to know
each process
• Raw material milk (cows, goats,
sheep), starter cultures (?), rennet,
heat treatment, salt, spices
Cheese-making equipment, personal
cleanliness
18Cheese characterization
• High variability of processes
• We need a databank (ARS Alimentaria) to:
• Collect information for each process
• Have detailed description of each steps
• Time temperature ratio during cheese
making
Chemical, physical, indigenous bacterial CCP
19Cheese characterization
• www.Ars-alimentaria.it
• IZS web site to give technical and
scientific information about the
identity, the quality and the safeness
of Italian food
• Different level of availability
• Bacterial, chemical and physical
description
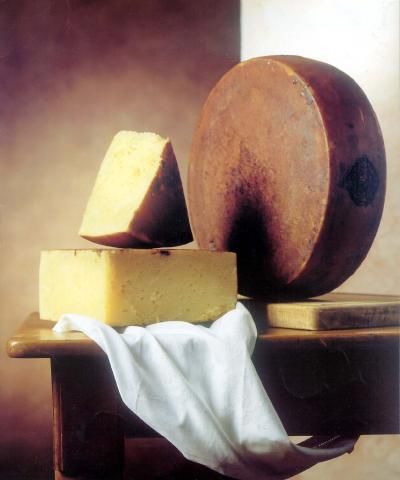
An example Grana Padano…
20Ars-alimentaria.it
Technical
description
21Use of ars-alimentaria to know…
• The ccp process of cheese and the steps of
the hurdle technology
• Temperature during the process
• Behaviour of indigenous flora in
cheese
• pH and aw profile process
Challenge test with the description of the
pathogens behaviour in different kind of
food
22Grana Padano challenge Test
• Cutting
• Cooking 53.5 10’ – lie down for 1 h
23Grana Padano challenge Test
• Curd extraction and whey drainage
24Challenge Test: Grana Padano (raw milk cheese)
• Temperature profile pH profile
temperature profile during Grana Padano process pH profile at the beginning of Grana Padano cheese
making
60
55
50 7
45 6.5
40 6
pH
35 5.5
°C
30 5
25 4.5
20
15 0 24 48
10
5 time h
0
0 10 20 30 40 50
hours
pH fit max min
Boni et al. 2004 Analisys of Listeria monocytogenes, Salmonella typhimurium and
enteritidis and Staphilococcus aureus death rate in Grana Padano DOP cheese.
25
Veterinary Public Health and food Safety. Roma 22-23/11 2004Listeria monocytogenes behaviour
9
8
• T° 53°C for 1h 30’ 7
• se=0.56 6
log ufc/g
5
4
• Dvalue=28’13’’ 3
2
1
0
-1 0 1 2 3 4 5 6 7 8
time (h)
• We assumed constant pH
log cfu/g fit
max Min
latte contaminato Serie6
Serie7 latte caldo contaminato
Serie9 Serie10
Boni et al. 2004 Analisys of Listeria monocytogenes, Salmonella typhimurium and enteritidis and Staphilococcus
26
aureus death rate in Grana Padano DOP cheese. Veterinary Public Health and food Safety. Roma 22-23/11 2004Salmonella spp. behaviour
9
• T° 53°C for 1h 30’ 8
• Se 0.24 7
6
5
log cfu/g
• Dvalue =8’44’’ 4
3
2
1
0
-1 0 1 2 3 4
time (h)
log cfu/g Fit 1 max min
Boni et al. 2004 Analisys of Listeria monocytogenes, Salmonella typhimurium and enteritidis and Staphilococcus
27
aureus death rate in Grana Padano DOP cheese. Veterinary Public Health and food Safety. Roma 22-23/11 2004Predictive model:
time temp profile Grana Padano process
Time (h)
Yvan Le Marc IFR Norwich
28Predictive model time temp profile Bagoss
• Coculture
(Pred. Listeria monocytogenes) (Pred. LAB)
(Pred. pH) lm in Bagoss
(T. profile)
10 60
9
50
8
7 Bagoss cheese
temperatura (°C)
40
Log UFC/g
6
5 30
4
3
20 Lm
2
10
does not change
1
0 0
during process
0 5 10 15 20 25 30 35
tempo (ora)
29Raw milk as an ingredient
• Lm cheese made from raw milk
• Curd cooking tempChallenge test: Taleggio cheese
Lm during process and shelf life
•Lm On Surface salted taleggio
pH e andamento della concentrazione di L.monocytogenes sulla crosta del
Taleggio salato a secco durante il processo e la stagionatura in funzione della
temperatura
10 25
9
8 20
Temperatura °C
logc(logufc/g)
7
6 15
pH-
5
4 10
3
2 5
1
0 0
0 500 1000 1500 2000 2500 3000
tempo (h)
pH crosta taleggio durante il processo e la shelf life
L.monocytogenes durante il processo
L.monocytogenes durante la shelf-life 31
soglia pH
temperatura processo
temperatura shelf lifeChallenge test: Taleggio cheese
Lm during process and shelf life
•Lm In Surface salted taleggio
Andamento della concentrazione di L.monocytogenes sulla pasta del Taleggio
salato a secco durante il processo e la stagionatura in funzione della
temperatura e del pH
10 25
9
8 20
Temperatura °C
logc(logufc/g)
7
6 15
pH-
5
4 10
3
2 5
1
0 0
0 500 1000 1500 2000 2500 3000
tempo (h)
pH crosta taleggio durante il processo e la shelf life
L.monocytogenes durante il processo
L.monocytogenes durante la shelf-life
soglia pH 32
temperatura processo
temperatura shelf lifePrimary model: B.Cereus in milk
• To calculate the rate at constant temp:
• Psychrotrophic B.cereus in milk
LA64K_2_20 LA67K_2_20
(bc,8°C
8, veg, ATCC) (bc,12°C
8, veg, ATCC)
9 9
Time to toxin
Logc(log(ufc/ml))
6 6
3 3
0 0
0 72 144 216 288 360 432 504 576 0 72 144 216 288 360 432 504 576
time (h) 33Secondary model B.cereus in milk, how temp affect the
rate
• B.cereus in milk model √rate=0,026*Temp-0,025 0,036
0.4
0.35
radq rate (logc/h)
0.3
0.25
0.2
0.15
0.1
0.05
0
4 6 8 10 12 14
temperature (°C)
Bc combase Bc Atcc 11778
Bc wild strain from plant Bc wild strain from cheese
Lineare (Bc combase) 34Mascarpone cheese
Secondary Model: Ratkowsky
9 30°C
8
7
6
5 25°C
logc
4 logc
3 10Fit 1 radq tasso di crescita vs tem p
2 y = 0.0222x - 0.0939
8 R2 = 0.9995
1 radq tasso di 1
0 6 crescita
logc
0 25 50 75 100
4 0.5
time (h) 2 0
0 0 10 20 30 40
0 100 200 300 12 °C
tem p (°C)
time (h)
10 radq rate vs temp Lineare (radq rate vs temp)
8
6 logc
logc
4 Fit 1
2
0
0 500 1000
time (h)
How the cooling temperature Plant company profile
affect the growth of Bc 35Not just pathogens..
Mozzarella process..
• PRODUCT CHARACTERISTICS
• Fresh cheese
• made from pasteurized whole cow’s milk
• INGREDIENTS
• refrigerated whole cow’s milk
• Calf rennet liquid
• Lyophilized starter (Streptococcus thermophilus)
• Salt
36Mozzarella
• PROCESS PHASES
• Pasteurize the milk at 72 °C for 15 seconds
• …
• Warm the curd to 82°C
• ..
• Spin the curd
• Add salt while spinning
• Form with stamps
• Cool the mozzarella with cold water
• Package in jars with preservative liquid
37Mozzarella and Pseudomonas fluorescens
48h 48h 144h
20°C 15°C 8°C
38Whole cow’s
milk
Gorgonzola DOP Pasteurization
Starter colture,
moulds, rennet
Shaping Breaking of
Curdling
curdle
Whey loss Salting Maturing
cellars
Final Maturing Piercing
check cellars
Wrapping,
Packaging
Market
39Gorgonzola and L.monocytogenes
10 L.monocytogenes in gorgonzola
L.monocytogenes su pasta di Gorgonzola.during
Dalla cagliata 35
cheese making
a fine shelf lifeand shelf-life
(temp. costante)
30
8
pH -logc(logufc/g)
25
Temperatura °C
6
20
4
15
10
2
5
0 0
0 15 30 45 60 75 90 105 120
tempo gg
logc pH limite pH temperatura °C
40Gorgonzola and L.monocytogenes
L.monocytogenes su crosta di Gorgonzola. Dalla cagliata
L.monocytogenes
a fine shelf life on gorgonzola
(temp. costante) during
cheese making and shelflife
10 35
30
pH -logc(logufc/g)
8
Temperatura °C
25
6 20
4 15
10
2
5
0 0
0 15 30 45 60 75 90 105 120
tem po gg
logc pH limite pH temperatura °C
Aw< surface then in the middle
41WWW. Ars-alimentaria.it
• Output of data collection
• Plot the behaviour of bacteria
• Check the hygiene of process
• Check the standard of process
42Conclusion
• Each process needs to be known
• “personalized HACCP”
• Detailed information
• The predictive microbiology can help
as a Quantitative microbial risk
analysis
Share the information: combase and
ars-alimentaria databank
43Many thanks for your attention…
44You can also read