Ask Dr. Arwady 12/14/2021 - City of Chicago
←
→
Page content transcription
If your browser does not render page correctly, please read the page content below
Ask Dr. Arwady 12/14/2021
More than 800,000 Americans have now died
from COVID-19.

1 of every 100 Americans age 65+ has now died
from COVID-19.
    • Now the third-leading cause of death for this age group, behind heart disease and cancer.

Chicago and Illinois are ahead of the nation in most vaccination statistics, but we continue to lag
national numbers for vaccination rates in seniors (65+).

As cases increase, it is critical that any seniors who still have not been vaccinated do so now.

                                                                                                      2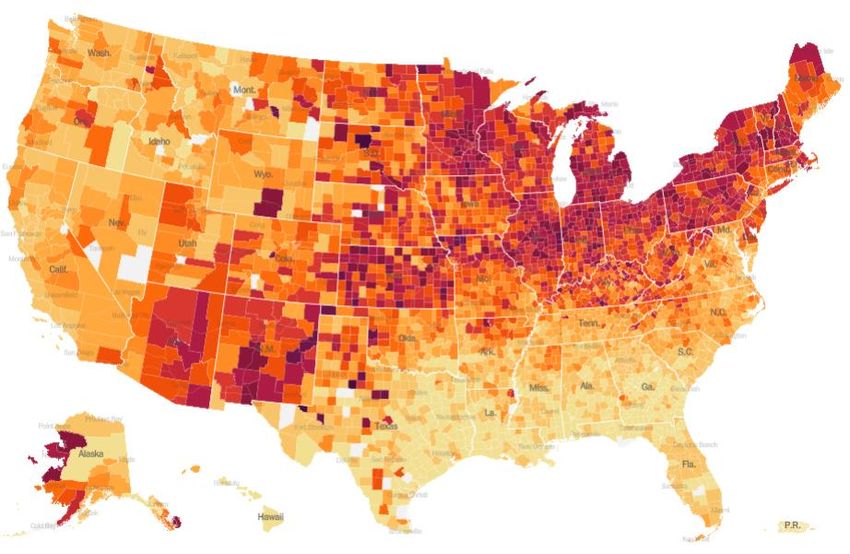
Annual number of deaths due to COVID-19 vs.
   Influenza/Pneumonia among Chicago
   residents
  3,000

                                     2,535
  2,500                                                        Six times more COVID-19 deaths during the
                                                                   previous 12 months compared to the five-year
                                                                       median of influenza/pneumonia deaths
  2,000

  1,500

  1,000

   500                                                                                           420

      0
                               COVID-19 Deaths *                                      Influenza/Pneumonia Deaths **

                    Deaths from 12/4/2020 – 12/3/2021                                     2015-2019 5-year median
Sources:
* https://www.chicago.gov/city/en/sites/covid-19/home/covid-dashboard.html
** https://chicagohealthatlas.org/indicators/VRFLU?topic=influenza--pneumonia-mortality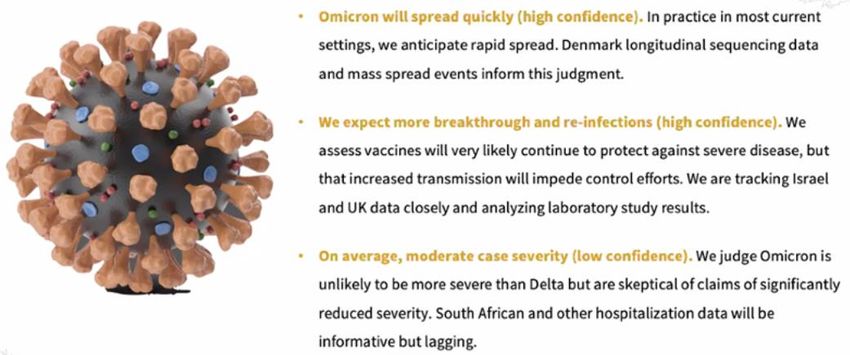
Average daily COVID-19 cases per 100,000 population

268 Million Cases
5.3 Million Deaths

 8.3 Billion Vaccine
 Doses Administered

  4.4 Billion People
    Vaccinated
 (57% of population)

Presented by the New York Times 12/9/2021; Sources: Local governments; The
Center for Systems Science and Engineering at Johns Hopkins University; National
Health Commission of the People's Republic of China; World Health Organization.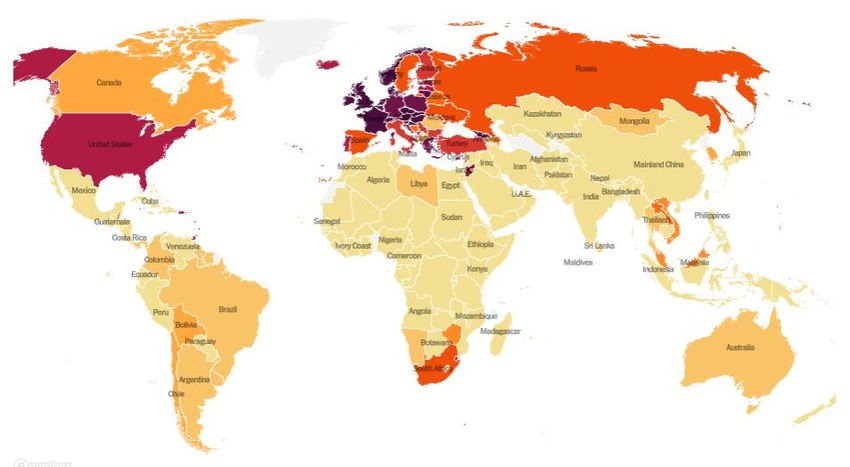
Chicago's COVID-19 Travel Advisory: 42 States
        and D.C.
   AK               WA                                       ND
                                             MT
                                                                            MN
                                                                                                                                             ME
                                                                                           WI
                                                             SD                                                                    VT
                   OR                                                                                  MI
                                  ID                                                                                                             NH
                                                   WY
                                                                                                                            NY               MA
                                                                                 IA
                                                              NE                                                                            RI
                                                                                                                       PA
                             NV                                                             IL    IN        OH                            CT
                                                                                                                                        NJ
                                       UT               CO                                                                         DE
                                                                   KS                                            WV
                                                                                      MO                                         MD
                                                                                                      KY              VA
                        CA
                                                                       OK                        TN                   NC
                                                                                      AR
                                       AZ
                                                        NM
                                                                                                                 SC
                                                                                                                                         As of today,
                                                                                      LA
                                                                                           MS    AL         GA                         California and
                                                                  TX
             HI
                                                                                                                                    Mississippi have
                                   TERRITORIES
                                                                                                                                   been added to the
                                  DC    PR        VI    GU                                                       FL
                                                                                                                                  travel advisory. No
                                                                                                                                     new states were
> 15 daily cases   Less than 15 daily                                                                                                       removed.
   per 100k         cases per 100k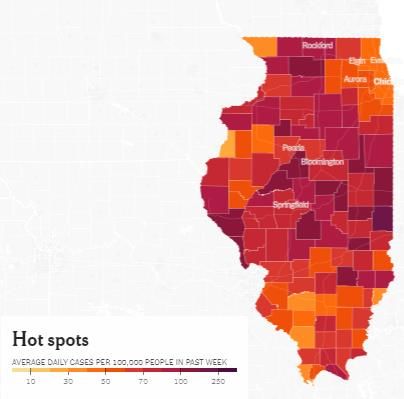
Average daily COVID-19 cases per 100,000 population
                                                      49 Million Cumulative Cases
                                                      791,933 Cumulative Deaths

                                                                                    National currently:
                                                                                    35 diagnosed daily
                                                                                    cases per 100,000 people

                                                                                    Illinois currently:
                                                                                    56 diagnosed daily
                                                                                    cases per 100,000 people

                                                                                    Chicago currently:
                                                                                    33 diagnosed daily
                                                                                    cases per 100,000 people

Presented by the New York Times 12/9/2021;
Sources: Local governments; The Center for Systems
Science and Engineering at Johns Hopkins University
Average daily COVID-19 cases per 100,000 population

                                     National currently:
                                     35 diagnosed daily
                                     cases per 100,000 people

                                     Illinois currently:
                                     56 diagnosed daily
                                     cases per 100,000 people

                                     Chicago currently:
                                     33 diagnosed daily
                                     cases per 100,000 people

                                                                7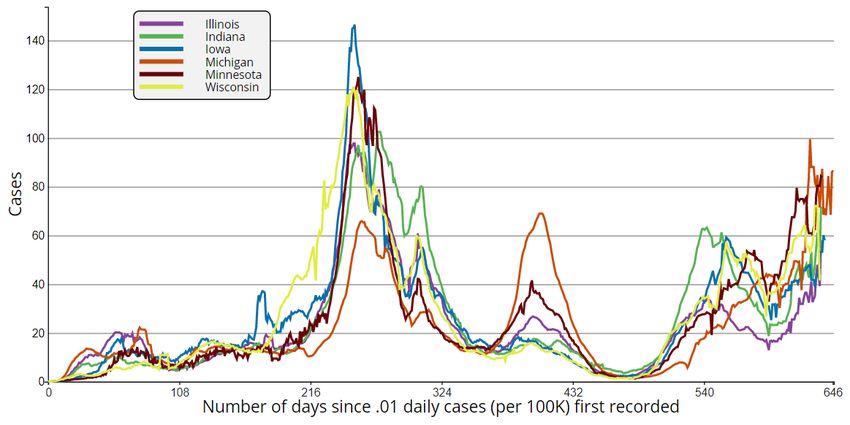
Average daily new cases per 100,000 population,
            Midwest region

                                             Case rates have tripled in Illinois
                                             since the beginning of November

                                                                                   Michigan currently
                                                                                    87 per 100,000

                                                                                     Illinois currently
                                                                                      56 per 100,000

Source: CDC COVID Data Tracker
Region 5: IL, IN, MI, MN, OH, WI
                 It’s all still Delta (For now)

https://covid.cdc.gov/covid-data-tracker/#variant-proportions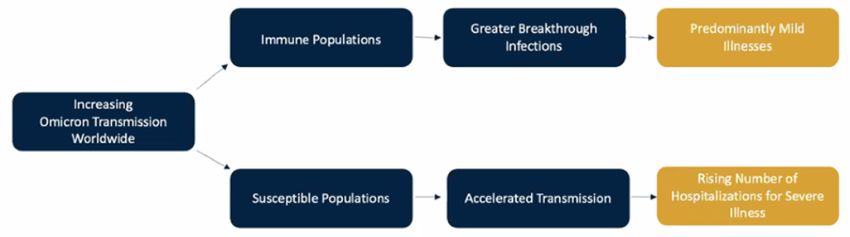
Chicago COVID-19 Community Transmission and Risk Matrix

                                                        800+
                                                  Current: 903                    400 - 799                      200 - 399                      20 - 199
Chicago: Very high case rate continues, after post-
Thanksgiving surge in cases and diagnoses
Last Thanksgiving Current average
case rate: 903
Last Christmas
11
Chi.gov/coviddashChicago: COVID test positivity continues to
increase; still adequate testing overall
Current
positivity:
4.2%
Alpha
Variant Delta
surge Variant
surge
12
Chi.gov/coviddashDistribution of Chicago COVID-19 cases by age group and
by race/ethnicity did not change notably after
Thanksgiving
(no subgroups disproportionately affected by post-holiday surge)
PERCENT OF CASES IN EACH AGE GROUP
2 weeks before the
11/7/21-11/20/21
week of Thanksgiving
11/28/21-12/9/21
2 weeks after the
week of Thanksgiving
0 10 20 30 40 50 60 70 80 90 100
0-4 5-11 18-39 40-64 65+
PERCENT OF CASES IN EACH MAJOR RACE/ETHNICITY GROUP
2 weeks before the
11/7/21-11/20/21
week of Thanksgiving
2 weeks after the
11/28/21-12/9/21
week of Thanksgiving
0 10 20 30 40 50 60 70 80 90 100
ASIAN BLACK HISPANIC OTHER UNKNOWN WHITE
Data source: Illinois National Electronic Disease Surveillance System (I-NEDSS), pulled 12/9/2021COVID CASE rates remain higher among
Unvaccinated compared to Fully Vaccinated
Chicagoans.
Since the week of Thanksgiving,
infections are
Unvaccinated
THREE TIMES AS LIKELY
in unvaccinated Chicagoans
Fully
vaccinated
Notes:
Includes cases among Chicago residents reported into the Illinois Electronic Disease Surveillance System (I -NEDSS) with date of specimen collection 2/28/2021-12/4/2021, pulled 12/9/2021.
Vaccination status obtained from the Illinois Comprehensive Automated Immunization Registry (I-CARE) registry. Fully vaccinated defined as completion of vaccine series at least 14 days prior to a
positive test (with no other positive tests in the previous 45 days). Rate for vaccinated calculated as total cases divided by cumulative vaccinated at the end of each week, multiplied by 100,000. Rate
for unvaccinated calculated as total cases divided by total population minus cumulative vaccinated at the end of each week, multiplied by 100,000.COVID HOSPITALIZATION rates remain higher
among Unvaccinated compared to Fully Vaccinated
Chicagoans.
Since the week of Thanksgiving,
risk of hospitalization among unvaccinated Unvaccinated
Chicagoans is FIVE TIMES higher
Fully
vaccinated
Notes:
Includes cases among Chicago residents reported into the Illinois Electronic Disease Surveillance System (I -NEDSS) with date of specimen collection 2/28/2021-12/4/2021, pulled 12/9/2021.
Vaccination status obtained from the Illinois Comprehensive Automated Immunization Registry (I-CARE) registry. Fully vaccinated defined as completion of vaccine series at least 14 days prior to a
positive test (with no other positive tests in the previous 45 days). Rate for vaccinated calculated as total cases divided by cumulative vaccinated at the end of each week, multiplied by 100,000. Rate
for unvaccinated calculated as total cases divided by total population minus cumulative vaccinated at the end of each week, multiplied by 100,000.Breakthrough COVID HOSPITALIZATIONS remain very
rare in Chicago but are most common in older
Chicagoans, especially those with underlying
conditions.
Just since Thanksgiving, unvaccinated older Chicagoans (60y+) have been SEVEN
TIMES more likely to be hospitalized with COVID than their vaccinated
Fully Vaccinated
Unvaccinated
counterparts. (breakthrough)
Notes:
Includes cases among Chicago residents reported into the Illinois Electronic Disease Surveillance System (I -NEDSS) with date of hospital admission 2/28/2021-12/4/2021, pulled 12/9/2021.
Vaccination status obtained from the Illinois Comprehensive Automated Immunization Registry (I-CARE) registry. Fully vaccinated defined as completion of vaccine series at least 14 days prior to a
positive test (with no other positive tests in the previous 45 days). Rate for vaccinated calculated as total hospitalized cases divided by cumulative vaccinated at the end of each week, multiplied by
100,000. Rate for unvaccinated calculated as total hospitalized cases divided by total population minus cumulative vaccinated at the end of each week, multiplied by 100,000.COVID DEATH rates remain higher among
Unvaccinated compared to Fully Vaccinated
Since the week of Thanksgiving,
Chicagoans. risk of death among unvaccinated
Chicagoans is FIVE TIMES higher
Unvaccinated
Fully
vaccinated
Notes:
Includes cases among Chicago residents reported into the Illinois Electronic Disease Surveillance System (I -NEDSS) with date of specimen collection 2/28/2021-12/4/2021, pulled 12/9/2021.
Vaccination status obtained from the Illinois Comprehensive Automated Immunization Registry (I-CARE) registry. Fully vaccinated defined as completion of vaccine series at least 14 days prior to a
positive test (with no other positive tests in the previous 45 days). Rate for vaccinated calculated as total cases divided by cumulative vaccinated at the end of each week, multiplied by 100,000. Rate
for unvaccinated calculated as total cases divided by total population minus cumulative vaccinated at the end of each week, multiplied by 100,000.Breakthrough COVID DEATHS remain very rare in Chicago
but are most common in older Chicagoans with underlying
conditions.
Just since Thanksgiving, unvaccinated older Chicagoans (60y+) have been
SEVEN TIMES more likely to die from COVID than their vaccinated
counterparts. Fully Vaccinated
Unvaccinated
(breakthrough)
Notes:
Includes cases among Chicago residents reported into the Illinois Electronic Disease Surveillance System (I -NEDSS) with date of death 2/28/2021-12/4/2021, pulled 12/9/2021.
Vaccination status obtained from the Illinois Comprehensive Automated Immunization Registry (I-CARE) registry. Fully vaccinated defined as completion of vaccine series at least 14 days prior to a
positive test (with no other positive tests in the previous 45 days). Rate for vaccinated calculated as total case deaths divided by cumulative vaccinated at the end of each week, multiplied by 100,000.
Rate for unvaccinated calculated as total case deaths divided by total population minus cumulative vaccinated at the end of each week, multiplied by 100,000.Breakthrough Cases Increasing but Remain
Rare
• 98.5% of fully vaccinated Chicagoans have NOT
subsequently tested positive for COVID-19
• 99.97% have NOT subsequently been hospitalized for
COVID-19
• 99.99% have NOT subsequently died due to COVID-19
• 24,652 breakthrough cases identified out of 1,682,539 (1.5%) Chicagoans fully vaccinated*
• Of these, 575 COVID-related hospitalizations with an additional 391 cases under investigation
• Of these, 147 COVID-19 related deaths
Data reported through 12/08/21
*Completed an FDA authorized vaccine and at least 14 days have passed since the last dose was administeredOmicron: Key judgements based on synthesis
of preliminary information (from partners at
BlueDot)
Source: BlueDotOmicron: Key judgements based on synthesis of
preliminary information about Omicron; still
collecting information
Anticipated evolution (impressions may change with more data)
In preparation for the upcoming holidays:
• Get vaccinated AND booster doses before the holidays!
• Consider use of rapid tests prior to participating in gatherings/parties
• Maintain or improve other mitigation steps (e.g. masking, ventilation)
Source: BlueDot22
Vaccine administration back up to >100,000
             doses per week, highest since May
             250,000

             200,000
                                              87%
                          84%
             150,000
                                                                 71%                 69%
                                                                                                         65%
             100,000                                                                                                        57%

              50,000                                                                                                                           38%

                    0

                                                                        Week of Administration, Ending Date

                                  Hospital       FQHC        Outpatient       Pharmacy         Public Health       Urgent Care        Other

Data reported through 12/8/21. Doses administered by Chicago providers. As of 8/31/21, valid third doses given since 8/13/21 are included in total dose counts.
Chicagoans who received a booster dose of
COVID-19 vaccine (n=439,515) Booster administration bounced
back after Thanksgiving.
12000 11/26
10000
8000
8403
6000
4000
2000
0
Count 7-day rolling average
Data as of 12/8/2021. The count of people who received a booster dose includes anyone who is fully vaccinated and has received another dose 24
of COVID-19 vaccine since August 13, 2021. This includes people who received booster doses and people who received additional doses.Percent of fully vaccinated population* that
received a booster dose
United States Chicago
Population ≥ 18 years 26.9% 28.7%
Population ≥ 50 years 38.0% 39.7%
Population ≥ 65 years 49.1% 51.5%
*Not all may be due to receive a booster dose
Data as of 12/8/2021. The count of people who received a booster dose includes anyone who is fully vaccinated and has received another dose of
COVID-19 vaccine since August 13, 2021. This includes people who received booster doses and people who received additional doses. 25
United States source: https://covid.cdc.gov/covid-data-tracker/#vaccinations_vacc-people-additional-dose-totalpop. Accessed 12/9/2021Booster uptake among those due for a booster dose
highest among oldest Chicagoans; largest increase
among 30-59 year-old Chicagoans last week
0.0 10.0 20.0 30.0 40.0 50.0 60.0 70.0 80.0 90.0 100.0
80+ yrs 5.7 58.1
70-79 yrs 5.3 61.1
60-69 yrs 6.1 50.1
50-59 yrs 6.5 37.3
40-49 yrs 6.5 34.7
Increase from last week
30-39 yrs 6.6 33.5
18-29 yrs 4.7 20.1
Data as of 12/8/2021. The population due for a booster is determined by the length of time from last dose and type of vaccine received for the primary
series. The count of people who received a booster dose includes anyone who is fully vaccinated and has received another dose of COVID-19 vaccine 26
since August 13, 2021 as reported in I-CARE. This includes people who received booster doses and people who received additional doses.Booster uptake lowest among adult Latinx
Chicagoans who are due for a booster dose
0.0 10.0 20.0 30.0 40.0 50.0 60.0 70.0 80.0 90.0 100.0
Latinx 4.8 26.2
Black, non-Latinx 5.4 35.8
White, non-Latinx 6.6 44.1
Asian, non-Latinx 6.4 39.1
Other, non-Latinx 3.9 20.4 Increase from last week
Unknown 3.3 13.0
Data as of 12/8/2021. The population due for a booster is determined by the length of time from last dose and type of vaccine received for the primary series.
The count of people who received a booster dose includes anyone 18 years and older who is fully vaccinated and has received a nother dose of COVID-19 27
vaccine since August 13, 2021 as reported in I-CARE. This includes people who received booster doses and people who received additional doses.In recent weeks (11/7-12/4), safety was the most
frequently-specified reason for not vaccinating across
race/ethnicity groups Chicago case/contact interviews
1% 2% 2% 2%
100%
Reasons for not vaccinating
90%
26% 22% 22% 24% Access: Cost, transportation,
35%
80% 43% identification or appointment issues
1%
1% 1% 1% Too young
3%
70% 2% 5% 3% 2%
2% Doesnt feel vaccine is necessary for
2… them
60% 22% 9% Religious objections
26% 24%
21%
7% 4%
50% Medical condition or provider advice
7%
40% Safety
26%
32% 28%
Refused unspecified or unknown
30% 32% 29% 31%
4% Already had COVID-19
20% 4%
3% 2% Other mistrust, skepticism or
2% 2%
10% 4% 7% 7% anxiety
1% 5% 1% 17% 5% 1%
3% Busy or have not made time
6% 2% 2% 5% 7% 4% 2%
0% 3%
Undecided, might get vaccinated
Latinx (n=576) Black, non-Latinx White, Non-Latinx Asian, non-Latinx Other, non-Latinx All (n=1,973)
(n=850) (n=287) (n=14) (n=23) Plans to, is now interested or
scheduled
Race/Ethnicity
Interviewees of unknown race/ethnicity: 11% of unvaccinated (n=223), included in ‘All’ column onlyUnvaccinated interviewees ages 65+ cite provider
advice
or concerns about other medical conditions
Chicago case/contact interviews
1% Reasons for not vaccinating
100%
3% 3% 1% 3% 2%
5% 1% Access: Cost, transportation,
3% 2%
90% 5% identification or appointment issues
15% 1% 2%
24% Too young
1% 21%
80%
26%
1%
Doesnt feel vaccine is necessary for
30% them
70% 3% 2% Religious objections
60% 32%
21% Medical condition or provider advice
60%
24%
50%
Safety
44% Refused unspecified or unknown
40% 38%
33% Already had COVID-19
30% 11% 38% 31%
Other mistrust, skepticism or anxiety
20% 2% 3% 2% Busy or have not made time
15% 11% 2%
8%
10% 3% 3% 12%
2%
2% 3% 1%
5% Undecided, might get vaccinated
1% 1%
3% 1% 2% 6% 3%
5% 3% 4% 2% 4% 2%
0% Plans to, is now interested or scheduled
5-11 (n=641) 12-17 (n=348) 18-29 (n=280) 30-64 (n=580) 65+ (n=58) All (n=1,973)
Age Group
Interviewees of unknown age:30
Get Covered Illinois! Enroll by December 15th
        to have your coverage start on January 1, 2022
        • Open Enrollment goes through January 15, 2022 – however if you
          enroll after December 15, coverage will not start until February 1
        • Sign up for a free visit with a patient navigator to help you
          understand how to pick a plan!
          • Widget.GetCoveredAmerica.org

*Insurance is not required                                                     31
for COVID-19 vaccination
32
You can also read