SeqFEWS Enhancements
Delft-FEWS User Days Australia 2021
←
→
Page content transcription
If your browser does not render page correctly, please read the page content below
SeqFEWS Enhancements Delft-FEWS User Days Australia 2021
Contents
➢ Useful features from Delft-FEWS 2019.02

➢ Enhancements on existing features

➢ Next Gen Gate Ops

➢ Ongoing developments
Useful features from 2019.02

                               3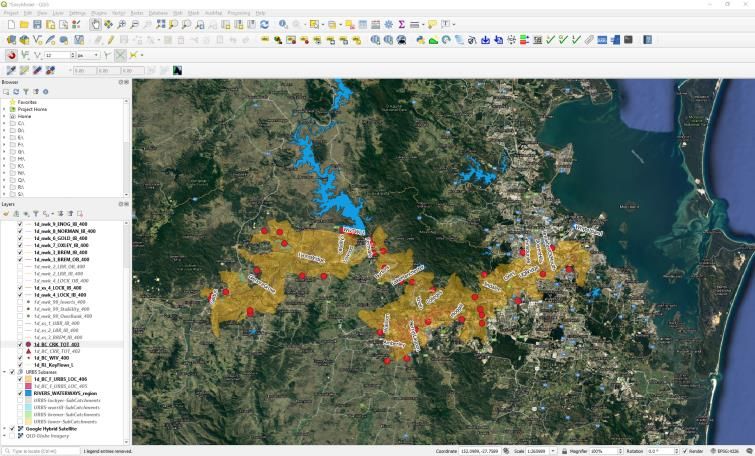
Dashboards
• Comparing Forecast Rainfall Products

                                         4
Dashboards
                            Point & grid
  • Rainfall Monitoring   rainfall in last 3
                               hours

   Catchment
average rainfall                                ADFD 25%
 in last 3 hours                               Fcst rainfall in
                                                next 3 hours

                                                ADFD 25%
   Catchment
                                                 catchment
average rainfall
                                                average fcst
in last 12 hours
                                               rainfall in next
                                                  12 hours

                                                            5
Time series resampling

                         6
Dynamic timeseries thresholds based on accumulation
period

                            Between 1 in
                            10 to 1 in 20

                                                      7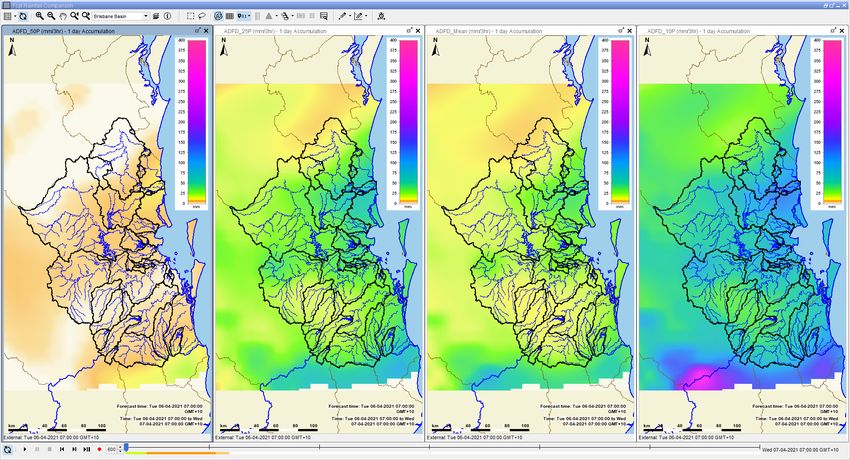
Dynamic timeseries thresholds based on accumulation
period

                            Between 1 in
                            20 to 1 in 50

                                                      8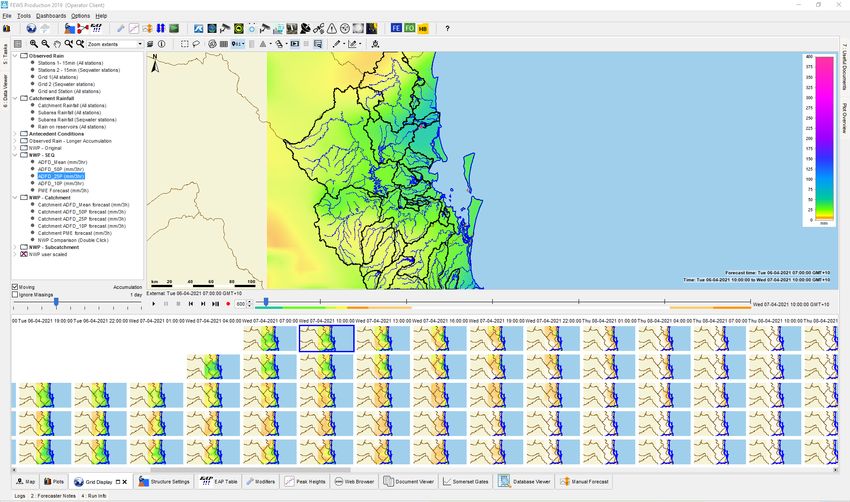
Dynamic timeseries thresholds based on accumulation
period

                             Between 1 in
                             10 to 1 in 20

                                                      9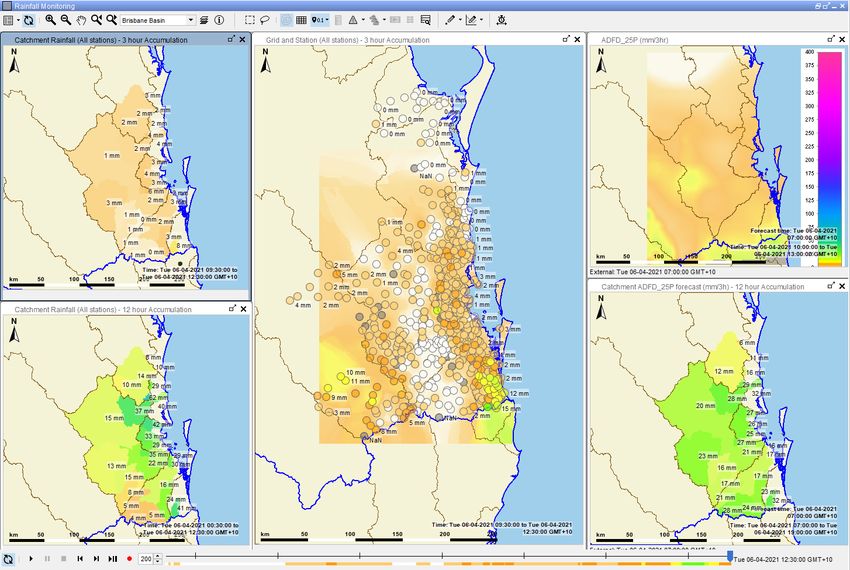
Search and Select forecasts

                              10
Enhancements on existing functions
11Further improvements on using templates
To run multiple
ensemble model runs in
different folders in
parallel.
New tag added to
integrate special runs
such as WaterCoach
training workflows
12Further improvements on using templates
No. of files if not using No. of file after using
templates templates
URBS Model Module Files 120 37
URBS Model Historical 58 9
Ensemble Runs
RTC Reservoir Model 54 23
Module Files
WaterCoach Training 42 15
Module Files
13Direct BoM FTP import of Observed Data
• A great redundancy for observed data.
– Contributes about 10% of the total data count in each 15 minutes time step.
– Great for server maintenance.
Observed Water level Count Observed Rainfall Count
BoM_FTP contributes ~10% data in average BoM_FTP contributes ~12% data in average
14Back up of the back up
• Operational standalone
– Standalone FEWS System
– Including the latest forecast data and observed data in last two weeks.
– Can be used by multiple people at the same time.
– Sharing database over a local network using the Master and Participates
method.
This is a real event
• Working from home.
• Home internet was fine.
• Access to Corporate datacentre was
down.
• Access to Corporate OneDrive was fine.
➢ Download the Operational Standalone
from OneDrive.
➢ Running the system on home network.
➢ Getting the latest observed data from
direct BoM FTP Feed.
15Next Gen Gate Ops
16One step forward • First investigation commenced in 2015. • Adopted in the operational configuration (for testing) in late 2020. • Adopted the Three Nodes approach. – Planning Node: Automatic release plan development (RTC Tools). – Adjusting Node: User to fine tune the gate settings (RTC Tools). – Reviewing Node: Review the potential downstream impacts (URBS).
Design philosophy

                                                             Simplify change
                                                              management.
     Capable of
      operating
     throughout                              Easy to
    emergencies.                              use                              Clear presentation all
                                                                                critical information.
                               Handle the
                                                         Clear to
                                unlikely
                                                           see
                                events

  Ability to handle                         Next Gen
                                            Gate Ops                               Capture critical
    changes in                                                                 decisions, who makes
 operating rule and                                                                them and what
 dam configuration.            Flexible &                Able to
                                Robust                    track                   information was
                                                                                      available.
                                             Situation
                                            awareness

               Highlight key issues,
                    e.g. gates
                   overtopping

                                                                                                    18
Workshops and trainings
• Multiple workshops with the selected engineers
(focus group)
– Useability and underlying assumptions.
– Testing and validation of edge cases.
– Graphical representations.
– Additional scenarios, e.g. gates failure.
Modifying gate settings overview
• Multiple workshops with all engineers 1. Run key models
a)
b)
Upper Brisbane
Lower Brisbane
2. Adjust Moggill
target flow
a) Review Guide Curve
3. Adjust, Adopt and Approve settings
a)
i.
Run Gate Adjusting
Review (plot 1, 2, 3 & 5)
– Introduction to the system.
c) Gate Planning (Node 1) ii. Adjust settings
b) Adjust target flow
modifier iii. Repeat
c) Rerun, repeat
Right click → Add comment
[to lock-in gate settings]
– Development of modelling procedures. b) Run Lower Bris
Routing Review
– Receive further feedbacks.
i. Review results
c
c) Run Approved Run
i. Review plotting
position of Guide
Curve
b
• Further workshops / trainings
– Simulated synthetic flood events.
– Testing the system at different stage of a flood
event.
19Report
• Working on a comprehensive report to capture the model logics, data I/O,
assumptions and etc.
User defined target flow, drain down User Defined Drain User Defined Drain
WD Lvl (T-1) WD Qout (T-1) and gates failure are only applicable to Down Period Down Duration
time steps beyond T0
Lowood local flow WD
Lowood
(Dam Time) + WD Opening True
Total Q
Outflow Interval
If WD Lvl >= 75,
adjust opening and
closing interval
WD Closing
True
Interval
Check if SDWD combined volume is greater SDWD
than the previous peak volume. Set V combine Combined V combine
counter to 0 if a new peak is identified, Peak counter
otherwise +1. Volume
Check if there is a new peak flow at Moggill.
Peak flow at
Only check the peak if the drain down strategy
Moggill
is triggered
Check if drain down
has started Check if there is an
False user defined drain
Continue DD and reduce drain down duration True down period
by 1 hour
True False
Check if V combine counter is > 12 and WD
Start drain down and use user defined drain level has fallen by 1 meter from the peak level.
down period and duration if the computation If both conditions are met, start drain down
time step is after T0. and using default drain down duration (168
hours).
DD
DD Start
Duration
20Use of Modifiers
• Save and track engineer’s decisions
through out a flood event.
• Handle the unlikely scenarios. Also
useful for scenario testing.
21Use of plots
• Scatter plot with coloured background
– Visualising historical strategies
– Understand the current strategy
– Tooltip text
22Use of plots
• Customised plot to present additional information
– Customised axis labels 14 timeseries
– Customised plot weights in the plots
– User defined visibilities
4 timeseries
in the table
23User of plots
• Customised plot to present additional information
– Consistent colour and line styles.
– Combine different plot types to highlights the information.
Combination of
line and area
24Use of plots
• Situation awareness
– Highlight any abnormal status, e.g. gates overtopping
Top of the
gates
Simulated
lake level
25Side products
• Export and Email predictions in one click.
26Ongoing projects
27Next Generation Hydraulic Model for Lockyer & Lower Brisbane • Based on the Fast Model from Brisbane River Catchment Flood Study. • Modified input locations to improve run time. • A great collaboration with BMT to develop the post adaptor and additional functions. • Under UAT.
FEWS Calibration dataset
• A Standalone SeqFEWS platform which contains observed data from multiple
  sources.
• Observed rainfall data sets are semi-cleaned (up to 90%) using the Spatial
  Homogeneity function in Delft-FEWS.

                               Previous Calibration    With the New FEWS
                                                       Calibration Dataset
  Identify historical events   Only based on water     Based on both water
                               level                   level and rainfall
  Data availability            Varies for each         1841 – 2016 +
                               catchment
  Calibrated parameters        α, β, IL, CL            + ILR, BR, BC
  Report ready outputs         Very limited             HTML Report, plots, csv
❖ Ability to rerun all events with the event-based parameters or a single set of
  parameters in one click.
You can also read


