Actuarial Weather Extremes April 2019 - soa
←
→
Page content transcription
If your browser does not render page correctly, please read the page content below

Actuarial Weather Extremes April 2019
1

Actuarial Weather Extremes: April 2019
Spring Storms and a Trail of Rain, Snow and Temperature Extremes

Overview
The Society of Actuaries (SOA) has developed a Weather Analysis Tool (“WAT”) that examines data from the Global
Historical Climate Network (GHCN) to identify and summarize unusual or extreme single-day or multi-day weather
events. Using results produced by WAT, the SOA intends to issue periodic reports that highlight extreme weather
events occurring in North America. This report – the first produced using WAT – describes two major weather
events that occurred in April 2019.

The GHCN database is hosted by the National Oceanic and Atmospheric Administration (NOAA) and is available for
download from NOAA’s website. The data provides daily weather observations from over 100,000 weather stations
worldwide, covering more than 180 countries. Of these, this report focuses on approximately 2,500 weather
stations in North America that have consistently provided daily temperature, precipitation and snowfall data back to
1960. The lengthy data histories make it possible to rank daily observations against their corresponding historical
distributions. Ranking, in turn, facilitates an assessment of whether an observation is at routine level or whether it is
extreme.

Our analysis focuses on four weather variables provided by the GHCN data: TMAX, TMIN, PRCP and SNOW, which
are, respectively, the daily maximum temperature, the daily minimum temperature, daily precipitation, and daily
snowfall. Looking at these four metrics, this paper provides an analysis of certain weather events and patterns that
occurred in April that were found to be extreme versus historical “norms”.

The data used in this analysis was downloaded on May 6th. Therefore, because most of the GHCN stations included
in this analysis have a reporting lag of merely one or two days, the data for April is sufficiently complete.

This paper, as well as future WAT papers, will be brief, focusing solely on major weather events. To cater to those
readers whose interest extends beyond these major events, we are developing an Excel tool that will contain
records summarizing recent and historical weather for each of the 2,500 stations. We expect to have the Excel file
ready for public distribution by August 2019. Each future paper will be released in tandem with an updated version
of the Excel file.

Methodology for Ranking Each Daily Weather Observation
To rank each daily observation, we use data back to 1960 that falls within a 10-day radius of the particular day of
interest. For example, consider a TMAX observation of 51°F recorded on April 15, 2019 for a weather station in
Chicago. To rank this observation, a TMAX distribution is compiled from the station’s 1960 to 2018 historical data,
using observations from dates between April 5 and April 25. Against this empirical distribution, the April 2019
observation of 51°F falls at the 25th percentile, indicating that while this was a relatively cool day, it wasn’t
“extreme”.

Using this ranking approach, WAT scans the GHCN data, searching for extremes. While there is no strict definition of
“extreme”, WAT is typically used to flag observations that have a rank of 3% or less, or a rank of 97% or greater.

                                                                                                Copyright © 2019 Society of Actuaries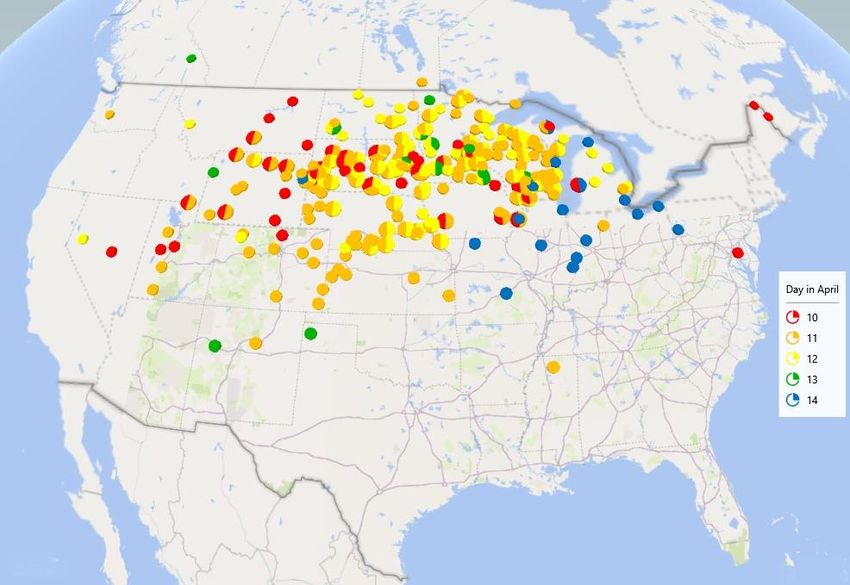
2

The scan of the April 2019 GHCN data revealed two major events in North America: (1) the “bomb cyclone” which
hit the United States (U.S.) Midwest between April 10 and April 13, and (2) a storm that dropped heavy rain in the
Southern and Eastern U.S. between April 17 and April 21. We examine these two events in the remainder of this
paper.

“Bomb-Cyclone”: Extreme Temperature Swings, Snow in the U.S. Upper Midwest
Perhaps the most dramatic North American weather event in April 2019 was the “bomb cyclone” that swept across
the Upper Midwest of the U.S. between April 10 and April 13. A bomb cyclone is a powerful, rapidly developing
storm that brings with it an abrupt drop in barometric pressure, high winds, and heavy precipitation. In this case, the
precipitation fell in the form of snow across a total of more than 20 U.S. states.

Among the 2,500 weather stations included in our analysis, 249 experienced 24-hour snow totals that exceeded the
97th percentile of their historical distributions (Figure 1). The average multi-day snowfall across these stations was
7.0 inches, but some stations received more than two feet of snow (Table 2).

In addition to significant snow accumulations, the storm brought with it a rapid change in temperatures. As the
system passed through, temperatures abruptly shifted from spring-like to quite cold, followed by a return to spring-
like weather.

Figure 1
Stations that experienced a 24-hour snowfall above the 97th historical percentile

                                                                                               Copyright © 2019 Society of Actuaries
3
Table 1
Stations that received more than two feet of snow during the bomb cyclone
Latitude Longitude Snow
Station State
North West (inches)
RAINIER SUNSHINE POINT WA 46.7 121.9 33.0
DEWEY SD 43.5 104.0 26.5
COLOME SD 43.3 99.7 26.3
MINNEAPOLIS NAS MN 44.9 93.2 25.0
Table 2
Temperature change and snow fall around event period for Colome, South Dakota
High High
Snow
Day of April Temperature Temperature
(Inches)
(F) Rank %
9 66.0 81.9% 0.0
10 50.0 41.0% 4.3
11 27.0 1.6% 13.5
12 26.1 1.1% 8.5
13 28.0 1.8% 0.0
14 32.0 4.0% 0.0
15 39.0 10.9% 0.0
16 46.0 21.8% 0.0
17 55.9 46.7% 0.0
Figure 2
Temperature change around event period for Colome, South Dakota
Copyright © 2019 Society of Actuaries4
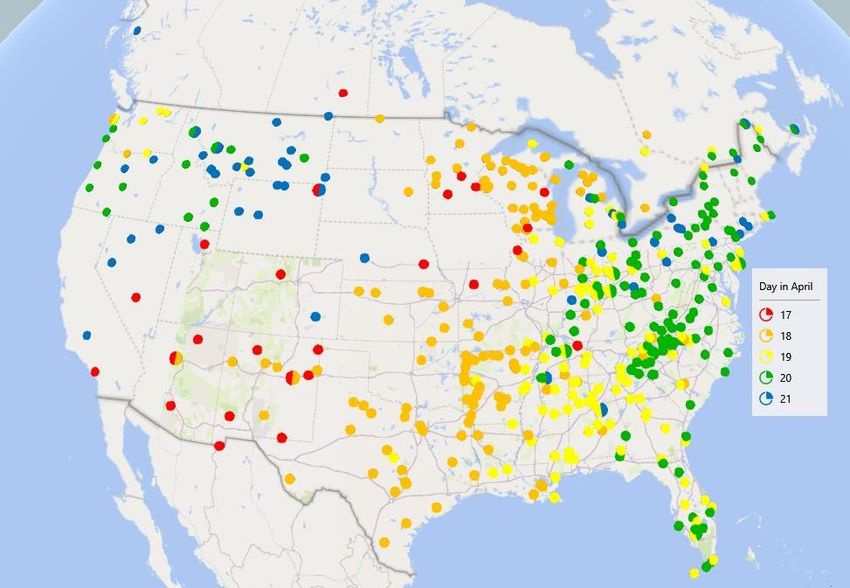
Extreme Precipitation / Storms in Southern and Eastern U.S.: April 17-21
A large weather system moved across the U.S., from West to East, from April 17 through April 21. The system
caused tornadoes in Texas, Oklahoma and Kansas on April 17, followed by tornadoes in Mississippi on April 18. On
April 19, the system arrived on the east coast, where it triggered additional tornadoes in several states.
The system dropped a significant amount of rain. Nearly 450 of the 2,500 stations included in this analysis recorded
24-hour rainfall totals in excess of the 97th percentile of their historical precipitation distributions (Figure 3). Across
these stations, the average total rainfall for the period analyzed was 1.7 inches. A number of stations received in
excess of five inches of rain (Table 3).
Figure 3
Stations that experienced a 24-hour rainfall above the 97th historical percentile
Table 3
Stations receiving more than five inches of rain from April 17 to 21
Latitude Longitude Rain
Station State
North West (inches)
PISGAH FOREST 8 W NC 35.3 82.8 7.30
BRIDGEWATER HYDRO NC 35.7 81.8 6.90
WALTERBORO 1 SW SC 32.9 80.7 6.22
FT SMITH RGNL AP AR 35.3 94.4 5.44
MACON MIDDLE GA RGNL AP GA 32.7 83.7 5.31
CHILDERSBURG AL 33.3 86.4 5.11
Copyright © 2019 Society of Actuaries5
SOA Research Team for This Report
Patrick Wiese, ASA and Rob Montgomery, ASA, MAAA, FLMI
About the Society of Actuaries
With roots dating back to 1889, the Society of Actuaries (SOA) is the world’s largest actuarial professional
organization with more than 30,000 actuaries as members. Through education and research, the SOA advances
actuaries as leaders in measuring and managing risk to improve financial outcomes for individuals, organizations,
and the public.
As part of its work, the SOA seeks to inform public policy development and public understanding through research.
The SOA aspires to be a trusted source of objective, data-driven research and analysis with an actuarial perspective
for its members, industry, policymakers and the public. This distinct perspective comes from the SOA as an
association of actuaries, who have a rigorous formal education and direct experience as practitioners as they
perform applied research. The SOA also welcomes the opportunity to partner with other organizations in our work
where appropriate.
Society of Actuaries
475 N. Martingale Road, Suite 600
Schaumburg, Illinois 60173
www.SOA.org
Copyright © 2019 Society of ActuariesYou can also read