Nearshore Habitat Mapping in Puget Sound Using Side Scan Sonar and Underwater Video
←
→
Page content transcription
If your browser does not render page correctly, please read the page content below
Woodruff and others: Nearshore Habitat Mapping Using Side Scan Sonar and Underwater Video

Nearshore Habitat Mapping in Puget Sound Using Side Scan
Sonar and Underwater Video
Dana Woodruff, Paul Farley, Amy Borde, John Southard, Ron Thom
Battelle Marine Sciences Laboratory

Jim Norris
Marine Resources Consultants

Sandy Wyllie-Echeverria
University of Washington

Debra MacLellan, Randy Shuman
King County Department of Natural Resources

Introduction
King County has initiated environmental studies on the northern King County and southern Snohomish
County portion of the nearshore environment in Puget Sound to support the siting of a new wastewater
treatment plant outfall. The primary objective of our study was to develop accurate maps of nearshore
habitat resources within the Snohomish/King County study area. The results of the study provide a critical
basis for assessing the aquatic habitats and fisheries resources within the nearshore zone (defined as +1m to
–30m mean lower low water [MLLW] between Shilshole Marina in Seattle and Picnic Point, slightly north
of Edmonds (Figure 1). The depth range was selected to cover low intertidal and shallow subtidal habitats,
including potential rockfish habitat. Our report, presented to King County (Woodruff and others 2001),
documents in detail the methods used to map the nearshore environment and provides georeferenced maps
and summary tables of substrate, vegetation, fish, and macroinvertebrates. Additional information on the
status of site selection is available at http://dnr.metrokc.gov/wtd/brightwater/. A summary of the project is
provided in this paper.

Methods
Twenty-two contiguous kilometers of nearshore habitat were mapped in the study area during the fall of
1999 using a combination of side scan sonar and underwater video technologies. The study area was
divided into 12 subareas (A through L) for ease of data collection and analysis (Figure 1). All data were
collected along predetermined survey track lines. Sonar track lines were set parallel to shore, with 85 m
between survey lines and an approximate 40 percent overlap. A GeoAcoustics LTD dual-frequency side
scan sonar system was towed to collect real-time, geo-referenced, seafloor mosaic data with overlapping
edges matched to form a continuous profile of the bottom. An underwater video camera was towed on
survey track lines parallel to and 15 m shoreward of the sonar tracklines. Video footage was also collected
from 70 tracklines perpendicular to shore in areas selected by King County. All video data was recorded
with the geographic position digitally overlaid on the video signal, allowing georeferenced post-processing
of the data at a later date.

The side scan sonar was used to delineate edges of eelgrass beds and areas of sparse, patchy, or dense
eelgrass (Zostera marina), and substrate type. An example of a side scan sonar image showing eelgrass
patches is shown in Figure 2. The underwater video was used to verify the signature observed in the sonar
imagery, and to map the presence and location of kelp beds (Nereocystis luetkeana), other macroalgae,
benthic macroinvertebrates and fish. The side scan images, combined with the video footage were post-
processed to develop GIS map layers of these resources.
Puget Sound Research 2001
eelgrass
dock
eelgrass
Figure 2. Example of side scan sonar mosaic from the study area, with eelgrass and dock delineated.
Results
A total of 144 km of video data and 1033 hectares of side scan sonar data were collected during the survey.
The dominant substrate type was sand, occurring in 90% of the study area. A mixed coarse substrate that
included gravel, shell, and/or cobble occurred to a lesser extent (9% of the study area) and was generally
noted close to shore with a few exceptions. Rocky habitat was negligible in the study area. Eelgrass
occurred in all subareas (A through L), covering approximately 260 hectares (23% of the study area).
Eelgrass occurred to a depth of –7m MLLW with dense coverage (80 hectares) often associated with a
steeper slope, and moderate or patchy coverage (126 hectares) associated with a shallow slope. Sparse
eelgrass coverage (50 hectares) was usually found on the inner (shallow) or outer (deep) edges of denser
eelgrass meadows. Kelp was negligible (2.6% of the study area) with the exception of several areas,
including the Edmonds Underwater Marine Park where its extensive presence precluded towing and was
not included in the mapped area. Approximately two thirds of the kelp occurred in mixed coarse substrate.
The rest occurred in sand, and was usually located on the outer fringes of eelgrass meadows. Ulva spp. was
present in all subareas, often in close association with eelgrass, and other species of macroalgae. An
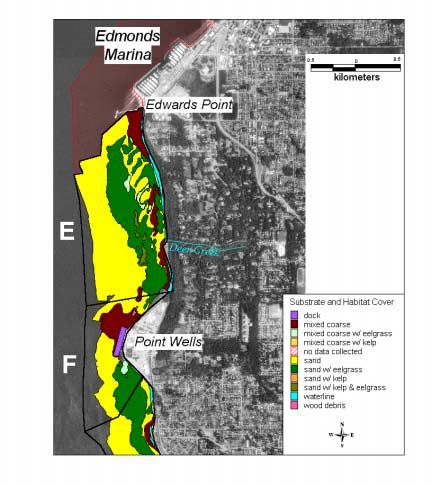
example of a GIS mapped coverage of eelgrass, kelp and substrate type from two subareas (E and F) is
shown in Figure 3.
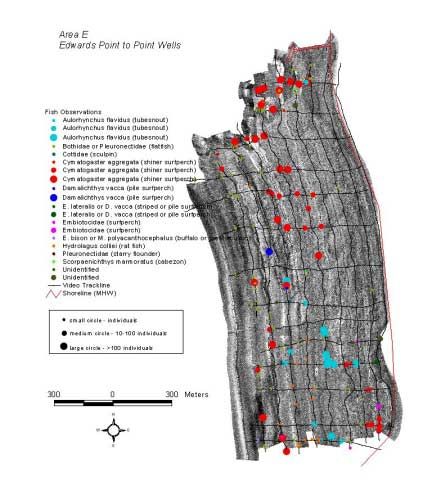
Species of fish recorded on video were identified based on their schooling or non-schooling behavior. A
total of 775 sitings of non-schooling fish were recorded on transects oriented perpendicular and parallel to
shore. Estimates of total schooling fish ranged from 16,000 and 27,000. Predominant schooling species
were tubesnout (Aulorhynchus flavidus), found primarily in eelgrass habitat, and shiner surfperch
(Cymatogaster aggregata), found in open sand habitat. Flatfish and ratfish, the most common non-
schooling species, were usually found on sand. The few rockfish and lingcod observed, occurred primarily
on sand. An example of fish species recorded from video data in one subarea (E) is shown in Figure 4. The
predominant benthic macroinvertebrates recorded on video included sea anemones (Metridium spp.),
orange sea pens (Ptilosarcus gurneyi), and various sea stars. These occurred principally in open sand
habitat.Woodruff and others: Nearshore Habitat Mapping Using Side Scan Sonar and Underwater Video Figure 3. Example of GIS mapped polygon coverage of eelgrass, kelp, and substrate type.
Puget Sound Research 2001

Figure 4. Example of fish species and location information collected with underwater video.
Woodruff and others: Nearshore Habitat Mapping Using Side Scan Sonar and Underwater Video

Conclusions
This study is the first to provide complete GIS coverage maps of major nearshore benthic habitats over a
large area in Puget Sound. The combination of side scan sonar and underwater video provided a useful tool
for conducting relatively rapid and extremely high resolution mapping of nearshore community
relationships. Side scan sonar provided high spatial resolution and accuracy for development of eelgrass
habitat and substrate maps. The underwater video provided excellent ground truthing of the sonar data, as
well as a dataset of fish, macroalgae, and macroinvertebrate locations spatially referenced to habitat type.
These data will be further analyzed and used in future studies related to the north treatment facility marine
outfall siting study process.

Acknowledgements
Funding for this study was provided by King County Department of Natural Resources under a Related
Services Agreement with the U.S. Department of Energy under Contract DE-AC06-76RLO 1830.

References
Woodruff, D.L., Farley, P.J., Borde, A.B., Southard, J.S. and Thom, R. 2001. King County Nearshore
   Habitat Mapping Data Report: Picnic Point to Shilshole Marina. PNNL Report #13396 prepared for
   King County Dept. of Natural Resources, Seattle, WA. 79 pp. (plus data appendices).
You can also read