Typical PET Image Elevated uptake of FDG (related to metabolism) - Lung cancer example: But where exactly is it located?
←
→
Page content transcription
If your browser does not render page correctly, please read the page content below
Typical PET Image
  Elevated uptake of FDG (related to metabolism)

Lung cancer example: But where exactly is it located?
PET/CT Oncology Imaging
• “Anatometabolic” fusion images are useful in
  the management of patients with cancer
  (Wahl, JNM, 1993)
• PET/CT scanners are used to provide
  accurately aligned functional and anatomical
  information (Beyer, JNM 2000)
                   recurrent thyroid cancer localized
                   to the right retropharyngeal space.
• A secondary synergy of PET/CT scanners is
  to use the CT image for attenuation correction
  of the PET emission data (Kinahan, Med Phys
  1998)
    • low-noise attenuation correction factors
    • no transmission scan -shorter total scan time
    • no bias from emission contamination of post-
      injection transmission scans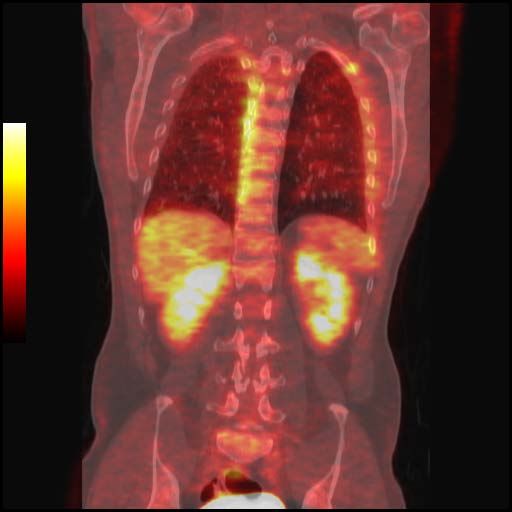
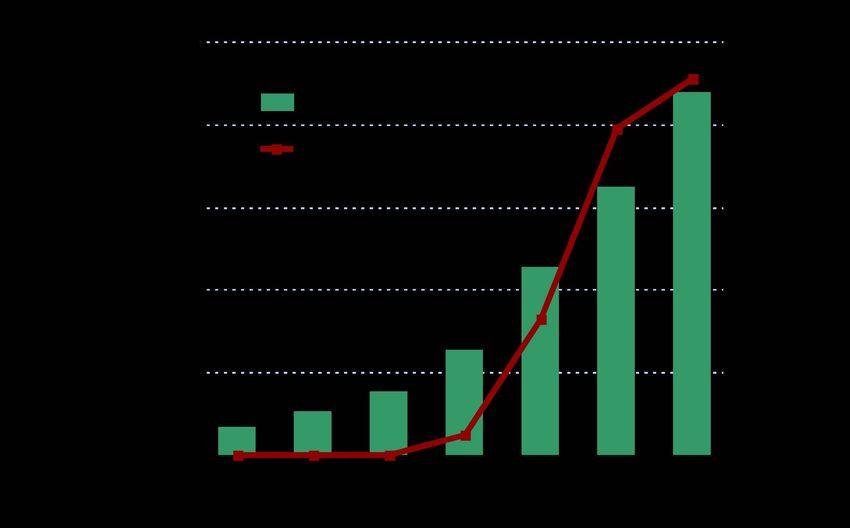
Growth of PET procedures in the U.S.

•   1998: Reimbursement for FDG-PET. 1st PET/CT prototype built
•   The number of procedures has been doubling every 19 months
•   Over 90% are FDG cancer imaging for diagnosis and staging
•   Recent figures indicate 40% annual growth in number of procedures
1998: Pittsburgh PET/CT prototype

                       PET/CT scanner

Somatom AR.SP                               ECAT ART

   CT             Fused image viewer        PET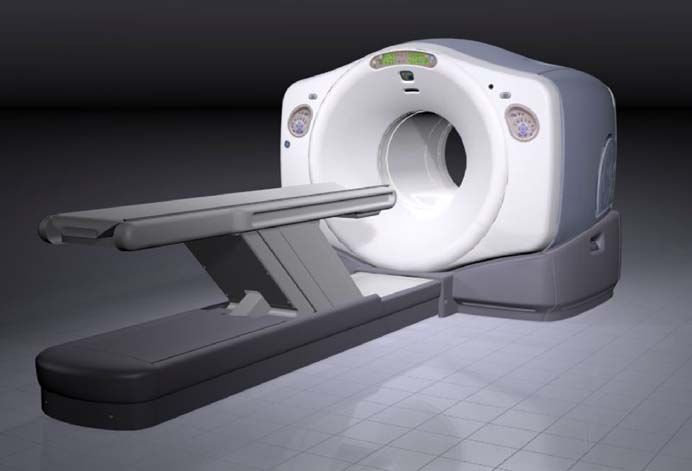
2006: Six Commercial PET/CT Scanners
   • All rely on CT-based attenuation correction

        Siemens                  Phillips             General Electric
-Biograph Pico and Hires   -Gemini, GXL, and TF   -Discovery ST and DSTE
         (LSO)                (GSO, LYSO)                  (BGO)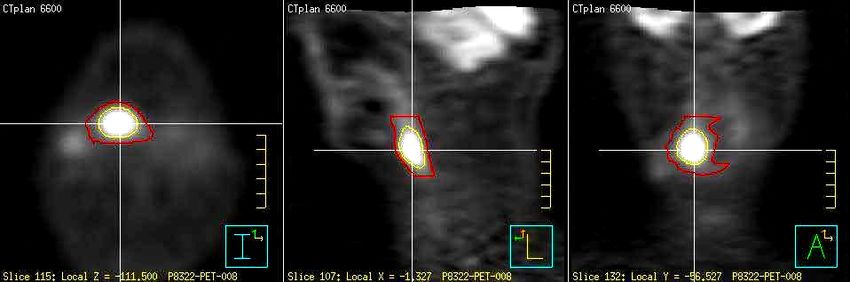
Imaging FDG uptake (PET) with
         anatomical localization (CT)
• Thyroid(?) cancer example

  Function         Function+Anatomy   Anatomy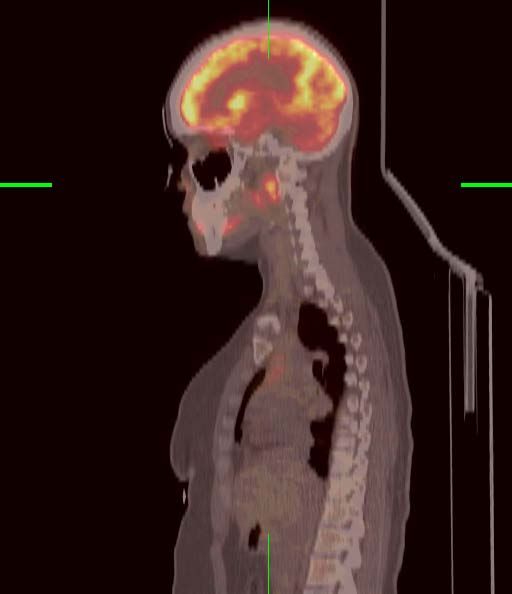
Improved Integration of PET and CT

• Scanners now support list-mode, flexible
  protocols, and improved display facilities
Basic PET/CT Architecture
Attenuation Correction
•   Transmission scanning with an external photon source is used
    for attenuation correction of the emission scan
•   The fraction absorbed in a transmission scan, along the same
    line of response (LOR) can be used to correct the emission scan
    data
•   The transmission scan can also be used to form a 'transmission'
    or 'attenuation' image
                                     same line of response                    photon source
                                        (LOR) L(s,θ)
                                                             rotation
                       y
                   s
                             t
                                 θ
                                 x
                 tracer uptake                               tissue density
                  f (x, y)
     scanner                             FOV

               Emission scan (EM)                   Transmission (TX)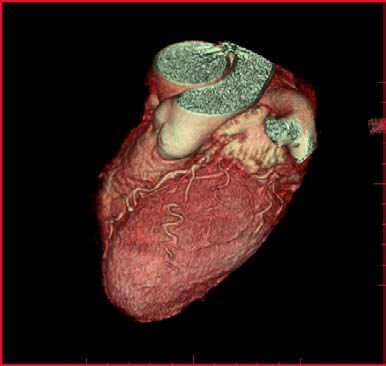
And, if you have PET/CT scanner: X-ray TX

             orbiting X-
                                                  X-ray
            ray tube and
                                                detectors
               detector
              assembly

                                  µ(x,y)
                                                        30–130 keV
                                                        X-ray photon

•   Photon flux is very high, so very low noise
•   Greatly improved contrast at lower photon energies.
•   Scatter and beam-hardening can introduce bias.
•    µ(x,y,E) is measured as an weighted average from ~30-120 keV, so µ
    (x,y,511keV) must be calculated, potentially introducing bias
X-ray and Annihilation Photon Transmission
Imaging for Attenuation Correction
X-ray (~30-120 keV) PET Transmission (511 keV)
Low noise Noisy
Fast Slow
Potential for bias when Quantitatively accurate
scaled to 511 keV for 511 keV
Transform?CT-based Attenuation Correction
• Bi-linear scaling methods apply different scale factors for bone
and non-bone materials
• Should be calibrated for every kVp and/or contrast agent
water-bone
air-water mixture
mixture
air soft tissue dense boneTypical PET/CT scan protocol
1. Scout scan 2. Selection
(5–20 sec) of scan
region
(1–2
min)
CT PET
Scout scan image
3. Helical CT 4. Whole-body PET
(20–60 sec) (6–40 min)
CT PET CT PETData flow
• CT images are also used for calibration (attenuation
correction) of the PET data
X-ray Anatomical (CT) CT
acquisition Reconstruction Image
Display
of PET
Smooth to PET Translate CT to PET
Resolution Energy (511 keV) and CT
images
PET Emission Attenuation Correct Functional (PET) PET
Acquisition PET Emission Data Reconstruction Image
• Note that images are not really fused, but are displayed
as fused or side-by-side with linked cursorsPotential problems for CT-based
attenuation correction
• Artifacts in the CT image propagate into the PET image, since the CT
is used for attenuation correction of the PET data
• Difference in CT and PET respiratory patterns
Can lead to artifacts near the dome of the liver
• Use of contrast agent or implants
Can cause incorrect values in PET image
• Truncation of CT image due to keeping arms in down in the field of
view to match the PET scan
Can cause artifacts in corresponding regions in PET image
• Bias in the CT image due to beam-hardening and scatter from the
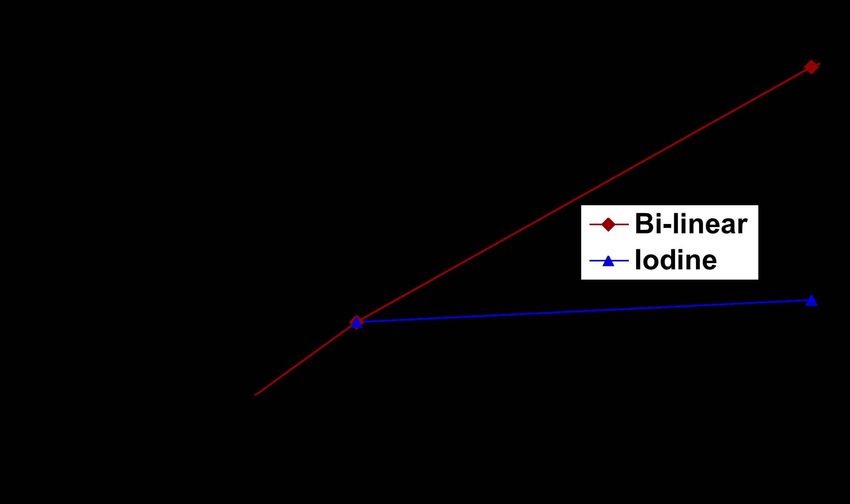
arms in the field of viewEffect of Contrast Agent on CT to PET Scaling
The presence of Iodine confounds the scaling process as Iodine
cannot be differentiated from bone by CT number alone.
In general does not seem to lead to artifacts
Can use contrast scaling, but then bone values are incorrect
Bone-water
mix
Curve that
should be
used for
contrast agentPatient shifting
• Large change in attenuation going from spine to lung
?Impact of Whole-body Respiratory Gated PET/CT in worst
case
Static wholebody Single respiratory phase 1 cc lesion on CT
(1 of 7, so noisier)
• The value of the lesion goes from 2 in the static image to 6 in one
phase of the respiratory-gated image sequenceRespiratory Gated CT images:
10 phases
8 mAs 5mm slicesWholebody Respiratory Gated PET - 9 phases Note changes in lesion intensity
PET/CT Applications and Challenges
Primarily for Cancer Imaging -- works very well
• Diagnostic imaging and staging for cancer

Expanding Areas -- with significant challenges
• Radiation treatment planning using PET and CT
• Cardiac imaging
• Assessment of therapeutic response
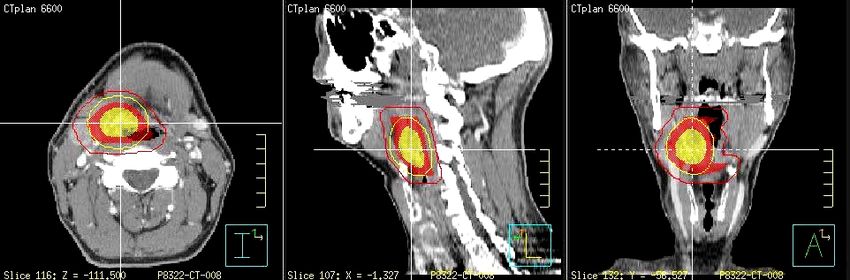
PET/CT and RTP using BTVs
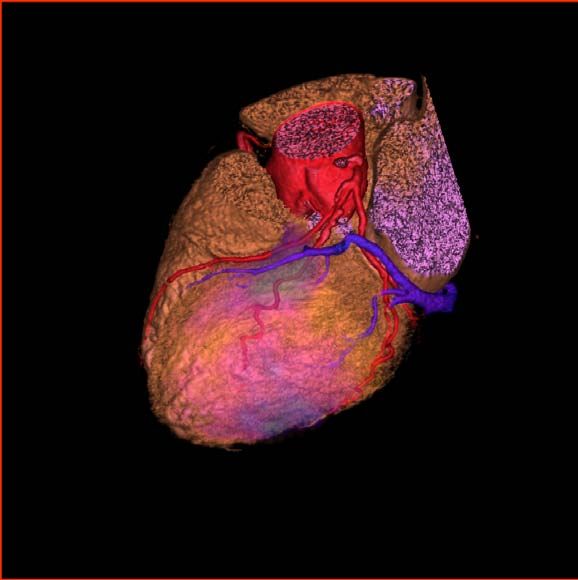
FDG-based boost volumesAnatomical/Functional Mapping of the Heart • Rest – Stress (Rb, NH3, H2O…) • Quantification (MBF, MFR) • Combining coronary imaging (CT) with perfusion (PET)
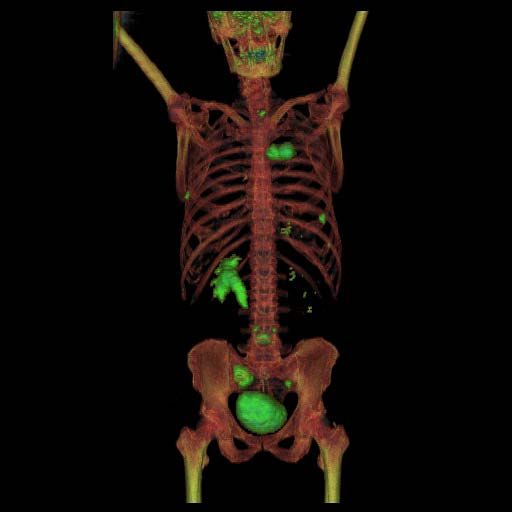
Quantitative Assessment of
                    Response to Therapy

•   Example: Change in SUV
    measures of FDG and fluoride
    incorporation for bony
    metastases from breast cancer
    before (left) and after hormonal
    therapy (right)

•   Bone images look similar but
    have very different values

•   CT helps with precise
    realignment of ROIs in serial
    studies
SPECT/CT Hybrid Systems
• Like PET/CT, SPECT/CT acquires both scans with the patient in
the same position
• Very new type of system, not clear how this will be useful
clinically, but a lot of interest
• CT is also used for attenuation correcton of SPECT data
• Having the gamma camera and CT scanner on the same gantry
allows straightforward fusion of the two data sets
• The CT provides accurate anatomical localisation of the
functional information within the gamma camera scan
• It is claimed that the accuracy of radionuclide therapy planning
can be increased by using the CT attenuation corrected SPECT
data
• Applications in development include combined coronary CT
angiography and myocardial perfusion imaging.SPECT/CT Hybrid Systems • Very different approaches by the 'big 3' Siemens Philips GE Entry-level CT High-end CT not a real CT
You can also read