Skin allergy: Modelling the T cell response
←
→
Page content transcription
If your browser does not render page correctly, please read the page content below
Skin allergy: Modelling the T cell response
Michael Davies, Vicki Summerfield, Gavin Maxwell
  Unilever Safety and Environmental Assurance Centre

Carmen Molina-París, Grant Lythe, Ed Clark
  University of Leeds

European Congress of Immunology
Glasgow, 6th September 2012

Human Health Risk Assessment for Skin Allergy

                         Exposure                                 Hazard

            Risk ?                        X
  Product

                                                  Historical         Non-animal       In Vivo

               • We risk assess to prevent skin allergy in consumers
                     • What risk does ingredient X at conc. Y in product Z pose to the consumer?

               • How can we risk assess without new animal test data?
                     1. Identify pathways driving human adverse response
                     2. Develop test methods to predict key toxicity pathways
                     3. Will response be adverse for given exposure scenario?
Identify the toxicity pathways driving the
human adverse response
Lymph
Node
?
Epidermis Epidermis
Induction Elicitation
1. Skin 8-10. Allergic Contact
Penetration 7. Presentation of
Dermatitis: Epidermal
3-4. Haptenation: 5-6. Activation haptenated protein by
inflammation
2. Electrophilic covalent of epidermal Dendritic cell resulting
following re-exposure
substance: modification of keratinocytes & in activation &
to substance due to T
directly or via epidermal proteins Dendritic cells proliferation of
cell-mediated cell
auto-oxidation specific T cells
death
or metabolism
Key Event 1 Key Event 2 + 3 Key Event 4 Adverse Outcome
Modified version of flow diagram from ‘The Adverse Outcome Pathway for Skin Sensitisation initiated by Covalent Binding to
Proteins’, OECD report (Draft: 14th Dec 2011)Applied Dose Total haptenated skin protein
‘T lymphocytes: Orchestrators of Skin Sensitisation’ workshop

• Immunologists, toxicologists &
  mathematical modellers – 2 day
  workshop in May 2010, London
• What are the characteristics of the T
  cell response that could reflect human                                Weaker allergen          Stronger allergen
  skin sensitiser potency?
   • Magnitude: What is the extent of
     sensitiser-induced T cell response

                                              Number of T lymphocytes
     (volume, kinetics & duration)?

   • Quality: Within sensitiser-induced T                                            Treg                      CD8+
     cell response, what is the balance
     between the T cell sub-populations?                                             CD8+                       Treg
   • Breadth: What proportion of the T cell
     clonal repertoire has been stimulated
     by a given sensitiser?

    Kimber et al, 2012, Toxicology 29118-24
                                                                                          Time
Current CD8+ model scope
• Current model scope is focussed on
DLN Blood Skin
modelling the magnitude of CD8+
(effector, CTL) T cell response
CD8
• Include subsets of central memory, N CD8
N
effector memory, naïve and cytotoxic
T cells (CD8+ T cell populations only)
• Only model T cell clones that are CD8 CD8
specific to antigen CTL CD8 CTL
CTL
• Human sensitiser-specific T cell data
CD8
is not available: CM CD8
CM
• Make use of relevant literature data
• Initiate new research to generate CD8
sensitiser-specific data to test and CD8 EM
EM
improve modelNaïve and CM turnover
0.004 cells.d-1
• Naïve mean turnover rate of 0.00035 d-1
• Half life of 5 years
• Thymic production accounts for 20% of
production in 25 year old individual 0.00028 d-1
CD8
• Assume background proliferation rate N
contributes 80% to maintain homeostasis
0.00035 d-1
• CM mean turnover rate of 0.00277 d-1 0.0025 d-1
CD8
• Half life of 0.7 years CM
• Assume proliferation rate 90% of death
rate to give population lasting decades
0.00277 d-1
Vrisekoop et al, 2008, PNAS 105 (16) 6115-6120;
Murray et al, 2003, Immunol. Cell Biol. 81 487-495CD8
Proliferation rates with antigen CTL
Yoon et al, 2010, PLOS One 5 (11) e15423
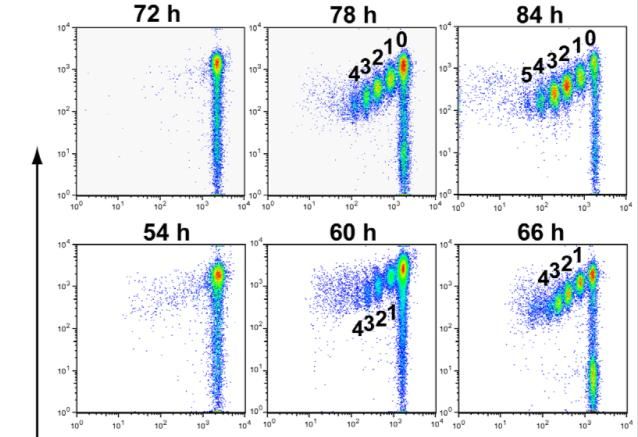
• After each exposure to antigen, 5 day
period with increased proliferation and
differentiation
• Programmed proliferation of cytotoxic
T cells
• No human data for proliferation rates
• Proliferation rate of 1.8 d-1 in mice with
CD69
viral infection
CFSE
6 hrs 12 hrsInitial population size
• Unexposed individual
• Zero antigen specific cytotoxic or memory CD8+ T cells at the start
• Number of naïve antigen specific CD8+ T cells in DLN, blood, (skin)
• Assume exposure to skin on the arm
• 25 draining lymph nodes (DLN) in axilla out of 650 in total
• Assume single antigen, single TCR
• One in 25 million naïve T cells are antigen specific
Whole of body
72.5 bn
All LNs 2900
All TCRs DLN Blood Skin
Ag specific (1 TCR) 19 bn
760 0.73 bn 1.45 bn
29 58
Vrisekoop et al, 2008, PNAS 105 (16) 6115-6120; Westermann & Pabst, 1992, Clin. Investig. 70 539-544;
Arstila et al, 1999, Science 286 958Migration to lymph nodes
• Quantitative data from sheep: assume similar scale for humans
• 1 billion lymphocytes per day into / out of each lymph node
• 96 antigen specific naïve CD8+ T cells per day into / out of 25 DLNs
• Include effects of lymph node shutdown and increased influx
Young, 1999, Seminars in Immunol. 11 73-83; Haig et al, 1999, Immunol. 96 155-163;
Seabrook et al, 2005, Immunol. 116 184-192Current model predictions:
3 exposures at 2 week intervals
DLN Blood Skin
CD8
N CD8
N
CD8 CD8
CTL CD8 CTL
CTL
CD8
CM CD8
CM
CD8
CD8 EM
EMEffects of sensitive parameters
Next Steps

• Iterative refinement of model scope using relevant
  literature & experimental data
   • e.g what is the optimum T cell response
     parameter(s) to measure/predict?
   • wet-dry cycle approach

• Generate sensitiser-specific datasets to inform or
  benchmark model predictions
   • e.g. benchmarking the T cell response:
       • characterising induction of hapten-specific T cell
         responses in patients undergoing sensitiser
         treatment for defined clinical benefit
       • characterising ‘mature’ T cell response in
         individuals attending dermatology patch test clinics
         for diagnosis of existing allergic contact dermatitis
Thank You – Questions? Acknowledgments: Maja Aleksic, Richard Cubberley, Julia Fentem, Michael Hughes, Todd Gouin, Gaurav Jain, Sandrine Jacquoilleot, Cameron MacKay, Gavin Maxwell, Craig Moore, Deborah Parkin, Juliette Pickles, Fiona Reynolds, Ouarda Saib, David Sheffield, Vicki Summerfield, Jeff Temblay, Carl Westmoreland & Sam Windebank
Modelling T cell response - Overview

T cell response
  parameters
                                                  1      • Develop a pragmatic
                                                         mathematical model
                                                         using pathogen-derived
                                                         literature data on the
                                                         antigen-specific CD8+ T
                                                         cell response
                                                                                           1 2 3
                                                         3 year study
1    magnitude                                  1 2 3
                                                                                      Clinical research to
                      3                                 • Develop mathematical        characterise:
                                                        models to explore to what     • induction of sensitiser-
                                                        extent magnitude, quality     specific T cell response
               CD8+                                     & breadth drive sensitiser-   in humans
                                                        induced T cell response
                      • 3 year study
                                                        • Establish the key metrics
                      • Characterise the
               Treg   ‘breath’ of human
                                                        for predicting adverse
                                                        sensitisation threshold
                      sensitiser-induced T
                                                        • Use in vitro & human        • sensitiser-specific T
                      cell response &
                                                        clinical data to inform       cell response in already
                      establish how ‘breadth’
 2   quality          impacts on magnitude
                                                        model predictions             sensitised individuals
                      &/or quality of T cell
                      response

 3   breadth
You can also read