DAILY EPIDEMIOLOGY UPDATE - Updated: May 3, 2020, 11:00 AM ET Highlights Canada
←
→
Page content transcription
If your browser does not render page correctly, please read the page content below
Coronavirus Disease 2019 (COVID-19)
DAILY EPIDEMIOLOGY UPDATE
Updated: May 3, 2020, 11:00 AM ET
Highlights
Canada
57 148 (+1 576) cases, including 3 606 (+160) deaths, have been reported in Canada (overall case fatality
rate of 6.3%).
At least 893 490 people have been tested to date for COVID-19 in Canada, which corresponds to a test rate
of 23 770 per million population.
At least 31 410 new people have been tested since the last report.
The epidemiological summary is based on detailed case information for 30 721 cases received by the Public
Health Agency of Canada (PHAC), which represents 54% of all reported COVID-19 cases in Canada
(N=57 148).
o The highest proportion of cases occurred among individuals 40-59 years of age (32%) followed by
those 20-39 years of age (26%); 5% of cases are individuals ≤ 19 years of age.
o 55% of cases are female.
Hospitalizations:
o Information on whether someone was admitted to hospital is reported for 20 065 cases.
Among these, 3 148 (16%) of cases were hospitalized, including 753 (24%) of the
hospitalized cases admitted to the ICU.
o Cases 60 years of age or older represent the highest proportion of hospitalizations (66%) and ICU
admissions (63%).
o Male cases appear to have a somewhat higher risk of hospitalization (1.4 times) and ICU
admission (2.0 times) when compared to female cases.
International
The United States is reporting the highest number of cases, followed by Spain, Italy, the United Kingdom,
Germany, and France.
Data Notes
As of May 3, 2020, 11:00 AM ET, detailed data on cases have been received by PHAC for 54% (n=30 721) of all
reported COVID-19 cases in Canada. Limitations of these data:
Data are and may have missing values.
Data may not be routinely updated by province and territories (P/Ts).
PHAC does not receive routine updates on patient status.
PHAC’s National Microbiology Laboratory collects national and PT laboratory testing information. Limitations of
these data include:
Testing practices vary by P/T and have changed over time, which may affect counts.
Laboratory testing counts may be underestimated due to reporting delays and may not include additional
sentinel surveillance or other testing performed.
COVID-19 Daily Epi Update Page 1 of 10
Last updated: May 3, 2020, 11:00 AM ET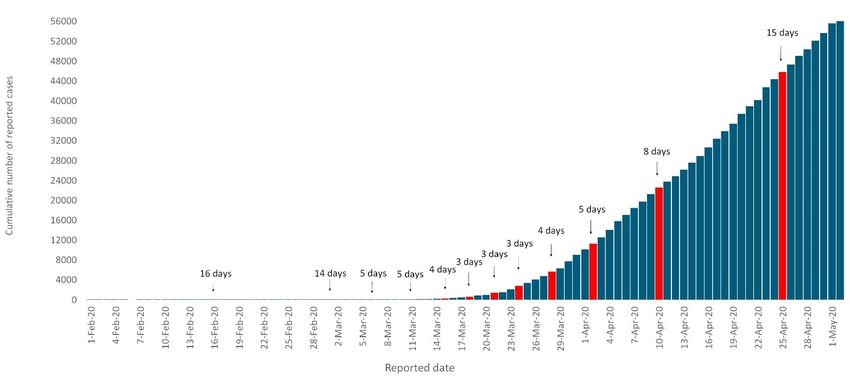
Canadian epidemiology
As of May 3, 2020, 11:00 AM ET, 57 148 (+1 576) cases of COVID-19, including 3 606 (+160) deaths, have been
reported in Canada (overall case fatality rate of 6.3%).
At least 893 490 people have been tested for COVID-19 in Canada (Table 1). This corresponds to a test rate of
23 770 per million population.
At least 31 410 new people have been tested since the last report.
The cumulative percent positivity is approximately 7%
The seven day average percent positivity from April 27 to May 3 is approximately 6%
Table 1: Summary of COVID-19 cases reported in Canada by location
People tested
Total New % Total People New per 1, 000, 000
Location Cases cases Recovered Recovered deaths tested ¥ Tests pop’n
BC 2 171 26 1 376 63% 114 81 061 3 157 15 984
AB 5 670 97 2 534 45% 94 148 757 3 337 34 030
SK 421 6 302 72% 6 29 498 651 25 116
MB 280 1 236 84% 6 25 736 761 18 793
ON 17 553 434 12 005 68% 1 216 316 796 16 586 21 748
QC 29 656 1 008 6 965 23% 2 136 230 864 6 033 27 209
NL 259 0 231 89% 3 8 819 103 16 909
NB 118 0 118 100% 0 14 559 307 18 742
NS 963 4 609 63% 31 31 192 418 32 111
PE 27 0 24 89% 0 3 086 0 19 663
YK 11 0 11 100% 0 1 019 20 24 942
NT 5 0 5 100% 0 1 682 37 37 523
NU 1 0 0 0% 0 421 0 10 856
Repatriated
travellers* 13 0 Unknown Unknown 0 0 0 0
Total 57 148 1 576 24 416 43% 3 606 893 490 31 410 23 770
¥
For provinces and territories which report the number of tests completed, mathematical formula is used to estimate the number of unique people tested.
* Repatriated travellers refer to the Grand Princess cruise ship travellers who were under quarantine in Trenton. Update on their status is not available.
Notes: (1) New cases and tests are those reported since the previous report. (2) Laboratory testing numbers may be underestimated due to reporting delays and
may not include additional sentinel surveillance or other testing conducted in the P/T.
COVID-19 Daily Epi Update Page 2 of 10
Last updated: May 3, 2020, 11:00 AM ET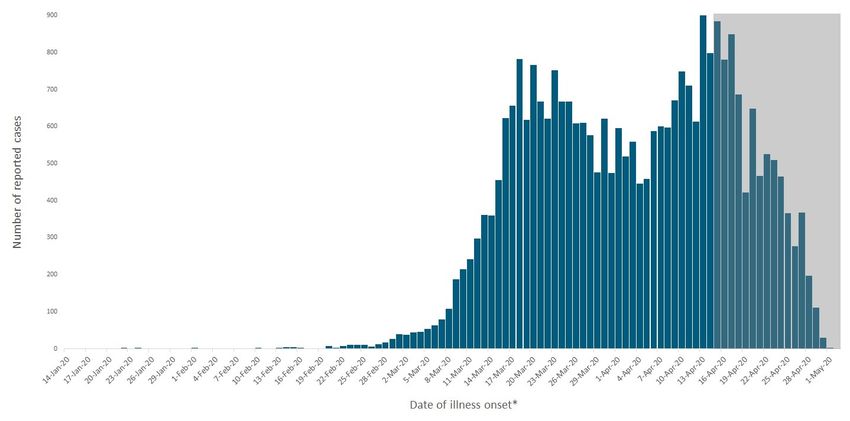
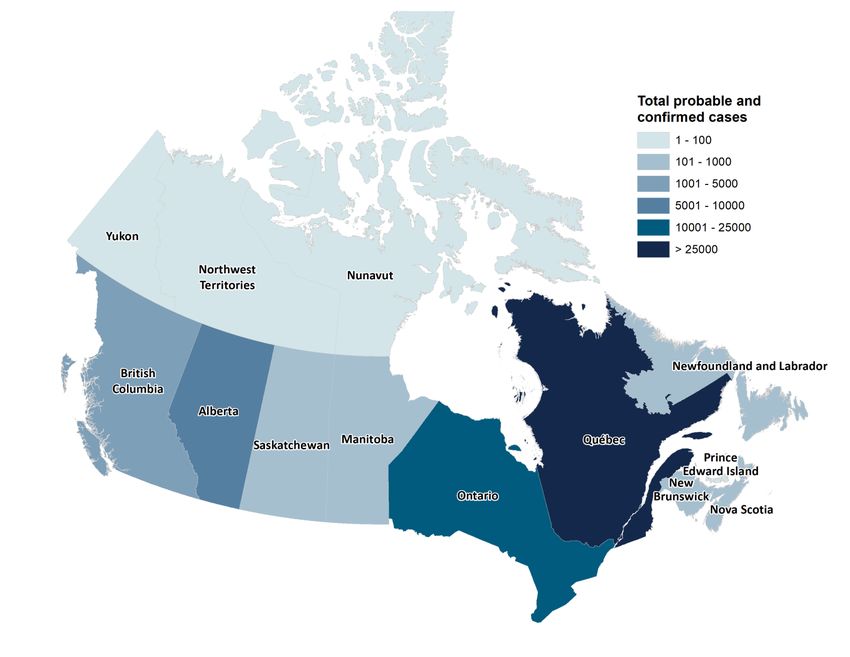
The geographic distribution of cases by province/territory (P/T) are captured in Figure 1.
Quebec is reporting the highest number of cases, 29 656, followed by 17 553 in Ontario, 5 670 in Alberta and 2 171
in British Columbia.
Figure 1. Map of COVID-19 cases reported in Canada by province/territory (N=56 714)
Data source: Surveillance and Risk Assessment Epidemiology Update. Map Created by NML Geomatics
The distribution of cumulative number of cases by report date (using publicly available P /T data) can be seen in
Figure 2.
The epidemic doubling period of COVID-19 cases in Canada, defined as the number of days between doubling of
cumulative case counts, is marked with red bars.
Recently, Canada’s rate of growth of COVID-19 cases has decreased and during the period of April 11 to
25th, the doubling time was 15 days.
COVID-19 Daily Epi Update Page 3 of 10
Last updated: May 3, 2020, 11:00 AM ET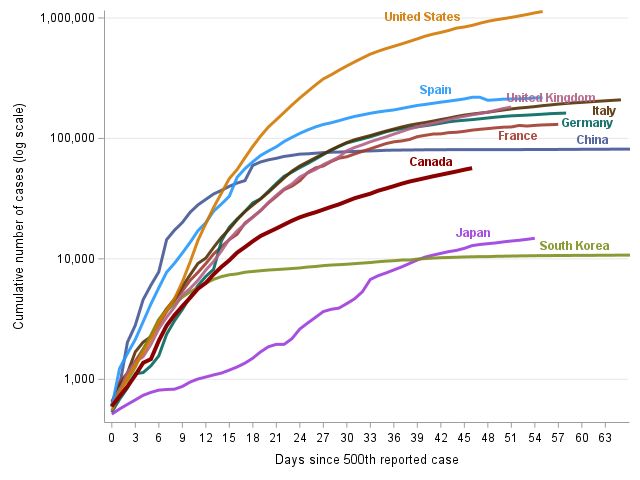
Figure 2. Doubling time of cumulative number of reported COVID-19 cases in Canada by date of report (N=57 148 )

This section of the epidemiology update is based on the detailed case information received by PHAC for
30 721 cases. Not all data fields are complete for all cases.
Temporal Distribution
A summary of the distribution of cases by date of illness onset can be found in Figure 3.

Figure 3. New COVID-19 cases in Canada by date of illness onset (n=29 402)

*If date of illness onset was not available the earliest of the following dates was used as an estimate in the following order: Specimen Collection Date, and Laboratory
Testing Date.
Note: The shaded area represents a period of time (lag time) where it is expected that cases have occurred but have not yet been reported nationally

COVID-19 Daily Epi Update                                                                                                             Page 4 of 10
Last updated: May 3, 2020, 11:00 AM ET
Demographic Distribution
A summary of the demographics can be found in Table 2.
The highest proportion of cases are among those aged 40-59 years (32%), followed by those aged 20-39
years (26%); 5% of cases have occurred in individuals ≤ 19 years of age
55% of cases were reported among females
Table 2. Demographic characteristics of COVID-19 cases reported in Canada
Characteristics
Age (in years)
Median 52
Range 0-111
Age groups n=30 185
≤ 19 1 538 (5%)
20-39 7 768 (26%)
40-59 9 791 (32%)
60-79 6 191 (21%)
80+ 4 897 (16%)
Gender n=30 470
Female 16 863 (55%)
Male 13 596 (45%)
Other 11 (Case severity
Of the 20 065 cases with hospitalization data reported, 3 148 cases (16%) reported hospitalization, including 753
(24%) admitted to the ICU (Table 4).
Those aged ≥ 60 years have the highest proportion of reported hospitalizations (66%), ICU admissions
(63%), and deaths (95%).
Among cases ≤ 19 years of age, there were 22 reported hospitalizations and 2 ICU admissions.
Of the 3 148 cases that were hospitalized, 74% reported one or more pre-existing conditions.
Table 4. Summary of severe cases of COVID-19 reported in Canada with detailed case information
Case Severity
Overall Summary Hospitalizations
Hospitalizations 3 148/ 20 065 (16%)
Hospitalizations in ICU 753/ 3 148 (24%)
Hospitalizations requiring mechanical ventilation 159/ 3 148 (5%)
All Hospitalizations Admitted to ICU Deceased
Age groups
≤ 19 22 (1%) 2 (Of the 19 586 cases with information on hospitalization status and age, the proportion of cases hospitalized and
admitted to ICU are described by age group in Figure 4.
Of all COVID-19 cases ≥ 60 years of age that have reported detailed case information (n=6 500), 2 048
(32%) have been hospitalized and 468 (7%) have been admitted to the ICU.
Figure 4. By age group, the percentage of COVID-19 cases with detailed case information that are hospitalized and
admitted to ICU in Canada (n=19 586)
45% Hospitalized Admitted to ICU 40.3%
40%
Percentage of all reported cases
33.8%
35%
30%
25% 23.5%
20%
15.2%
15% 11.1%
8.7%
10% 8.3%
5.2% 4.6%
3.6% 3.4%
5% 1.8% 0.9%
2.3%
0.2% 0.6%
0%
≤ 19 20-29 30-39 40-49 50-59 60-69 70-79 80+
Of the 19 991 cases with information on hospitalization status and gender, the proportion of cases hospitalized and
admitted to ICU, are described by gender in Figure 5.
Male cases appear to have a somewhat higher risk of hospitalization (1.4 times), and ICU admission (2.0
times) compared to female cases.*
*Please note that this information has not been tested for statistical significance and is only based on a portion of all cases.
Figure 5. By gender, the percentage of COVID-19 cases with detailed case information that are hospitalized and
admitted to ICU in Canada (n=19 991)
20% Hospitalized Admitted to ICU 18.6%
Percentage of all reported cases
18%
16%
14% 13.2%
12%
10%
8%
6% 5.2%
4% 2.5%
2%
0%
Female Male
COVID-19 Daily Epi Update Page 7 of 10
Last updated: May 3, 2020, 11:00 AM ETExposure History
A summary of the exposure history of cases can be found in Figure 6 and Table 5.
The number of cases related to community transmission surpassed travel-related cases on March 15
2020
Figure 6. Number of newly reported COVID-19 cases in Canada by possible exposure category (n=29 402)
*Episode date corresponds to the earliest date reported according to the following order: Symptom Onset Date, Specimen Collection Date, and Laboratory Testing
Date. Cases that do not include any of these date types have been excluded from the curve.
Table 5. Possible exposure setting of COVID-19 cases reported in Canada
Possible Exposure Setting n= 30 721
Travel-Related n=5 152 17%
History of international travel 4 052 79%
Close contact of an international traveller 1 100 21%
Community-Related n=21 468 70%
Case exposed in a healthcare facility* 4 088 19%
Case lives in a long-term care facility 480 2%
Close contact with case in a household 816 4%
Close contact with case in a workplace¥ 207 1%
Case attends/works at a school or daycare 206 1%
Case has no known exposures † 15 671 73%
Pending n=4 101 13%
*Includes healthcare workers and exposure in health care setting
¥ Excludes healthcare settings
† Includes community transmission where specific setting was not reported as well as cases where no clear exposure setting was reported
COVID-19 Daily Epi Update Page 8 of 10
Last updated: May 3, 2020, 11:00 AM ETFluWatchers
FluWatchers is an online health surveillance system that helps track the spread of flu-like illness across Canada.
FluWatchers normally track the flu, but with the COVID-19 pandemic, we are shifting our focus to tracking COVID-
19 over the spring and summer months. The FluWatchers program relies on Canadian volunteers to report each
week.
In the week of April 19, 2020, 9 750 participants reported into the FluWatchers program. A total of 15 participants
(0.2%) reported cough and fever.
Among the 15 participants reporting cough and fever:
9 (60%) sought medical attention
3 (20%) were tested
o 1 test was positive for COVID-19 and 2 test results were negative
Figure 7: Percentage of FluWatchers Participants Reporting Cough and Fever (N=9 750 the week of April 19,
2020)
International
The United States is the epicentre of the global pandemic (Table 6).
o There are 1 133 069 cases and 66 385 deaths (CFR of 5.9%) reported in the United States as of
May 3, 2020, at 8:00 AM*.
o Further information on the situation in the US can be found on US CDC website and in their weekly
COVID-19 surveillance report.
210 countries/jurisdictions outside mainland China have reported cases of COVID-19.
The United States is reporting the highest number of cases, followed by Spain, Italy, the United Kingdom,
Germany, and France.
Up-to-date country-specific risk levels may be found on travel health notices.
COVID-19 Daily Epi Update Page 9 of 10
Last updated: May 3, 2020, 11:00 AM ETTable 6. Global number* of reported COVID-19 cases, May 3, 2020, 8:00 AM ET
Location Total cases New cases Total deaths New deaths
Globally 3 390 536 81 179 243 523 4 816
USA 1 133 069 28 908 66 385 1 317
Mainland China 82 877 2 4 633 0
*Information Sources: ECDC Situation update, Hong Kong Centre for Health Protection, Chinese Center for Disease Control and Prevention, Spain MOH, Germany
MOH, France MOH, Italy MOH, and Johns Hopkins Resource Center.
A summary of the cumulative cases of COVID-19 in Canada compared to other countries by date of report can be
seen in Figure 8.
Data reported in the coming days and weeks will continue to be critical in determining the trajectory of
Canada’s epidemic.
Figure 8. Cumulative cases of COVID-19 in Canada compared to other countries by date of report
Note: At this time, results from international comparisons should be interpreted with caution. The number of tests conducted and indications for testing by country all have a large
influence on total reported case counts. Therefore, the data displayed does not necessarily represent the true size of outbreak within each country.
COVID-19 Daily Epi Update Page 10 of 10
Last updated: May 3, 2020, 11:00 AM ETYou can also read