Mapping Gene Campaign's Rice Collection and Predicting Future Adaptation Sites in 2020, 2040 & 2060
←
→
Page content transcription
If your browser does not render page correctly, please read the page content below
1
Mapping Gene Campaign’s Rice Collection and Predicting Future
Adaptation Sites in 2020, 2040 & 2060
A total of 872 rice varieties from the Gene Campaign rice collection from Eastern India were
analyzed in the study. The collections in the study were made from the 9 states/UT of
Jharkhand, Bihar, Odisha, Chhattisgarh, Dadra and Nagar Haveli, Uttar Pradesh, West Bengal,
Meghalaya and Assam with the maximum collection concentrated Jharkhand. In order to assign
geographic coordinates to the rice collection, various external sources were consulted including
the administrative database of the Survey of India and Google Earth. The rice collection
database has location information including village, taluka/block, district and state. The location
names were searched in the external sources and matching locations were noted at the village
level where available in a table. Subsequently, the table with the geographic coordinates with
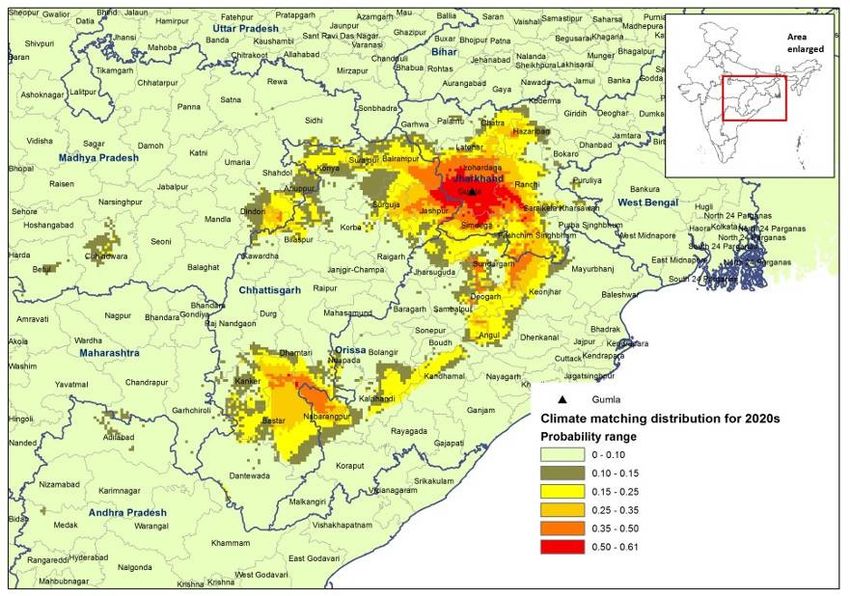
location names was joined with the table listing the rice collection in the ESRI ArcInfo 10.0
software to assign geographic coordinates to the rice collection.
Fig 1 below shows the number of collections from the different districts of the above-mentioned
states.
Figure 1: Map showing districts from where rice varieties’ seed collected and number of rice varieties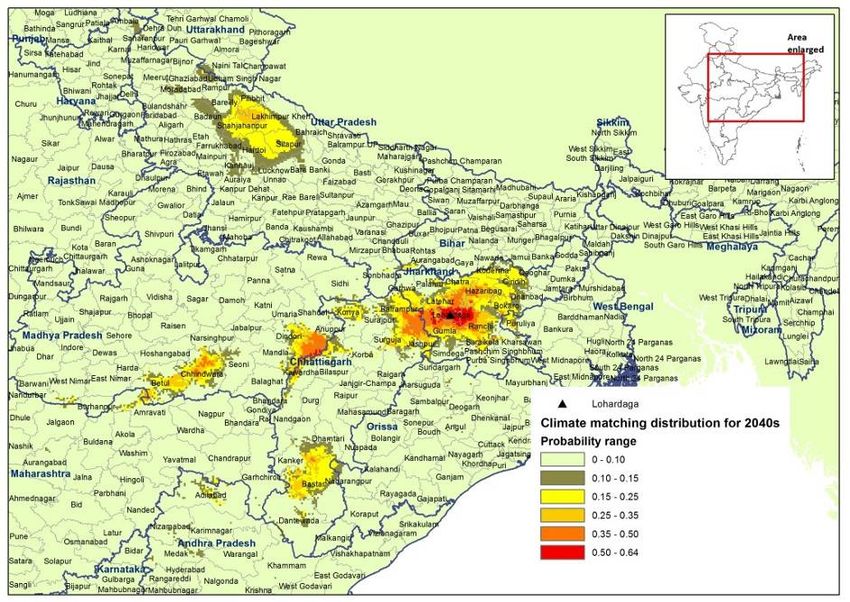
2

Table 1 shows the districts from which at least 10 rice varieties have been collected

 State          District                         No of varieties
 Jharkhand      Simdega                                                117
 Jharkhand      Ranchi                                                 103
 Jharkhand      Hazaribagh                                              86
 Jharkhand      Gumla                                                   82
 Odisha         Koraput                                                 40
 Jharkhand      Khunti                                                  37
 Jharkhand      Lohardaga                                               36
 Jharkhand      Bokaro                                                  31
 Meghalaya      East Garo Hill                                          27
 Chhattisgarh   Bastar                                                  25
 Assam          Golaghat                                                21
 Jharkhand      Latehar                                                 20
 Jharkhand      West Singhbhum                                          18
 Bihar          Nalanda                                                 16
 Odisha         Mayurbhanj                                              16
 Jharkhand      Dhanbad                                                 13
 Odisha         Malkangiri                                              13
 Odisha         Sundargarh                                              13
 Assam          Jorhat                                                  12
 Odisha         Nabrangpur                                              12
 Jharkhand      Garhwa                                                  11
 Bihar          Nawada                                                  10
3

                          Climate classification for the rice collection

The current climate data from the Worldclim database (http://www.worldclim.org/) (2.5
minutes) for each climatic variable for all the geo-referenced accessions were extracted using
DIVA-GIS. The extracted climate data was then grouped into 6 classes for better visual
representation and the annual mean temperature and annual precipitation histograms are
shown below from Figures 2 to 5. It should be noted here that the figures above the bars show
the number of spatially non-duplicate accessions within that class.

Figure 2: No. of rice accessions from different annual mean temperature classes

It can be seen from Figure 2 that the annual mean temperature for the entire collection of rice accessions
falls within the range of 21.5°C to 27.7°C with most of the accessions (61.7%) lying within the range of
23.6-25.6°C. Figure 3 shows the distribution of collection for the mean maximum temperature classes
with most accessions (80%) of the collection experiencing a high maximum temperature of greater than
37.6°C while Figure 4 shows that a high percentage (78.5%) of the accessions are from areas experiencing
mean minimum temperature between 8.5-11.6°C.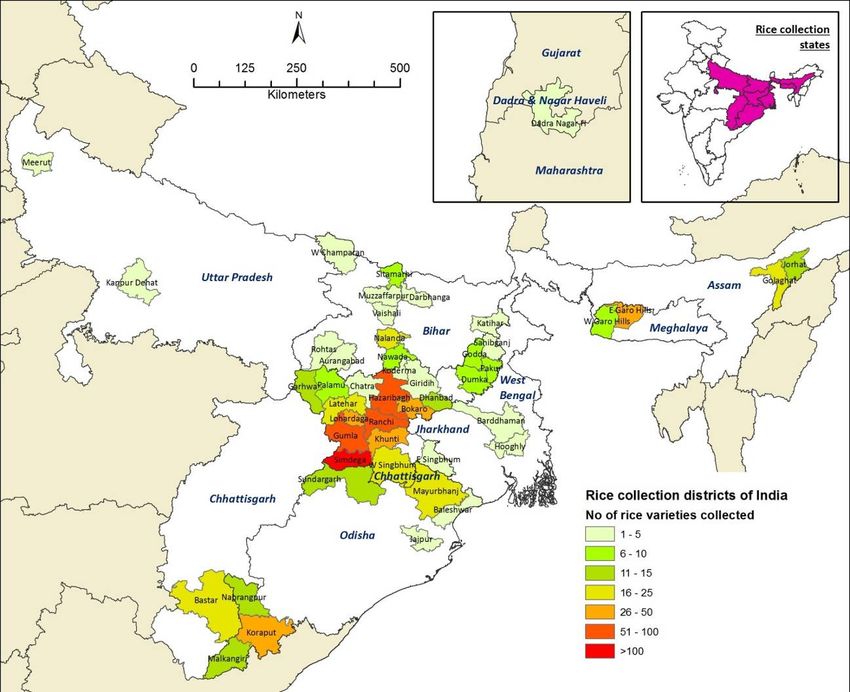
4

Figure 3: No. of rice accessions from different mean maximum temperature classes

Figure 4: No. of rice accessions from different mean minimum temperature classes
5

Figure 5: No. of rice accessions from different annual precipitation classes

Figure 5 shows the distribution of collection locations for annual precipitation. Around 80% of
the collection comes from the moderate rainfall areas where the annual precipitation is around
1000-2000 mm. The rest are from areas with heavy rainfall with 16 accessions from areas with
annual precipitation higher than 3050 mm.

In order to identify the accessions which are adapted to unique climate conditions, the current
annual mean temperature (⁰C) and annual precipitation (mm) were plotted in DIVA-GIS and the
accessions lying outside the envelope shows the unique accessions within the collection (Figure
6). The total collection has also been mapped on Figure 7.
6

Figure 6: Distribution of accessions based on annual mean temperature and annual mean precipitation

Figure 7: Accessions lying outside the envelope (red) and within the envelope (yellow) as per the
distribution modeling of Fig. 6
7
Understanding the degree to which the rice collection can help farmers cope with
climate change
In order to understand which promising collections will be of most use to farmers under
predicted changing climate scenarios, it is necessary to identify areas which are vulnerable to
climate change and cross reference them with the attributes of the collections available from
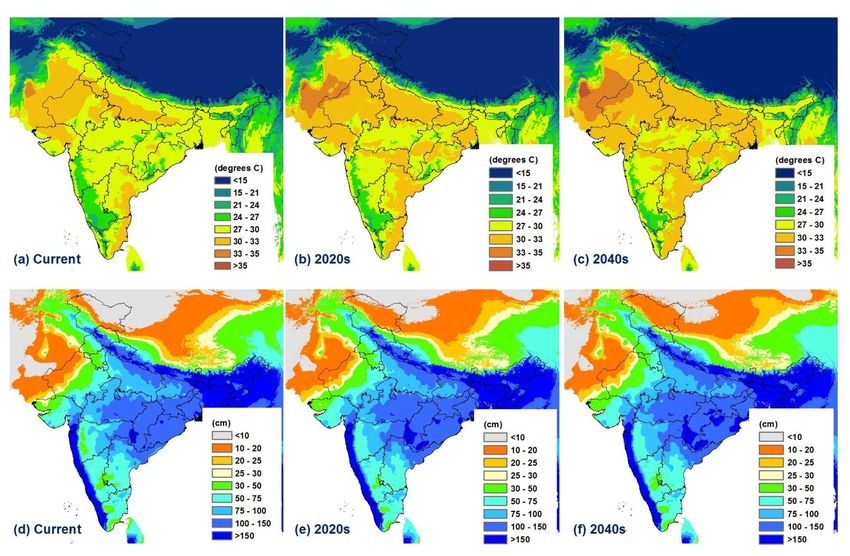
those sites, either for replication purposes elsewhere or for re-collection purposes. Fig 8 shows
the current and future scenarios for mean temperature (a, b and c) and mean precipitation (d, e
and f) for the Kharif rice growing season (April to October) in India. The climate data for
precipitation, mean temperature, maximum temperature and minimum temperature for India
were obtained from the Worldclim climate database for current climate and the CSIRO -Mk3.5
General Circulation Model (GCM) SRES A1B of the CSIRO Atmospheric Research Group of
Australia was used for the future data for the decades of 2020s and 2040s. The downscaled
climate data was then mapped in ArcInfo 10.0 to obtain the information depicted in Figure 8.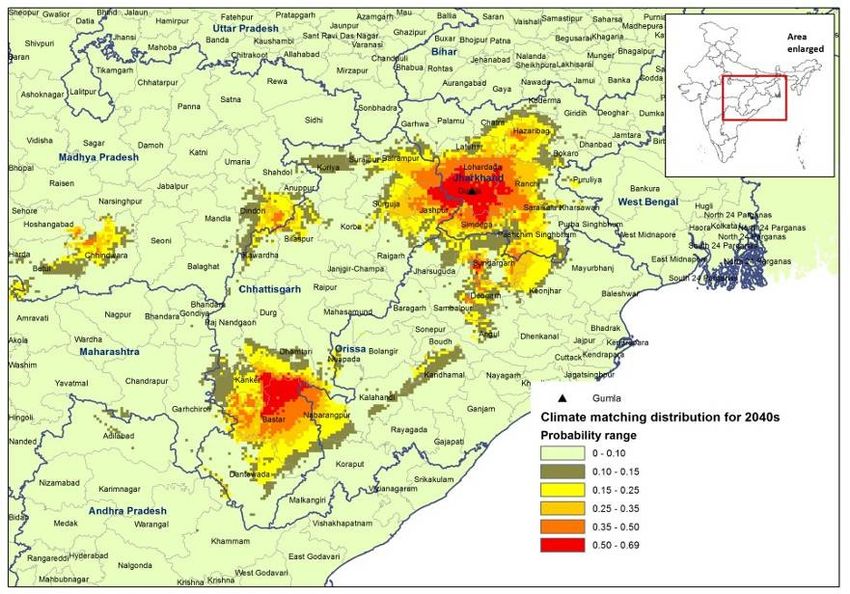
8

Figure 8: Mean temperature for (a) current, (b) 2020s and (c) 2040s and mean precipitation for (a) current, (b) 2020s and (c)
2040s for April to October
9

As can be seen from the map, areas along Bihar, Jharkhand, Chhattisgarh and Odisha shows a marked
change in temperature while areas where the states of Bihar, Jharkhand and Chhattisgarh adjoins and
southern Chhattisgarh show a change in the precipitation from current to future conditions. Based on
the collections available and the vulnerability of the sites to changing temperatures and precipitation in
the future decades, a climate matching analysis was run for those districts with greater than 10
collections.      The      climate      matching        was       done       through      the      Maxent
(http://www.cs.princeton.edu/~schapire/maxent/) program for maximum entropy modeling which was
developed to model species’ geographic distributions based on some environmental variables. Maxent,
or Maximum Entropy Species Distribution Modelling, was written by Steven Phillips, Miro Dudik and Rob
Schapire, with support from AT&T Labs-Research, Princeton University, and the Center for Biodiversity
and Conservation, American Museum of Natural History. The model predicts the probability of the
presence of a species based on any given environmental condition. In this case, future climate data was
used as the environmental variable on whose basis the probability of the accessions being present in
future conditions was determined. The rice collection was grouped into clusters based on the district of
collection and the future climate probability matching was done for these clusters using the CSIRO -
Mk3.5 (2020s and 2040s) GCM SRES A1B of the CSIRO Atmospheric Research Group of Australia. In some
cases, the future climate probability matching was also done for 2060s using same climate data from
CSIRO. The matching sites will give an indication of similar climatic conditions between two sites such
that varieties already adapted to the source site can be tested in the future-matching site or vice versa
as part of the adaptation process. The results of a few representative districts are presented below.
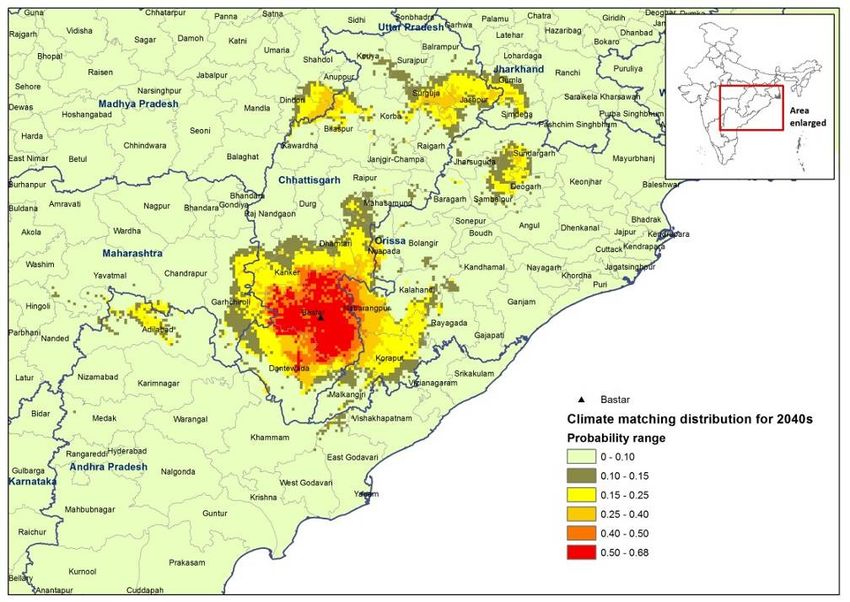
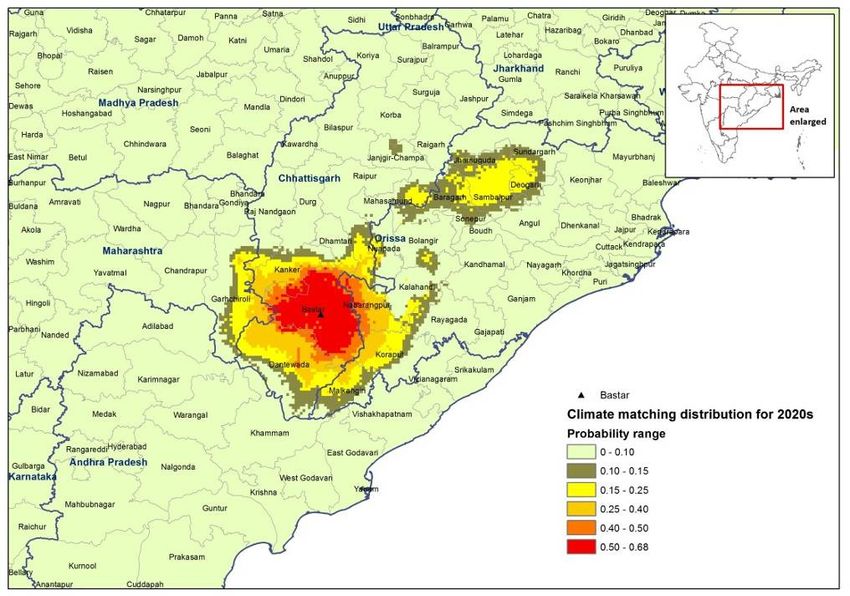
10

Chhattisgarh

Analysis was run for climate matching sites in the Bastar district. Maximum probability of matching was
calculated at 68% for both 2020s and 2040s. Areas in southern Odisha that adjoin the Bastar district,
northern Chhattisgarh and few parts of north-western Odisha show medium to low probability
matching. Varieties collected from Bastar (25 varieties) that have complementary traits can be tested in
these new sites.
11

Assam

Golaghat district in Assam shows probable climate matching area in northern West Bengal and western
Assam. Twenty one rice varieties have been collected from these sites and selected varieties can be
tested in these sites. Moreover, selected varieties from the matching sites can also be tested in
Golaghat.
12

Meghalaya
13

The future climate matching analysis of East Garo Hills in Meghalaya shows clearly that most of the
highest probability matching sites are shifting north in the 2020s, 2040s and 2060s to areas in western
Assam. Some areas in eastern and northern Meghalaya also shows probable matching areas. Twenty
seven rice varieties have been collected from East Garo Hill district and can be tested at the matching
sites.
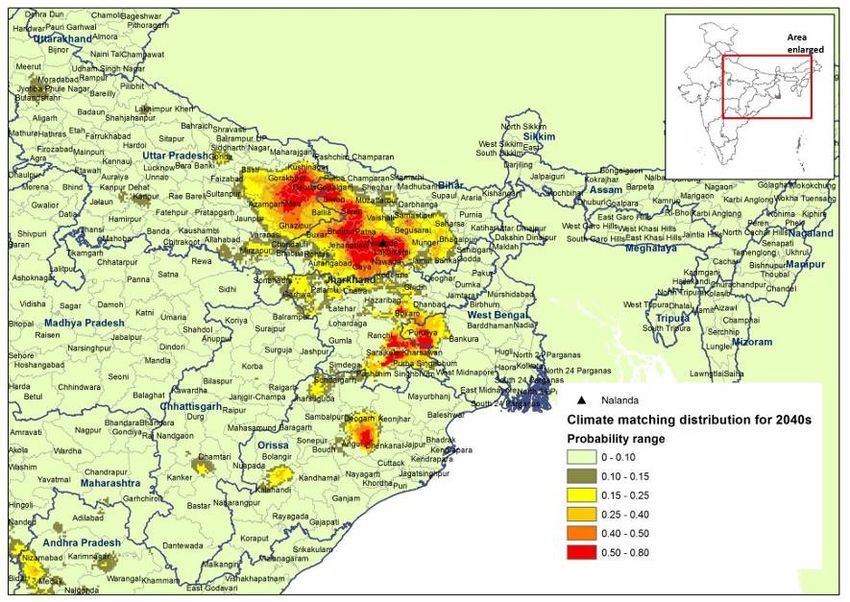
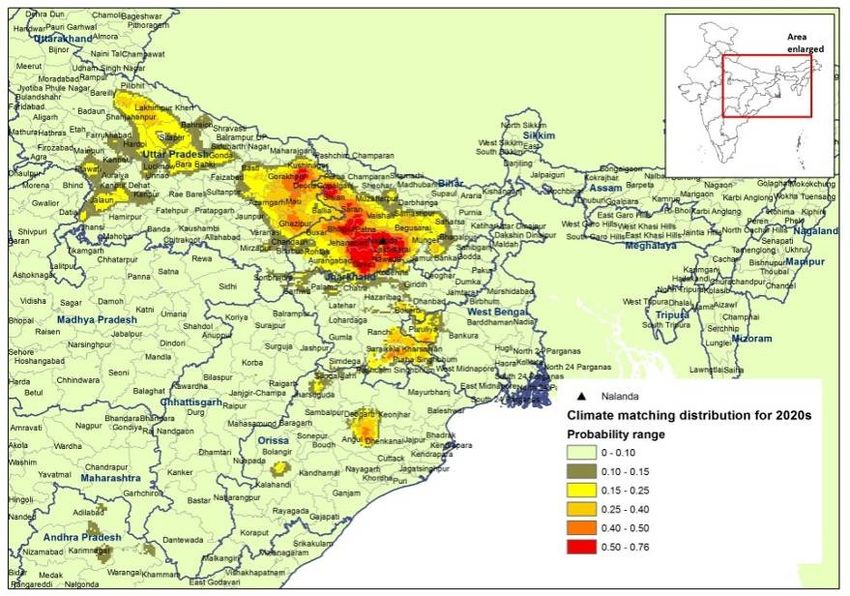
14

Bihar

The climate matching analysis of Nalanda district in Bihar shows probable matching areas west of the
district and low probability matching sites in the central Uttar Pradesh region in the 2020s while
matching areas can be found in the eastern Jharkhand – south-western West Bengal contiguous region
and central Odisha in the 2040s. Sixteen rice varieties have been collected from Nalanda district and can
be tested at the matching sites.
15

Odisha
16

The climate matching analysis of Malkangiri district in Odisha shows that a wide stretch of area covering
Odisha, Chhattisgarh, Jharkhand, West Bengal and some parts of Maharashtra and Andhra Pradesh have
high to low probability. While the climate matching areas do not differ much from the 2020s, 2040s and
2060s, it can be seen that the highly probable areas (>60%) are reducing considerably. Thirteen rice
varieties have been collected from Malkangiri district and can be tested at the matching sites.
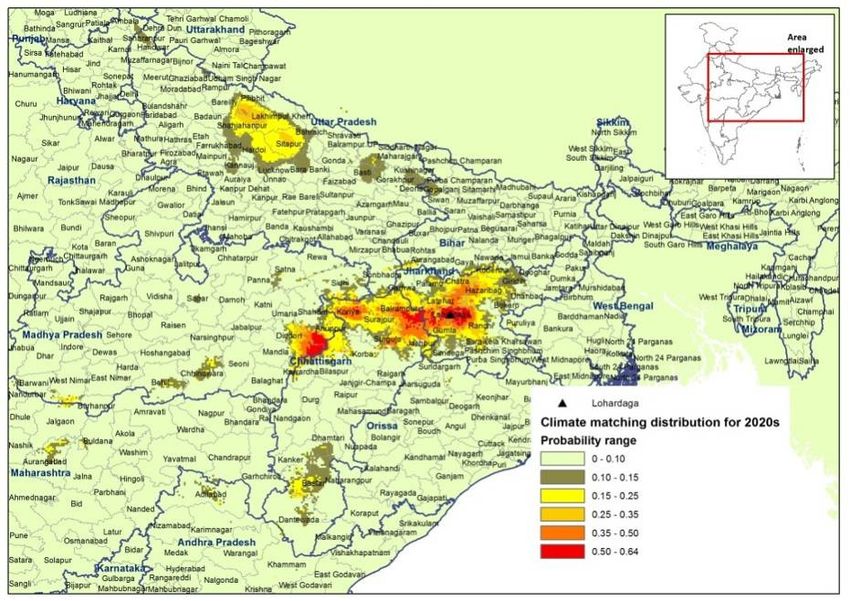
17

Jharkhand

The climate matching analysis of Gumla district in Jharkhand shows probable matching areas in
Jharkhand, northern and southern Chhattisgarh and some parts of northern and central Odisha. Some
areas of southern Madhya Pradesh also shows increasing match from the 2020s to 2040s probably as a
result of increasing precipitation predicted for these sites in the future (see Fig 2-d,e,f). Eighty two rice
varieties have been collected from Gumla district and can be tested at the matching sites.
18

The climate matching analysis of Lohardaga district in Jharkhand shows probable matching areas in
Jharkhand, southern Chhattisgarh, eastern and southern Madhya Pradesh and some parts of central
Uttar Pradesh. Thirty six rice varieties have been collected from Gumla district and can be tested at the
matching sites.
19

References:

Steven J. Phillips, Miroslav Dudík, and Robert E. Schapire. 2004. A maximum entropy approach to species
distribution modeling. In Proceedings of the Twenty-First International Conference on Machine
Learning, pages 655-662

Steven J. Phillips, Robert P. Anderson, Robert E. Schapire. 2006. Maximum entropy modeling of species
geographic distributions. Ecological Modelling, Vol. 190, pages 231-259

Jane Elith, Steven J. Phillips, Trevor Hastie, Miroslav Dudík, Yung En Chee, Colin J. Yates. 2011. A
statistical explanation of MaxEnt for ecologists. Diversity and Distributions, Vol. 17, pages 43-57
You can also read