Hydrological projections for floods in Norway under a future climate - Deborah Lawrence Hege Hisdal - NVE
←
→
Page content transcription
If your browser does not render page correctly, please read the page content below
Hydrological projections
for floods in Norway under
a future climate
Deborah Lawrence              5
Hege Hisdal
                             2011

                             R
                             E
                             P
                             O
                             R T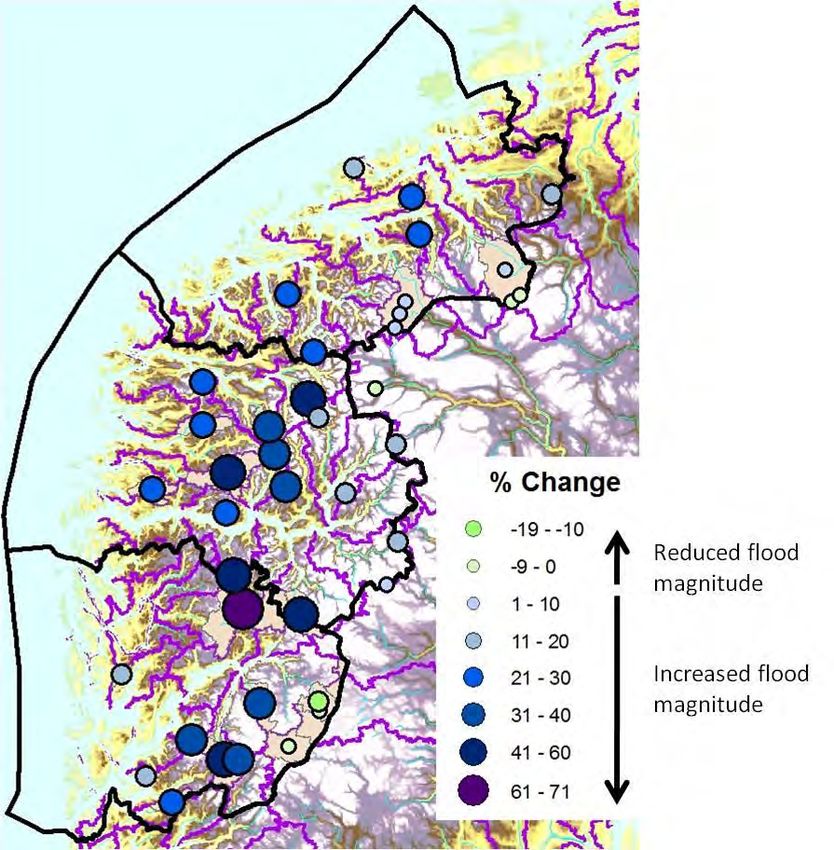
Hydrological projections for
floods in Norway under a future
            climate

     Norwegian Water Resources and Energy Directorate
                         2011
Report no. 5 – 2011
Hydrological projections for floods in Norway under a
future climate

Published by:    Norwegian Water Resources and Energy Directorate
Authors:         Deborah Lawrence and Hege Hisdal

Printed by:     Norwegian Water Resources and Energy Directorate
Number
printed:        50
Cover photo:    Near Berget 156.10 gauging station, September, 2009. (Photo:
                Section for Hydrometry, NVE)
ISSN:           1502-3540
ISBN:           978-82-410-0753-8

Abstract:       An ensemble of regional climate scenarios, calibrated
                hydrological models and flood frequency analyses are used to
                assess likely changes in hydrological floods under a future
                climate in Norway for two periods, 2021-2050 and 2071-2100.
                Analyses are based on detailed modelling for 115 catchments,
                and changes in the mean annual flood, the 200-year and the 1000-
                year floods are estimated. Regional guidance for using the
                projections in climate change adaptation planning is also
                presented.

Key words:      Climate change adaptation, HBV hydrological model,
                uncertainty, flood risk

 Norwegian Water Resources and Energy Directorate
 Middelthunsgate 29
 P.O. Box 5091 Majorstua
 N 0301 OSLO
 NORWAY

 Telephone: +47 22 95 95 95
 Fax: +47 22 95 90 00
 E-mail: nve@nve.no
 Internet: www.nve.no

 June 2011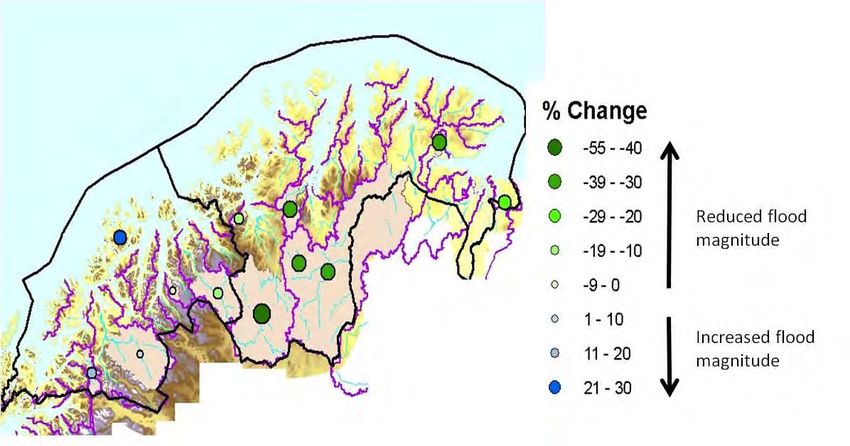
Contents
Preface ................................................................................................. 4
Summary ............................................................................................. 5
1 Introduction ................................................................................... 6
2 Background................................................................................... 7
3 Methods ......................................................................................... 8
3.1 Ensemble methodology for analysis of hydrological impacts .......... 8
3.2 Hydrological modelling ................................................................... 9
3.3 Flood frequency analysis ..............................................................11
4 Climate scenario data................................................................. 13
4.1 Sources of RCM data....................................................................13
4.2 Adjustment of regional climate data ..............................................14
5 Projections for changes in floods ............................................. 15
5.1 Mean annual flood ........................................................................16
5.2 Changes in seasonality of peak flows ...........................................18
5.3 200-year flood ...............................................................................21
5.4 1000-year flood .............................................................................22
5.5 Regional patterns of projected change ..........................................23
6 Variability in ensemble projections........................................... 24
6.1 10th to 90th percentile range in projections .....................................24
6.2 Factors contributing to differences between projections ................27
6.3 Other factors contributing to uncertainty........................................30
7 Local factors ............................................................................... 30
7.1 Catchment area ............................................................................31
7.2 Catchment relief ............................................................................31
7.3 Catchment median elevation.........................................................32
7.4 Location relative to coastline .........................................................33
7.5 Summary of local factors ..............................................................34
8 Guidance for use of results in climate change adaptation ..... 35
8.1 Troms and Finnmark .....................................................................35
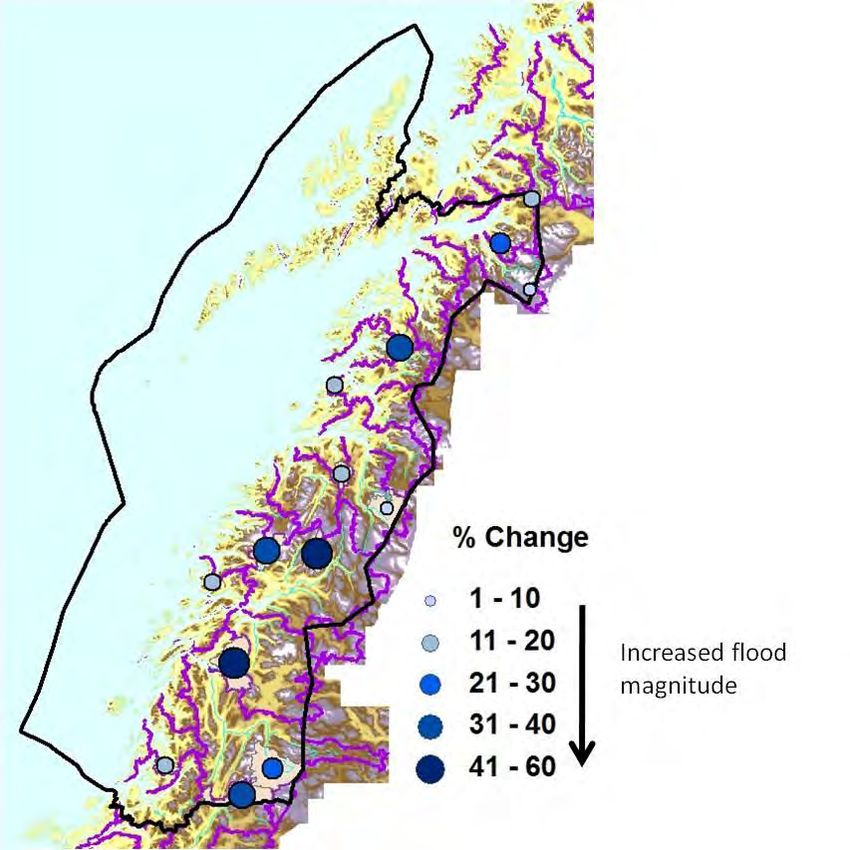
8.2 Nordland .......................................................................................37
8.3 Trøndelag .....................................................................................39
8.4 Møre and Romsdal, Sogn and Fjordane, Hordaland .....................40
8.5 Rogaland and Agder .....................................................................42
8.6 Østlandet ......................................................................................43
9 Further comments ...................................................................... 45
Acknowledgements .......................................................................... 45
References......................................................................................... 45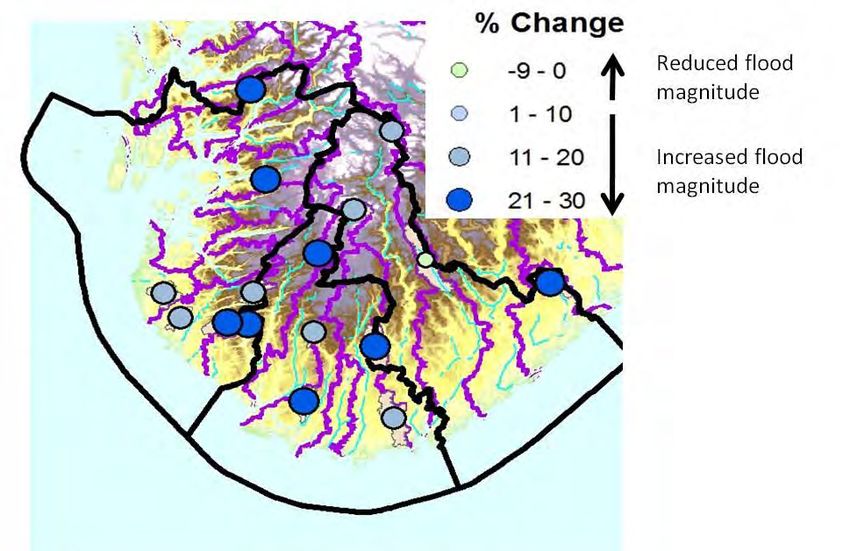
Summary
Ensemble modelling based on locally-adjusted precipitation and temperature data from 13
regional climate scenarios is used to assess likely changes in hydrological floods between
a reference period (1961-1990) and two future periods (2021-2050) and (2071-2100).
The adjusted climate scenario data are input to hydrological models for 115 catchments
distributed throughout Norway. The ensemble of models also includes 25 calibrated
parameter sets for each catchment, so that uncertainty introduced by hydrological
modelling can be considered, in addition to differences between alternative climate
scenarios. Simulated hydrological time series are analysed using flood frequency
estimation to determine the magnitude of flows of given return periods, and the
uncertainty introduced by this analysis is also considered for a subset of results.

Projections for changes in the mean annual flood, the 200-year flood and the 1000-year
flood are given for each catchment based on the median value of the ensemble for the
catchment. Although there is considerable variation in the range of projections for
individual catchments, consistent regional patterns in the projections are evident. The
western region of Norway and Nordland are associated with the largest percentage
increases in the magnitude of the mean annual flood and floods of longer return periods.
In addition, catchments located near the coast tend to have an increased flood magnitude
in all regions, with the exception of Finnmark. Large catchments with source areas
located in inland regions, such as Oppland and Hedmark and parts of Trøndelag, and in
the northernmost region, Finnmark and Trøms, are generally expected to have reduced
flood magnitudes under a future climate. Differences between regions largely reflect the
relative roles of snowmelt vs. rainfall in the flood regimes in the catchments. Warmer
winter and spring temperatures leading to reduced snow storage and earlier snowmelt will
most likely bring about a reduction in the magnitude of floods derived primarily from
snowmelt in the future. Simultaneously, increases in autumn and winter rainfall
throughout Norway will increase the magnitude of peak flows during these seasons. In
areas already dominated by autumn and winter floods, the projected increases in flood
magnitude are large. There are also areas currently dominated by snowmelt floods in
which autumn and winter rainfall floods are expected to become increasingly important in
the future. In some cases, this change in seasonality will also lead to an overall increase in
the magnitude of the mean annual flood and of floods of longer return periods.
Variations in projected changes in flood magnitude between catchments in the same
region are also evaluated with respect to differences in catchment area, steepness, median
elevation, and inland location. Catchments with areas < 100 km2 are in most cases
associated with projected increases in flood magnitude. Similarly, steeper catchments are
generally found to have larger projected increases than less steep catchments. Catchments
with median elevations of < 500 m and catchments with midpoints < 100 km from the
coast are both associated with increased flood magnitudes in most cases.

Due to the uncertainties in the detailed projections for individual catchments and to the
need to generalise the results to areas outside the calibrated catchments, three categories
are proposed for use in climate change adaptation planning: 0% change, 20% change and
40% change. The final section of this report presents regional guidance for determining
which of these three categories is most appropriate for a given water course.

                                            5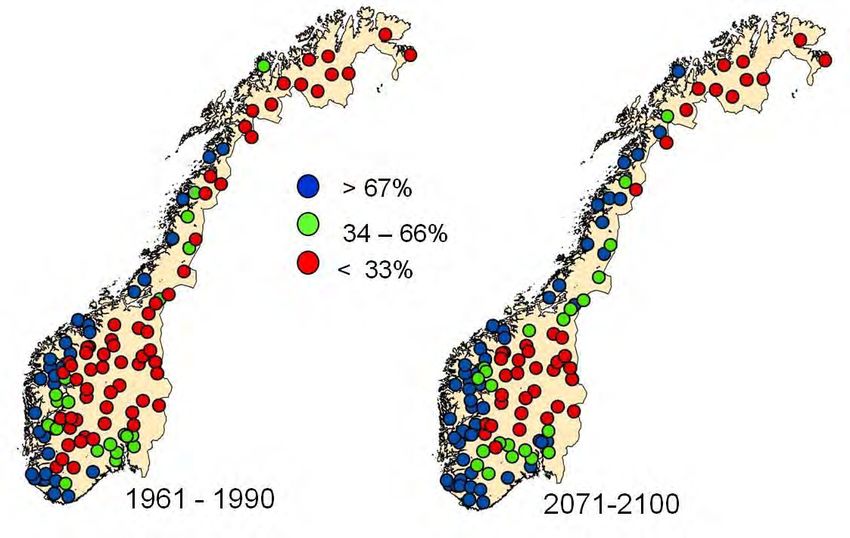
1 Introduction
Climate change projections for Norway indicate changes in both temperature and
precipitation regimes in the future (Hanssen-Bauer, et al., 2009). The average
temperature is expected to increase in all seasons throughout the country, and the average
annual temperature will increase by between 2.3 and 4.6 °C by the end of the century.
The average annual precipitation is also expected to increase by 5 to 30%, although there
are large differences between seasons and between regions in Norway. The largest
increases in precipitation are expected during the autumn and winter months at most
locations. These changes in temperature and precipitation regimes will, in turn, impact
the magnitude and, in some cases, the seasonality of peak runoff and floods throughout
the country. Due to the significant role of catchment storage (e.g. lakes, snow, soil and
groundwater) in altering the timing between precipitation and runoff, there is not a simple
one-to-one relationship between projected changes in precipitation and corresponding
changes in runoff. Hydrological modelling based on locally-adjusted climate scenario
data must therefore be used to assess the impact that changes in precipitation and
temperature will have on land surface processes, such as stream flow generation leading
to floods.
In this report, the likely consequences of climate change on low frequency high flow
events (e.g. the 200-year flood) are evaluated based on the results of HBV hydrological
modelling at 115 locations distributed throughout Norway. The locations represent
unregulated catchments for which local observed stream flow data forms the basis for
calibrating the HBV model for historical time periods, as previously reported in Lawrence
et al. (2009). Input data from several climate scenarios are used in the hydrological
models to simulate runoff time series for a reference period (1961-1990) and two future
periods (2021-2050 and 2071-2100). The runoff time series simulated by the
hydrological models are evaluated using flood frequency analysis based on the annual
maximum series, and the percentage changes in the magnitude of the mean annual flood,
the 200-year flood and the 1000-year flood are assessed. Likely changes in the
seasonality of peak flows are also evaluated from the simulated runoff series.
Climate change adaptation planning is necessarily reliant on model simulations for future
conditions, as observed runoff data are, of course, unavailable for future periods.
Additionally, traditional flood frequency analyses for predicting the magnitude of events
such as the 200-year and 1000-year flood are often based on a limited period of record
(typically 30-50 years) when compared with the return period of the estimated flood. In
this case, short- and long-term patterns of climate variability, either man-induced or
otherwise, are not necessarily well-represented by the available observed data. Most
flood frequency analyses are also based on the assumption of stationarity. This
assumption requires that both the observed time series and the future conditions for which
the likelihood of events are estimated do not have trends. This requirement is no longer
met as climate change begins to alter patterns of rainfall and runoff over the time periods
considered. Both of these factors can undermine the robustness of many analyses based
on observed data. Flood frequency analyses based on modelled, rather than observed, data
therefore makes an important contribution in the assessment of flood hazards. A
significant drawback with the use of modelled data, however, is that results can vary
between models and, in the case of climate change, between the greenhouse gas

                                           6
emissions scenarios considered. Therefore, in the work presented here, an “ensemble”
approach has been applied in which several climate scenarios, hydrological model
calibrations and flood frequency analyses are used to develop a range of projections for
each catchment. This methodology also enables the quantification of some of the
uncertainties inherent in the projections.

The detailed quantitative results presented in the first several sections of this report relate
to the 115 unregulated catchments for which the HBV hydrological model has been
calibrated. To use these results in practical applications, such as flood hazard mapping
and dam safety analyses, they must be generalised to other catchments and areas.
Therefore, the final sections of this report present an assessment of expected changes in
floods on a regional basis, as interpreted from the spatial pattern of results for the 115
catchments. Factors which contribute to local variation in the response to climate change,
such as catchment size, topography, and location relative to coastal influences, are also
considered. Guidance is then presented for six regions in Norway in which expected
changes in flood magnitude are classified into three categories: 0%, 20%, and 40% for
different catchment types in each of the regions. Due to the many uncertainties in the
simulations for future periods, it is not considered appropriate at this point in time to
develop more detailed projections based, for example, on the use of regional regression
equations. In addition, future generations of regional climate models and methods for
locally adjusting precipitation and temperature data will most likely modify the detailed
catchment-scale projections. It is expected, however, that the general regional patterns
will remain unchanged. The classification of likely changes based on three simple
categories is therefore considered to be the most robust use of currently available
knowledge regarding climate change impacts on future floods.

2 Background
Hydrological projections for changes in runoff and peak flows in Norway under a future
2071-2100 climate have been previously reported by NVE (Beldring et al., 2006; Roald,
et al., 2006) based on the regional climate scenarios available at the time. Percentage
changes in flood statistics have been evaluated for 23 catchments (Roald et al., 2006)
using three regional climate scenarios from the RegClim project (Bjørge et al., 2000).
The results indicate both wide-ranging responses to climate change in the individual
catchments and considerable differences between projections from different climate
scenarios. However, it is generally concluded that large snowmelt floods will be less
common under a future climate, and that annual snowmelt floods will occur earlier in the
year. It is also proposed that intensive local rainfall floods will become more frequent.
In similar work, Beldring et al. (2006) evaluate the percentage change in the mean annual
flood and the 50-year flood in four catchments based on an ensemble of climate scenarios
derived from two alternative global climate models run under two different greenhouse
gas emission scenarios. The results indicate moderate decreases in flood magnitude for
the inland catchment (Nybergsund in Trysil) and the northernmost catchment (Masi in
Alta), while moderate increases are projected for the southern coastal catchment
(Flaksvatn in Tovdal) and moderate to large increases are expected for the western
catchment (Viksvatn in Gaular).

                                             7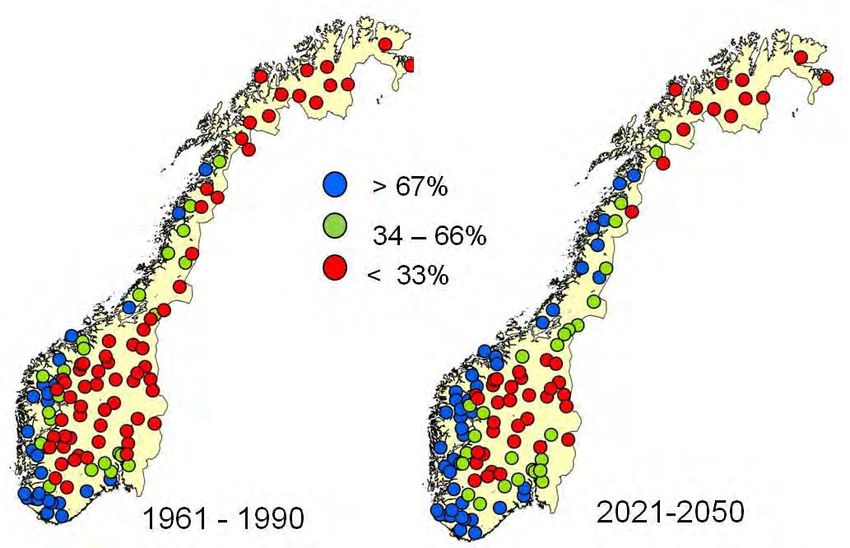
The previous work by NVE on changes in flood statistics under a future climate is based
on a limited number of catchments and their spatial distribution is not particularly
uniform over Norway, with only three catchments representing the area north from
Trøndelag and no catchments in south-eastern Norway in the region around Oslo.
Additionally, a newer generation of higher resolution regional climate scenarios are now
available from the EU FP6 Ensembles Project (van der Linden et al., 2009) and come
from updated climate models and methods for linking global and regional climate models.
Therefore, in order to generate a set of hydrological projections that can contribute to an
adaptation strategy for managing expected climate change impacts on floods throughout
Norway, the work presented in this report was undertaken. The report presents analyses
based on the most up-to-date climate scenario data currently available and also considers
a denser and more uniform selection of catchments for hydrological modelling, so that
regional patterns of expected change can be evaluated.

3 Methods
3.1 Ensemble methodology for analysis of
    hydrological impacts
To assess climate change impacts on flood frequency, a modelling scheme comprised of a
series of linked models is required (Figure 3.1). Climate change analyses are based on
simulations derived from large-scale Global Climate Models (GCMs) which model
atmospheric, and in some cases, linked oceanic processes, both for historical and future
periods. For modelling future periods, the GCMs are run under so-called „SRES‟
emission scenarios representing various alternatives as to how society and technology
will develop through the 21st century and the impacts this will have on greenhouse gas
emissions (IPCC, 2000). The output from the GCM model runs must be dynamically
downscaled to a higher resolution grid (e.g. 25 x 25 km) using Regional Climate Models
(RCMs) before they are suitable for regional scale impact analyses. At each stage in this
climate modelling chain, the alternative SRES scenarios and GCM/RCM models can
produce dissimilar results. Therefore, for climate impact analyses, it is considered to be
good practice to use several models and to evaluate the range of results, rather than to
limit consideration to a single GCM/RCM combination (e.g. Wilby and Harris, 2006).
The impact of the alternative SRES emission scenarios is more significant towards the
end of the century than over shorter timescales. It is, thus, also necessary that impact
analyses which assess changes over this time period consider GCMs run under alternative
SRES scenarios.
For use in catchment-based hydrological analyses (such as are required to evaluate flood
frequency) the output series from RCMs must be further adjusted to a local scale
corresponding to observed precipitation and temperature data. These techniques correct
one or more of the statistical moments (e.g. mean, standard deviation) of the monthly
modelled data to better match local observations during a historical period. There are
different methods for achieving this correction, and these methods entail assumptions as
to how the statistical moments will change in future periods. Consequently, the
alternative methods can lead to differing results when the adjusted input data are used in
hydrological modelling (e.g. Beldring et al., 2008).

                                           8
Figure 3.1 Linkages between models and data used for estimating changes in flood
frequency under a future climate.
Hydrological modelling and flood frequency analysis also involve methods which can
produce dissimilar results. This reflects, in part, so-called „equifinality‟ in which
different combinations of model parameters or processes produce the same fit to observed
data and therefore are not differentiated during model calibration. Recent analyses of
uncertainty in hydrological projections for climate change impacts on the mean annual
flood indicate that, in some cases, uncertainty derived from hydrological model
parameters is as large as that introduced by alternative climate models and emission
scenarios (Lawrence and Haddeland, 2011). Similarly, uncertainty in the parameters
estimated in flood frequency analysis and in the selection of the extreme value
distribution for the estimation lead to a best-fit model that represents only one of many
alternative models for the flood data and for the projections derived from those data.
Due to the factors highlighted above, each step illustrated in Figure 3.1 is associated with
a selection of alternative models, methods and approaches. Therefore, in order to capture
the range of possible changes in flood magnitudes under a future climate, an ensemble
methodology is applied here in which data from several GCM/RCM combinations are
used for hydrological modelling of climate change impacts on floods. Simulations for the
2071-2100 period also sample alternative SRES scenarios. Two alternative techniques for
adjusting precipitation and temperature data to a local scale are also represented in both
future periods. The hydrological modelling is based on several alternative best-fit HBV
model parameter sets such that uncertainty introduced by model parameterisation can be
quantified. The general framework is similar to that applied in Lawrence and Haddeland
(2011), although here the additional uncertainty associated with flood frequency analysis
is also considered.
3.2 Hydrological modelling
The HBV hydrological model (Bergström, 1995; Sælthun, 1996) was calibrated and
validated for 115 catchments distributed throughout Norway as described in Lawrence, et
9al. (2009). These catchments are also used for hydrological modelling in connection with
NVE‟s flood warning services. Catchment area varies from approximately 3 km2 to
15,500 km2 (Figure 3.2), with a median value of 190 km2. Thus, smaller catchments are
fairly well represented in the modelling, and the overall spatial distribution of the
catchments is reasonably uniform (Figure 3.3). The spatial distribution of larger
catchments is, however, not so uniform. Larger catchments are generally associated with
the inland and northernmost areas, and for some of these catchments, smaller nested
catchments within these larger catchments also form part of the sampled set in these
areas. Such a nested hierarchy is not feasible in other areas due to regional physiographic
differences and to the need for long-time series of historical data for unregulated
catchments for model calibration. This requirement limits the selection of gauged
catchments available for modelling.
Figure 3.2 Distribution of catchment areas for the 115 catchments with calibrated
models.
The HBV model was calibrated and validated for each catchment using observed daily
average discharge at the catchment outlet. The model simulations are based on 1 x 1 km
gridded daily precipitation and temperature data for the period 1961-2008. Hydrological
modelling was based on a daily time step, reflecting the temporal resolution of the input
precipitation and temperature data. Thus, the modelled runoff values represent daily
average values, rather than instantaneous peak values. The period 1972-1995 was used
for model calibration and the remaining years for model validation for most of the
catchments. For catchments where discharge data are not available for the entire period
(for example, catchments with records beginning after 1961), the calibration and
validation periods were adjusted to fit the available data. Further details regarding the
available discharge records for individual catchments can be found in Lawrence et al.,
2009.
Model calibration was accomplished using PEST parameter estimation routines (see
Lawrence, et al., 2009 for further details), and 150 different best fit model parameter sets
were calibrated for each catchment. The best 25 parameter sets were selected for each
catchment for further use, such that for individual catchments the Nash-Sutcliffe criterion
(which assesses the model fit) varies by no more than 2%. The Nash-Sutcliffe values for
10the fitted models for the catchments are illustrated in Figure 3.3 and indicate good to
excellent model fits in most areas. The best model fits (> 0.85) tend to be associated with
larger catchments in regions where the annual flow regime is dominated by a spring or
summer snowmelt. Poorer model fits are often obtained in western and coastal regions
where steep topography and large local gradients in rainfall contribute to a higher degree
of model uncertainty. Hydrological simulations for future climatic conditions were
undertaken using the 25 best fit parameters for each catchment based on input data from
climate scenarios, as described in Section 4.1 later in this report.
Figure 3.3 Location of the 115 catchments used for HBV model calibration, with the
catchment boundaries indicated. The value for the Nash-Sutcliffe criterion based on daily
discharge values is indicated by colour.
3.3 Flood frequency analysis
In order to estimate the probability of a peak flow of a given magnitude or, conversely, to
assess the magnitude of a flow with a given probability, flood frequency methods must be
applied. These methods have been used for many years in hydrology to estimate the
likelihood of low frequency events with long return periods. Observed hydrological time
series are typically between 20 and 50 years in length, which is usually shorter than the
design periods for which extreme events are estimated. In Norway, flood frequency
analysis is undertaken in connection with flood hazard mapping, for which the 200-year
flood is used, representing a flood magnitude with a 0.5% likelihood of occurrence in any
11given year. For dam safety, the 500 and 1000-year floods are considered, depending on
the safety class of the dam, and these represent floods with likelihoods of 0.2% and 0.1%,
respectively.
As is the case with all types of modelling, either statistically-derived or based on
numerical simulation models, estimates obtained using flood frequency analysis are
associated with uncertainty. For the analysis of historical time series, the observed data
can have significant error or bias. In the analyses presented here, simulated hydrological
data are analysed, and in this case, the lack of a perfect hydrological model fit to peak
flows can also introduce error in the analysis. Flood frequency analysis is also based on
the assumptions that the events analysed are independent of each other, that they
represent the same flood generating mechanism, and that there are no trends in the
sequence of events. These assumptions are rarely fully satisfied in practise, and thus,
deviations from these assumptions also introduce error. In addition, the choice of the
extreme value distribution used for the analysis, the methods used to estimate the model
parameters, and the techniques for plotting events introduce uncertainty. As is true for all
statistical analyses, uncertainty in the statistical model parameters increases as the
number of observations available for analysis decreases. In flood frequency analysis,
uncertainty increases with increasing return period, due to the larger discrepancy between
the length of the record used for the analysis and the return period.
Flood frequency analysis in Norway is usually based on block maxima methods in which
the analysed series is comprised of, for example, the annual maximum flows from the
observed data series. A statistical function (e.g. LogNormal, Generalised Extreme Value)
is fitted to the annual maximum series, and the resulting curve is used to estimate the
magnitude of flows of a given return period (Figure 3.4). These fitted functions represent
statistical models for the likely occurrence of extreme events, and the two or three model
parameters define the shape of the curve. The standard practise in flood frequency
analysis in Norway for specific sites is to consider several types of model fits before the
best alternative is selected.
To analyse the percentage change in the magnitude of a flow of a given return period (e.g.
the 200-year flood), flood frequency analysis is applied to the annual maximum series
from the simulated daily flows for each of two periods, a reference period representing
historical conditions (1961-1990) and a future period (2021-2050 or 2071-2100). The
two-parameter Gumbel distribution (equivalent to the Generalised Extreme Value type I
distribution) is used to model the annual maximum series, and the percentage change in
flood magnitude is estimated as the difference between the two curves (Figure 3.4)
divided by the flood magnitude for the reference period (1961-1990). The Gumbel
distribution was chosen for the analysis due to the limited length of the data series (i.e. 30
values of the annual maximum for each time period) which makes the fitting of a three-
parameter distribution very uncertain. It is also a suitable distribution according to
extreme value theory (Coles, 2001) and has been widely applied, including in other recent
studies of climate change impacts on floods in Europe (e.g. Dankers and Feyen, 2008;
Veijalainen et al., 2010). The Gumbel distribution was fitted to the annual maximum
series by the probability weighted moments method using the fExtremes package in the R
statistical programming language. The uncertainty introduced by the fitting of model
parameters was also considered for the simulations for the 2071-2100 period, and for this
case, both a two-parameter Gumbel distribution and a three-parameter GEV distribution
12were used for flood estimation. Note that in the application here, it is only the percentage
change which is reported, rather than the absolute flood magnitudes. This approach is
used to minimise the impact of the uncertainties described previously in this section. A
critical assumption, however, is that the underlying extreme value distribution used
(whether a two-parameter Gumbel or a three-parameter GEV distribution) is suitable both
for the present and for the future climate.
Figure 3.4 Example flood frequency analysis of annual maximum series from simulated
data for a reference (1961-1990) and a (2071-2100) future period, based on the two-
th th
parameter Gumbel distribution. The 10 and 90 percentile confidence bounds are
indicated to illustrate the uncertainty in the estimation of a discharge of a given return
period. The blue arrow indicates the difference in the estimated magnitude of the
discharge with a 200-year return period for the reference vs. the future period.
4 Climate scenario data
4.1 Sources of RCM data
The locally-adjusted precipitation and temperature data sets available for the hydrological
simulations are based on the SRES/GCM/RCM combinations listed in Table 4.1. Three
of the RCM scenarios were generated in the RegClim (Regional Climate Development
under Global Warming) project (Bjørge et al., 2000) and have a spatial resolution of
55 x 55 km, prior to local adjustment. One of these GCM/RCM combinations
(ECHAM4/HIRHAM B2) is also available at a 25 x 25 km resolution. The remaining
scenarios come from the EU FP6 ENSEMBLES project (van der Linden, et al., 2009), a
collaborative European project focusing on generating climate simulations representing
different combinations of state-of-the-art GCMs and RCMs. All ENSEMBLES scenarios
have a 25 x 25 km grid cell resolution prior to local adjustment. In total, there are 13
scenarios available for assessing changes between a 1961-1990 reference period and a
2021-2050 future period, and 13 scenarios for the 2071-2100 future period. The 13
available scenarios differ somewhat, as only nine of the scenarios are common to both
periods. The scenarios for 2071-2100 represent three SRES emissions scenarios, A2,
13A1b, and B2, which correspond to low, medium and high levels of greenhouse gas
emissions, respectively (see Meehl, et al., 2007 for further details). Although three of
these scenarios come from the coarser-gridded (55 x 55 km) RegClim simulations, they
are used here so that uncertainties as to how greenhouse gas emissions will develop
during the latter half of the 21st century are also covered in this analysis. All of the
ENSEMBLES simulations are based on the A1b (medium) SRES emission scenario.
Table 4.1 Climate change scenarios providing precipitation and temperature data
SRES Spatial Future
Domain/RCM Local
GCM (Emission Resolution periods
scenario) (institution) adjustment
(km2) used
RegClim/HIRHAM Empirical
HadAm3H A2 55 x 55 2071-2100
(met.no) adjustment
RegClim/HIRHAM Empirical
HadAm3H B2 55 x 55 2071-2100
(met.no) adjustment
RegClim/HIRHAM Empirical
ECHAM4 B2 55 x 55 2071-2100
(met.no) adjustment
NorAciaNorClim/ Empirical
ECHAM4 B2 25 x 25 2071-2100
HIRHAM (met.no) adjustment
Ensembles/RCA3 Empirical 2021-2050
BCM A1B 25 x 25
(SMHI) adjustment 2071-2100
Ensembles / Empirical
HadCM3ref A1B 25 x 25 2021-2050
HIRHAM (met.no) adjustment
Ensembles / Empirical 2021-2050
ECHAM5 A1B 25 x 25
HIRHAM5 (DMI) adjustment 2071-2100
Ensembles /RCA3
BCM A1B 25 x 25 Delta change 2021-2050
(SMHI)
Ensembles
HadCM3ref A1B 25 x 25 Delta change 2021-2050
/HIRHAM (met.no)
Ensembles /
ECHAM5 A1B 25 x 25 Delta change 2021-2050
HIRHAM5 (DMI)
Ensembles / 2021-2050
Arpege A1B 25 x 25 Delta change
HIRHAM5 (DMI) 2071-2100
Ensembles /HadRM 2021-2050
HadCM3ref A1B 25 x 25 Delta change
(Hadley Centre) 2071-2100
Ensembles /HadRM 2021-2050
HadCM3high A1B 25 x 25 Delta change
(Hadley Centre) 2071-2100
Ensembles /HadRM 2021-2050
HadCM3low A1B 25 x 25 Delta change
(Hadley Centre) 2071-2100
Ensembles /REMO 2021-2050
ECHAM5 A1B 25 x 25 Delta change
(Max Planck Inst.) 2071-2100
Ensembles /RCA3 2021-2050
ECHAM5 A1B 25 x 25 Delta change
(SMHI) 2071-2100
Ensembles /RCA3 2021-2050
HadCM3low A1B 25 x 25 Delta change
(SMHI) 2071-2100
4.2 Adjustment of regional climate data
The RCM data for daily precipitation and temperature were further adjusted from the
RCM grid cell resolution to the 1 x 1 km grid covering the whole of Norway. For
Norway, this adjustment is made relative to the 1 x 1 km gridded precipitation and
14temperature data now available for the country (Mohr, 2008; Mohr and Tveito, 2008).
Two methods were used for the adjustment: the widely applied “delta change” method
(Reynard et al., 2001) and an empirical adjustment method developed by the Norwegian
Meteorological Institute (Engen-Skaugen, 2007). The delta change method uses estimates
of monthly changes in precipitation and temperature derived by comparing monthly
values between a reference and a future period. These „change factors‟ are then applied
to observed data with the precipitation factor calculated as a percentage change and the
temperature factor as an change in C. A smoothing routine is used to eliminate sharp,
abrupt changes between days at the beginning and end of each month. This method is
simple to implement and has been widely applied in climate impact research. The
advantage of this technique is that it is applied directly to the gridded, historical dataset
and thus preserves all of the statistical moments of the local data for the period of
observation. However, important changes, for example in the standard deviation of
precipitation values between historical and future periods, are not transferred from the
climate model output to the locally adjusted data with this method. The empirical
adjustment method, one the other hand, works directly with RCM data for both the
historical and future periods. The mean and standard deviation of the RCM data for the
historical period are corrected relative to gridded, observed data. A further adjustment is
applied to RCM output for future scenario periods, based on residuals representing the
variability in daily precipitation and temperature. The method transfers changes in
monthly mean values and in the monthly standard deviation, which is its primary
advantage over the delta change method. The primary disadvantage is that only the mean
and standard deviation are used for the correction relative to observed data. Higher
statistical moments (e.g. skewness) or extreme values better represented by other
statistical distributions (e.g. gamma distribution for rainfall) are not corrected relative to
observed data. It is anticipated that the two methods for the local adjustment of RCM
data will give differing results, which may be significant in the analysis of changes in
floods. At this point in time, there is insufficient evidence to justify the choice of one
method over the other for use in analyses of future flooding, and this is a topic of ongoing
research. Therefore, scenarios adjusted using both of these methods have been included
in the ensemble of models used here.
5 Projections for changes in
floods
The models and methods described in Sections 3 and 4 were used for simulating daily
runoff for a reference period (1961-1990) and two future periods (2021-2050 and 2071-
2100). The core modelling ensemble for each catchment for each future time period is
comprised of 325 simulations, reflecting input data from 13 sets of adjusted RCM output
(Table 4.1) and simulation with 25 HBV parameter sets. For each simulation, the
percentage change in a particular flow quantity was calculated by comparing the values
for the reference and the future periods. For the projections for changes in peak flows of a
given return period (e.g. the 200-year flood), the Gumbel two-parameter distribution was
used to estimate the magnitude of the flow in each period, and the percentage change was
calculated as the difference between the 200-year flood given by the two fitted
distributions (i.e. as illustrated in Figure 3.4). For the case of the 2071-2100 simulations,
15the ensemble was expanded to also consider uncertainty introduced by flood frequency
estimation, and this is described in Section 6.2.
The results from all of the simulations were compiled for each catchment as a cumulative
distribution function representing the range of results from the modelling ensemble. The
projections presented in this section for the change in the mean annual flood, the 200-year
flood and the 1000-year flood are based on the median value of the ensemble for each
catchment. Thus, half of the estimated values for the percentage change are larger and
half are smaller than the median value given. The range of the results for each catchment
is, therefore, also of interest as it reflects the level of agreement between the simulations
as to the direction and magnitude of the projected change. This variability within the
ensemble and the factors contributing to it are presented and discussed in Section 6.
5.1 Mean annual flood
The general characteristics of observed peak stream flows are often assessed and reported
based on the mean annual flood. This quantity is also relevant because the annual
maximum flood series is used for estimating the 200-year and 1000-year floods. The
projected percentage changes in the mean annual flood between the reference period
1961-1990 and the future periods 2021-2050 and 2071-2100 are illustrated in Figure 5.1
and Figure 5.2, respectively.
Figure 5.1 Projected percentage changes in the mean annual flood between the 1961-
1990 reference period and the 2021-2050 future period, based on the median of the
ensemble of hydrological projections for each catchment. Green indicates a reduced
flood magnitude and blue indicates an increase in flood magnitude.
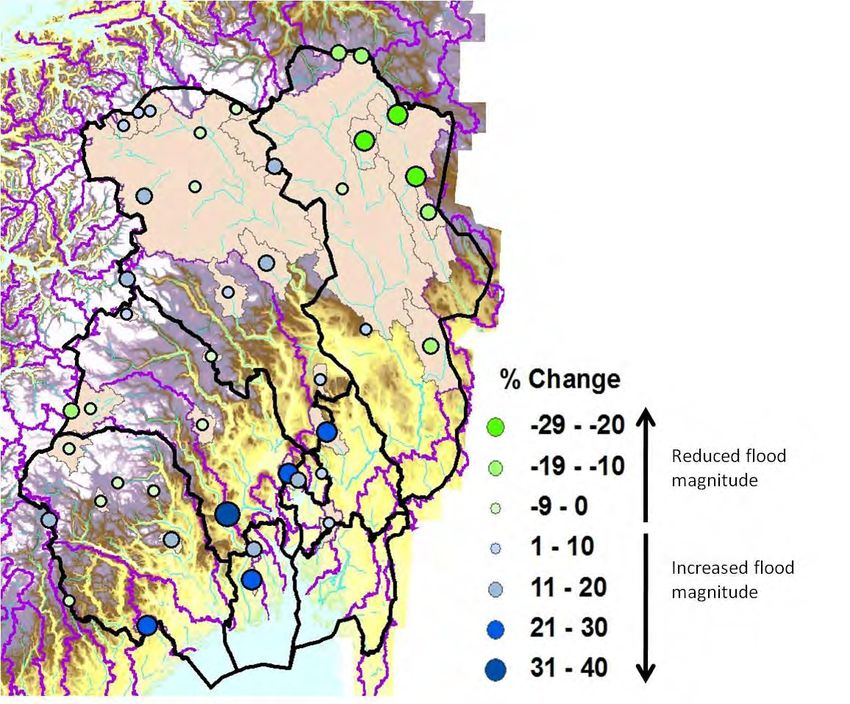
16The general pattern of change illustrated by the figures for both periods is one in which
there is significant variation from region to region. The projections indicate that the
northernmost areas (Finnmark and parts of Troms) and middle and southern inland areas
(Hedmark, Oppland, and parts of Buskerud, Telemark and Trøndelag) will experience a
decrease in the mean annual flood. Catchments located in western and south-western
regions (Vestlandet) and coastal regions of southern and south-eastern Norway (Sørlandet
and Østlandet) will experience an increase in the mean annual flood, as interpreted from
the ensemble median. In addition, the more coastal catchments of Nordland are
associated with an increase in this quantity.
Figure 5.2 Projected percentage changes in the mean annual flood between the 1961-
1990 reference period and the 2071-2100 future period, based on the median of the
ensemble of hydrological projections for each catchment. Green indicates a reduced
flood magnitude and blue indicates an increase in flood magnitude.
The regional patterns illustrated for the two future periods are similar, although the
magnitude of the changes, and thus, the differences between the regions is amplified as
the end of the century is approached (Figure 5.2). In particular, Vestlandet, most of
Sørlandet and Nordland, as well as the coastal region of south-eastern Norway, are
associated with projected increases in the magnitude of the mean annual flood of > 20%.
Large decreases in the mean annual flood are projected for Finnmark and for the areas
adjacent to the Swedish border in Hedmark. The remaining areas represent transitional
areas in which neither large increases nor large decreases are projected.
17Differences in the response of the catchments in the various regions largely reflect the
role of snowmelt vs. rainfall in inducing the highest flows during the course of a year.
Increased winter temperatures will generally lead to a reduction in snow storage because
a higher proportion of winter precipitation falls as rain. Consequently, areas associated
with spring peak flows under the current climate will in many cases see a reduction in the
magnitude of peak flows during the snowmelt season under a future climate. An
exception to this is possibly small catchments at higher elevations in areas where winter
precipitation continues to fall predominantly as snow and higher spring and early summer
temperatures produce a rapid snowmelt. These cases were found to have relatively
modest increases in the mean annual flood (< 10%). Simultaneous with the generally
decreased magnitude of the snowmelt flood, increases in autumn and winter rainfall will
increase the magnitude of peak flows during the autumn and winter in most areas. In
areas where rainfall-induced runoff dominates peak flows under the current climate,
increased rainfall in the future will contribute directly to an increase in the mean annual
flood. There are also catchments which are dominated by spring snowmelt floods under
the current climate and which exhibit an increased tendency towards autumn and winter
peak flows in the future.
5.2 Changes in seasonality of peak flows
In addition to changes in the magnitude of peak flows described in the previous section,
changes in the seasonality of peak flows are also projected. Changes in seasonality can
occur due to two differing sets of processes: 1) warmer spring temperatures and reduced
snow storage leading to an earlier peak in snowmelt runoff; or 2) increased autumn and
winter rainfall in areas currently dominated by spring snowmelt leading to a change in the
dominant flood type, as well as the dominant flood season. In neither of these cases is a
change in seasonality necessarily associated with an increased flood magnitude, although
in some cases it is. A change in seasonality can also have significance for floods
associated with other processes such as river ice breakup and jamming.
The change in the seasonality of the mean annual flood was considered for both future
periods, 2021-2050 and 2071-2100. The analysis considered the percentage of the annual
peak flows occurring outside the period March – July, which was taken to broadly
represent the period in which snowmelt is likely to have contributed significantly to the
peak flow. For the four catchments with a > 25% glacier cover, this period was extended
to August. The annual peak flows occurring outside of this period are thus considered to
represent annual maximum flows in which rainfall is primarily responsible for the high
flow, although rapid snowmelt potentially also makes a contribution in some areas. The
results of the analysis are illustrated in Figure 5.3 and Figure 5.4 for both the reference
and the two future periods. It should be noted that the two sets of 13 scenarios available
for the two future periods differ (Table 4.1). There are, therefore, minor differences in the
distribution for the reference period, and the results for 2071-2100 do not represent a
direct progression from the state shown for the 2021-2050.
18Figure 5.3 Percentage of annual maximum flows occurring during the period August –
February (September - February for four catchments with a significant glacial cover) for
the 1961-1990 reference period as compared with the 2021-2050 future period.
Figure 5.4 Percentage of annual maximum flows occurring during the period August –
February (September - February for four catchments with a significant glacial cover) for
the 1961-1990 reference period as compared with the 2071-2100 future period.
19The results illustrated in Figure 5.3 and Figure 5.4 indicate a clear expansion of the
regions currently dominated by autumn and winter peaks flows (blue points), particularly
in western Norway, and a contraction of the areas currently dominated by spring and
summer peak flows (red points). For the 2071-2100 period, only the most inland
catchments in southern Norway, two inland catchments in Nordland, and most of the
catchments in the Troms/Finnmark region continue to be associated with predominantly
spring and early summer peak flows. Both sets of scenarios for the two future periods,
exhibit similar spatial patterns during the reference period and an increased number of
catchments dominated by autumn and winter peaks flows in the future period.
The season in which the maximum flow for the entire 30-year period occurs has also been
compared between the 1961-1990 reference period and the 2071-2100 future period
(Figure 5.5). (The seasons presented are based on the following months: Spring – March,
April and May; Summer – June, June and August; Autumn – September, October and
November; Winter – December, January and February.) The comparison illustrates the
increase in the number of catchments associated with spring (green) as opposed to
summer (yellow) floods in the future. There are also several smaller catchments, for
example in south-eastern Norway, which exhibit a change in seasonality from spring
(green) to autumn (orange), also suggesting a change in the role of snowmelt vs. rainfall
in flood generation.
Figure 5.5 Season in which the maximum simulated discharge occurred for the 30-year
period indicated.
205.3 200-year flood
The results presented in the previous sections are based on the annual maximum flood
series from the simulated data for each catchment. The quantities presented are estimated
directly from the series, i.e. without the use of extreme value analysis. For planning
purposes, however, floods with long return periods are often considered, and a flood
frequency analysis based on the fitting of an extreme value function is used, as described
in Section 3.3. The resulting projections for the percentage change in the 200-year flood
between the 1961-1990 reference period and the two future periods are shown in Figure
5.6 and Figure 5.7, based on fitted two-parameter Gumbel functions for the annual
maximum series for each simulation. The values illustrated in the figures represent the
median of all of the percentage changes calculated from the ensemble of simulations for
each catchment.
Figure 5.6 Projected percentage changes in the 200-year flood between the 1961-1990
reference period and the 2021-2050 future period, based on the median of the ensemble
of hydrological projections. Green indicates a reduced flood magnitude and blue indicates
an increase in flood magnitude.
The general pattern of projected change is similar to that for the mean annual flood in that
increases in the magnitude of the 200-year flood are seen in western and coastal regions
of Norway whilst decreases dominant inland and the northernmost areas. The patterns
21illustrated for the two future time periods are also similar, although the changes are more
pronounced towards the end of the century. In addition, several catchments in the inland
area of southern Norway exhibit small to moderate increases in the magnitude of the 200-
year flood in the 2071-2100 period. These results point towards a significant increase in
flood magnitudes in western Norway, in the county of Nordland, and in coastal areas of
southern and south-eastern Norway and Troms. The largest projected increases are found
in western Norway and in Nordland.
Figure 5.7 Projected percentage changes in the 200-year flood between the 1961-1990
reference period and the 2071-2100 future period, based on the median of the ensemble
of hydrological projections. Green indicates a reduced flood magnitude and blue indicates
an increase in flood magnitude.
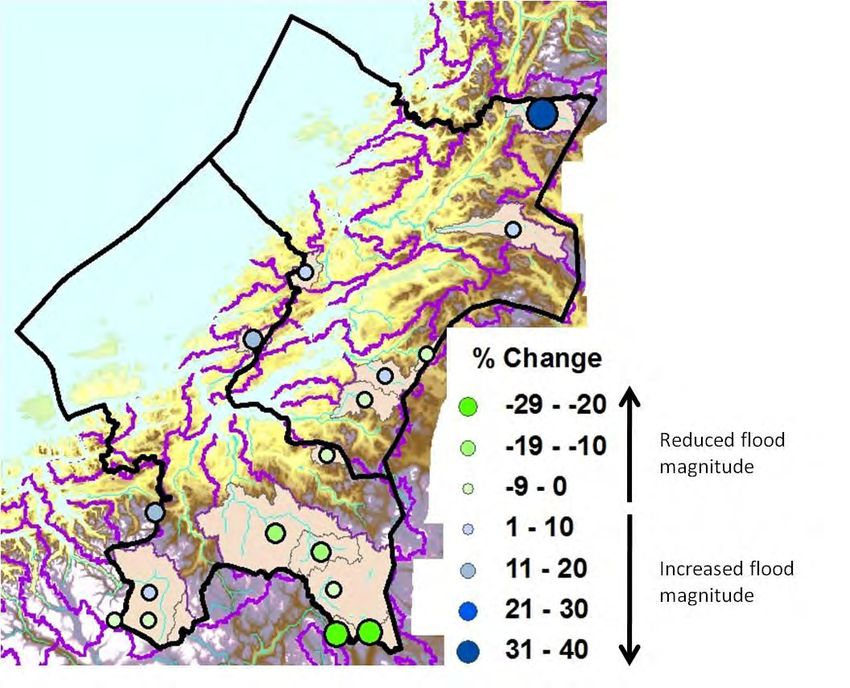
5.4 1000-year flood
Projections for changes in the 1000-year flood have also been estimated due to their
relevance in dam safety analyses. These are illustrated for the 2071-2100 future period in
Figure 5.8. The spatial pattern of change and the projected magnitudes of the percentage
change are very similar to those obtained for the 200-year flood (Figure 5.7). The
similarity between the projections for the 200-year and the 1000-year flood is anticipated
because the two-parameter Gumbel distribution used here produces flood frequency
22curves for the reference and future periods which often lie roughly parallel to each other
for long return periods (i.e. Figure 3.4). Similar results would also be expected for the
500-year flood, which is also used in dam safety analyses.
Figure 5.8 Projected percentage changes in the 1000-year flood between the 1961-1990
reference period and the 2071-2100 future period, based on the median of the ensemble
of hydrological projections. Green indicates a reduced flood magnitude and blue indicates
an increase in flood magnitude.
5.5 Regional patterns of projected change
The projected changes in the mean annual flood, the 200-year flood and the 1000-year
flood all exhibit similar spatial patterns in which moderate (15 – 30%) to large increases
(> 30%) in the magnitude of the maximum daily averaged discharge are expected in
western and south-western Norway, in south-eastern Norway in catchments located near
the coast, and in Nordland. Projected increases for the 200-year flood exceed 40% for
some of the catchments in western Norway and in Nordland. On the other hand, large
decreases are projected for inland regions such as Hedmark and in Finnmark. The
regions between the zones of large increases vs. large decreases generally have
23transitional values of projected change (i.e. small increases or decreases of < 15%).
Catchments with source areas in the mountainous regions of southern Norway (east of the
north-south water divide), and in the Trøndelag, and Troms regions tend towards small to
moderate changes, although there are local exceptions.
6 Variability in ensemble
projections
By using ensemble modelling, one can also consider the range and distribution of all of
the results for a catchment, thus giving an indication as to the variability amongst the
projections represented by the ensemble. The figures illustrating projected changes shown
in the previous section are based on the median of all of the estimated changes for the
catchment. The median value is the value for which at least 50% of the projections are
equal to or greater than the value given, and is used here as the most representative value
for the ensemble of simulations for each catchment. It is, however, also informative to
consider other quantiles from the ensemble of simulations, as they represent more
extreme cases and also highlight the level of agreement between simulations as to the
direction and magnitude of projected changes.
6.1 10th to 90th percentile range in projections
The 10th percentile of the ensemble of results for the percentage change in the 200-year
flood between the 1961-1990 reference period and the 2071-2100 future period is
illustrated in Figure 6.1. The 10th percentile is the value for which 90% of all of the
projected changes are larger than the value illustrated. For catchments with negative
values (i.e. projected decreases at the 10th percentile), this means that 90% of the
simulations indicate a smaller decrease or a possible increase in the percentage change.
For catchments with positive values (i.e. projected increases at the 10th percentile), 90%
of the simulations indicate larger increases than the value illustrated. With respect to
climate change impacts on flood hazard, Figure 6.1 illustrates an „optimistic‟, but
nevertheless, a possible scenario. Most of the catchments in this case are associated with
a decreased flood magnitude. However, there are still catchments, most notably in
western and south-western Norway and in Nordland that exhibit small to moderate
increases in flood magnitude. Many catchments in other regions are associated with
small decreases at the 10th percentile, and the most inland catchments are projected to
have very large decreases.
24Figure 6.1 Percentage change in the 200-year flood between 1961-1990 and 2071-2100
given by the 10th percentile of the ensemble for each catchment. Green indicates a
reduced flood magnitude and blue indicates an increase in flood magnitude.
The 90th percentile of the ensemble of results for the percentage change in the 200-year
flood between the 1961-1990 reference period and the 2071-2100 future period is
illustrated in Figure 6.2. The 90th percentile is the value for which 10% of all of the
projected changes are larger than the value illustrated. In contrast with Figure 6.1, this
figure illustrates a more „pessimistic‟, but nevertheless a possible scenario, in which
nearly all areas of Norway are associated with at least small increases in the magnitude of
the 200-year flood, excepting some inland catchments in southern and mid-Norway,
where small decreases are projected at the 90th percentile, and Finnmark, where moderate
decreases are expected based on this percentile.
Taken together, Figure 6.1 and Figure 6.2 indicate that projections for a significant
increase in flood magnitude in western Norway and in some catchments in Nordland, and
a decrease or no change in flood magnitude for Finnmark and parts of mid- and southern
Norway are quite robust, based on the ensemble of simulations used here. In each of
these cases, over 90% of all of the simulations give consistent results as to the direction
(increase vs. decrease) of the projected change. In addition, there is good agreement
between simulations for other catchments, where the overall magnitude of projected
change is not as large as in western Norway and in Finnmark.
25Figure 6.2 Percentage change in 200-year flood between 1961-1990 and 2071-2100 as
given by the 90th percentile of the ensemble for each catchment. Green indicates a
reduced flood magnitude and blue indicates an increase in flood magnitude.
The spread of the results around the median value for the projections given in Section 5 is
illustrated in Figure 6.3. The spread in the projections is here calculated as the difference
between the 10th and 90th percentiles of the ensemble (i.e. the values illustrated for each
catchment in Figures 6.1 and 6.2). This represents one method for assessing the
magnitude of the disparity or incongruity around the projection based on the median
value. Figure 6.3 illustrates that over half of the catchments have projected increases
which are associated with relatively low to moderate levels of incongruity (i.e.
dissimilarity) in that the difference between the 10th and 90th percentiles of the ensemble
is less than or equal to 33 percentage points (i.e. the green points). Other catchments have
wider ranges of projections based on this analysis, and there is no strong regional pattern
underlying the extent to which simulations are in agreement for individual catchments.
26Figure 6.3 Difference between the 10th and 90th percentile of the ensemble of
projections for each catchment.
6.2 Factors contributing to differences between
projections
The differences amongst the projections for each catchment illustrated in Figure 6.3 are a
consequence of five factors represented in the model ensemble: 1) differences between
climate models (both global and regional) and methods for linking global and regional
models in regional simulations; b) differences between SRES emission scenarios for the
21st century; c) differences between the delta change and empirical adjustment methods
for locally adjusting precipitation and temperature data from regional climate scenarios;
4) uncertainty associated with the calibration of the hydrological model for the
catchment; and 5) uncertainty arising from the application of flood frequency analysis
methods. Previous work by Lawrence and Haddeland (2011) has considered the relative
contributions of the first four of these factors to the total uncertainty in hydrological
projections for four catchments in Norway. The results demonstrated that all of these
factors can contribute significantly to the spread of projections for future changes in the
mean annual flood, and that the importance of the individual factors varies between
catchments. Other work (Lawrence and Engen-Skaugen, 2010) based on six scenarios for
the period 2021-2050 has considered the relative contribution of different climate models,
methods for locally adjusting precipitation and temperature data, and hydrological model
parameters to total uncertainty in the projections for the 115 catchments considered in this
report. The factor making the largest contribution to the spread of results is illustrated for
each catchment in Figure 6.4 and, again, demonstrates that all three factors can be
significant. There are also some weak regional patterns, in that differences between
climate models tend to be most important in most catchments in northern Norway, and in
27You can also read