BENEFITS TO WESTERN AUSTRALIAN MOTORISTS FROM TAXES, FEES AND CHARGES - RAC
←
→
Page content transcription
If your browser does not render page correctly, please read the page content below

REPORT TO
RAC WA
MARCH 2020

BENEFITS TO
WESTERN
AUSTRALIAN
MOTORISTS FROM
TAXES, FEES AND
CHARGES
ACIL ALLEN CONSULTING PTY LTD
                                                                                                  ABN 68 102 652 148

                                                                                                  LEVEL NINE
                                                                                                  60 COLLINS STREET
                                                                                                  MELBOURNE VIC 3000
                                                                                                  AUSTRALIA
                                                                                                  T+61 3 8650 6000
                                                                                                  F+61 3 9654 6363

                                                                                                  LEVEL ONE
                                                                                                  50 PITT STREET
                                                                                                  SYDNEY NSW 2000
                                                                                                  AUSTRALIA
                                                                                                  T+61 2 8272 5100
                                                                                                  F+61 2 9247 2455

                                                                                                  LEVEL FIFTEEN
                                                                                                  127 CREEK STREET
                                                                                                  BRISBANE QLD 4000
                                                                                                  AUSTRALIA
                                                                                                  T+61 7 3009 8700
                                                                                                  F+61 7 3009 8799

                                                                                                  LEVEL SIX
                                                                                                  54 MARCUS CLARKE STREET
                                                                                                  CANBERRA ACT 2601
                                                                                                  AUSTRALIA
                                                                                                  T+61 2 6103 8200
                                                                                                  F+61 2 6103 8233

                                                                                                  LEVEL TWELVE, BGC CENTRE
                                                                                                  28 THE ESPLANADE
                                                                                                  PERTH WA 6000
                                                                                                  AUSTRALIA
                                                                                                  T+61 8 9449 9600
                                                                                                  F+61 8 9322 3955

                                                                                                  167 FLINDERS STREET
                                                                                                  ADELAIDE SA 5000
                                                                                                  AUSTRALIA
                                                                                                  T +61 8 8122 4965

                                                                                                  ACILALLEN.COM.AU

REPORT AUTHORS
JOHN NICOLAOU, EXECUTIVE DIRECTOR           MARSHALL ROBERTS, ANALYST
E: J.NICOLAOU@ACILALLEN.COM.AU              E: M.ROBERTS@ACILALLEN.COM.AU
D: (08) 9449 9616                           D: (08) 9449 9620

RELIANCE AND DISCLAIMER THE PROFESSIONAL ANALYSIS AND ADVICE IN THIS REPORT HAS BEEN PREPARED BY ACIL ALLEN CONSULTING FOR
THE EXCLUSIVE USE OF THE PARTY OR PARTIES TO WHOM IT IS ADDRESSED (THE ADDRESSEE) AND FOR THE PURPOSES SPECIFIED IN IT. THIS
REPORT IS SUPPLIED IN GOOD FAITH AND REFLECTS THE KNOWLEDGE, EXPERTISE AND EXPERIENCE OF THE CONSULTANTS INVOLVED. THE
REPORT MUST NOT BE PUBLISHED, QUOTED OR DISSEMINATED TO ANY OTHER PARTY WITHOUT ACIL ALLEN CONSULTING’S PRIOR WRITTEN
CONSENT. ACIL ALLEN CONSULTING ACCEPTS NO RESPONSIBILITY WHATSOEVER FOR ANY LOSS OCCASIONED BY ANY PERSON ACTING OR
REFRAINING FROM ACTION AS A RESULT OF RELIANCE ON THE REPORT, OTHER THAN THE ADDRESSEE.

IN CONDUCTING THE ANALYSIS IN THIS REPORT ACIL ALLEN CONSULTING HAS ENDEAVOURED TO USE WHAT IT CONSIDERS IS THE BEST
INFORMATION AVAILABLE AT THE DATE OF PUBLICATION, INCLUDING INFORMATION SUPPLIED BY THE ADDRESSEE. ACIL ALLEN CONSULTING HAS
RELIED UPON THE INFORMATION PROVIDED BY THE ADDRESSEE AND HAS NOT SOUGHT TO VERIFY THE ACCURACY OF THE INFORMATION
SUPPLIED. UNLESS STATED OTHERWISE, ACIL ALLEN CONSULTING DOES NOT WARRANT THE ACCURACY OF ANY FORECAST OR PROJECTION IN
THE REPORT. ALTHOUGH ACIL ALLEN CONSULTING EXERCISES REASONABLE CARE WHEN MAKING FORECASTS OR PROJECTIONS, FACTORS IN
THE PROCESS, SUCH AS FUTURE MARKET BEHAVIOUR, ARE INHERENTLY UNCERTAIN AND CANNOT BE FORECAST OR PROJECTED RELIABLY.

ACIL ALLEN CONSULTING SHALL NOT BE LIABLE IN RESPECT OF ANY CLAIM ARISING OUT OF THE FAILURE OF A CLIENT INVESTMENT TO PERFORM
TO THE ADVANTAGE OF THE CLIENT OR TO THE ADVANTAGE OF THE CLIENT TO THE DEGREE SUGGESTED OR ASSUMED IN ANY ADVICE OR
FORECAST GIVEN BY ACIL ALLEN CONSULTING.

© ACIL ALLEN CONSULTING 2019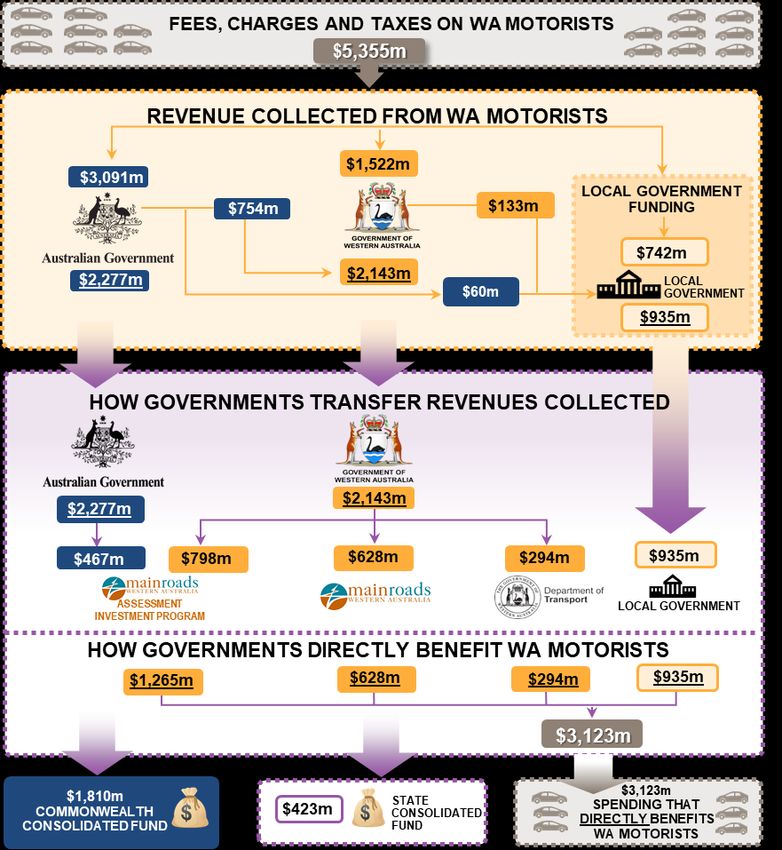
C            O             N            T            E             N   T   S

      1
      INTRODUCTION                                                                     8
1.1   About This Report                                                                8
1.2   Report Structure                                                                 9
1.3   List of Acronyms                                                                 9

      2
      GOVERNMENT REVENUE                                                              10
2.1   Commonwealth Government Revenue                                                 11
2.2   State Government Revenue                                                        12
2.3   Local Government Funding for Road Expenditure                                   12
2.4   Total Revenue                                                                   13

      3
      PROVISION OF MOTORING RELATED INFRASTRUCTURE AND SERVICES                       15
3.1   Commonwealth Spending                                                           15
3.2   State Government Spending                                                       16
3.3   Local Government Spending                                                       17
3.4   Total Spending                                                                  18

      4
      REVENUE AND DIRECT SPENDING COMPARISONS                                         20
4.1   Total Revenue and Direct Spending                                               20
4.2   Flows of Total Revenue and Total Direct Spending                                21
4.3   Direct Returns to Western Australian Motorists                                  22

      5
      ACTIVE AND PUBLIC TRANSPORT                                                     25
5.1   Revenue Raised from WA Motorists                                                25
5.2   Indirect Spending on Active and Public Transport by WA Motorists                25
5.3   Retained Revenue and Indirect Benefits Comparison                               27
5.4   Total Spend on Public Transport                                                 29

      6
      REVENUE AND DIRECT AND INDIRECT BENEFITS COMPARISON                             31
6.1   Total Revenue and Spending                                                      31
6.2   Flows of Total Revenue and Total Benefits                                       32

      A
      PROVISION OF ROAD NETWORK SPENDING                                             A–1
A.1   Main Roads WA                                                                  A–1
A.2   Department of Transport                                                        A–5
A.3   Local Governments                                                              A–6
A.4   Other Government Priorities, Public Transport Authority                        A–6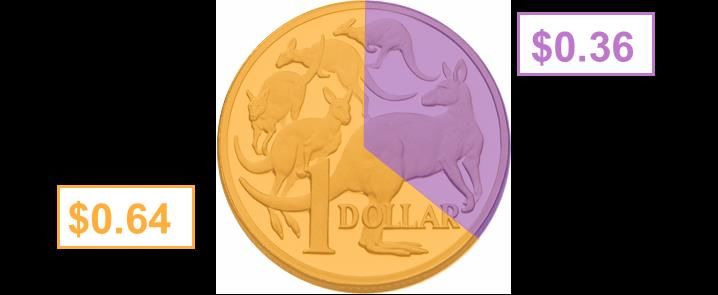
C            O          N           T          E          N           T          S

B
 DATA TABLES                                                                                 B–1

C
 METHODOLOGY                                                                                 C–1

FIGURES
FIGURE ES 1   FLOW OF TOTAL REVENUE GENERATED FROM WA MOTORISTS AND TOTAL RELATED DIRECT
               ROAD NETWORK SPENDING ON WA MOTORISTS, 2019-20, $ MILLION                          II
FIGURE ES 2   DIRECT ROAD NETWORK SPENDING ON WA MOTORISTS PER DOLLAR OF REVENUE
               GENERATED FROM WA MOTORISTS, 2019-20                                               III
FIGURE ES 3   DIRECT ROAD NETWORK DIRECT SPENDING ON WA MOTORISTS PER DOLLAR OF REVENUE
               GENERATED FROM WA MOTORISTS, HISTORIC AND FORECAST                                IV
FIGURE ES 4   FLOW OF REVENUES GENERATED FROM WA MOTORISTS AND TOTAL DIRECT AND INDIRECT
               BENEFITS FOR WA MOTORISTS, 2019-20, $ MILLION                                      V
FIGURE ES 5   DIRECT AND INDIRECT BENEFITS FOR WA MOTORISTS, PER DOLLAR OF REVENUE GENERATED
               FROM WA MOTORISTS, 2019-20                                                        VI
FIGURE ES 6   DIRECT AND INDIRECT BENEFITS FOR WA MOTORISTS PER DOLLAR OF REVENUE GENERATED
               FROM WA MOTORISTS, HISTORIC AND FORECAST                                          VII
FIGURE 2.1     COMMONWEALTH VEHICLE RELATED REVENUE GENERATED FROM WA MOTORISTS,
               HISTORIC AND PROJECTED, $ BILLION                                                 11
FIGURE 2.2     STATE VEHICLE RELATED REVENUE GENERATED FROM WA MOTORISTS, HISTORIC AND
               PROJECTED, $ BILLION                                                              12
FIGURE 2.3     LOCAL GOVERNMENT FUNDING FOR ROAD EXPENDITURE, HISTORIC AND PROJECTED, $
               BILLION                                                                           13
FIGURE 2.4     TOTAL VEHICLE RELATED REVENUE GENERATED FROM WA MOTORISTS, HISTORIC AND
               PROJECTED, $ BILLION                                                              14
FIGURE 3.1     COMMONWEALTH GOVERNMENT TRANSFERS TO THE STATE, HISTORIC AND PROJECTED,
               $ BILLION                                                                         15
FIGURE 3.2     WA GOVERNMENT ROAD NETWORK SPENDING, HISTORIC AND PROJECTED, $ BILLION            16
FIGURE 3.3     LOCAL GOVERNMENT ROAD NETWORK SPENDING, HISTORIC AND PROJECTED, $ BILLION         18
FIGURE 3.4     TOTAL ROAD NETWORK SPENDING, HISTORIC AND PROJECTED, $ BILLION                    19
FIGURE 4.1     TOTAL VEHICLE RELATED REVENUE GENERATED FROM WA MOTORISTS AND RELATED DIRECT
               ROAD NETWORK SPENDING ON WA MOTORISTS, HISTORIC AND PROJECTED, $ BILLION          20
FIGURE 4.2     FLOW OF TOTAL REVENUE GENERATED FROM WA MOTORISTS AND TOTAL RELATED DIRECT
               ROAD NETWORK SPENDING ON WA MOTORISTS, 2019-20, $ MILLION                         22
FIGURE 4.3     DIRECT ROAD NETWORK SPENDING ON WA MOTORISTS PER DOLLAR OF REVENUE
               GENERATED FROM WA MOTORISTS, 2019-20                                              23
FIGURE 4.4     DIRECT ROAD NETWORK SPENDING ON WA MOTORISTS PER DOLLAR OF REVENUE
               GENERATED FROM WA MOTORISTS, HISTORIC AND FORECAST                                24
FIGURE 5.1     TRANSFERS FROM GOVERNMENT FOR THE PROVISION OF ACTIVE AND PUBLIC TRANSPORT
               INFRASTRUCTURE AND SERVICES FROM REVENUE RAISED FROM WA MOTORISTS, HISTORIC
               AND FORECAST                                                                      27
FIGURE 5.2     FLOW OF RETAINED REVENUE BY GOVERNMENT FROM REVENUE THAT IS GENERATED FROM
               WA MOTORISTS AND HOW IT INDIRECTLY BENEFITS WA MOTORISTS, 2019-20, $ MILLION      28
FIGURE 5.3     ACTIVE AND PUBLIC TRANSPORT SPENDING THAT INDIRECTLY BENEFITS WA MOTORISTS, PER
               DOLLAR OF REVENUE RETAINED BY GOVERNMENT, 2019-20                                 29
FIGURE 5.4     TOTAL SPENDING ON PUBLIC TRANSPORT AND TOTAL CONTRIBUTION TO THE PUBLIC
               TRANSPORT AUTHORITY (PTA) $BILLION                                                30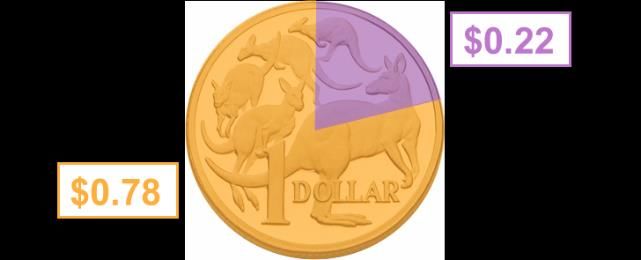
C           O         N           T          E          N           T          S
FIGURE 6.1   TOTAL VEHICLE RELATED REVENUE GENERATED FROM WA MOTORISTS AND RELATED DIRECT
             AND INDIRECT SPENDING ON WA MOTORISTS, HISTORIC AND PROJECTED, $ BILLION        32
FIGURE 6.2   FLOW OF REVENUES GENERATED FROM WA MOTORISTS AND TOTAL DIRECT AND INDIRECT
             BENEFITS FOR WA MOTORISTS, 2019-20, $ MILLION                                   34
FIGURE 6.3   DIRECT AND INDIRECT BENEFITS FOR WA MOTORISTS, PER DOLLAR OF REVENUE GENERATED
             FROM WA MOTORISTS, 2019-20                                                      35
FIGURE 6.4   DIRECT AND INDIRECT BENEFITS FOR WA MOTORISTS PER DOLLAR OF REVENUE GENERATED
             FROM WA MOTORISTS, HISTORIC AND FORECAST                                        36
FIGURE A.1   SPENDING BY MAIN ROADS WA, $
             BILLION                                                                        A–1
FIGURE A.2   MAIN ROADS SERVICES                                                            A–2
FIGURE A.1   ROAD NETWORK MAINTENANCE                                                       A–4

TABLES
TABLE C.1    ADJUSTED CPI WEIGHTS                                                          C–1
TABLE C.2    WA GST CONTRIBUTION PROXIES                                                   C–2
EXECUTIVE
        SUMMARY

    Each year, ACIL Allen Consulting (ACIL Allen) is commissioned to prepare a report for the RAC WA
    detailing the taxes, fees and charges paid by Western Australian (WA) motorists compared to the
    spending by all levels of government on roads and activities that benefits WA motorists.
    In developing this report, ACIL Allen has traced the flow of revenue generated from WA motorists by
    the Commonwealth, State and Local governments, and how these revenue flows are returned as
    direct and indirect benefits to WA motorists in the absence of any hypothecation of motorist taxes,
    fees and charges.
    For the purpose of this report, ACIL Allen has defined direct benefits as the amount of spending
    directly on the provision of motoring related infrastructure and services that directly benefit WA
    motorists. For example, the amount of spending by:
—   Main Roads Asset Investment Program;
—   Main Roads;
—   Department of Transport; and
—   Local Governments.
    Indirect benefits have been defined as the amount of spending on the provision of “active”1 and public
    transport related infrastructure and services that indirectly benefit WA motorists, by providing
    alternative modes of transport and helping to manage congestion on WA’s road network. For example:
—   transfers from the Commonwealth to the WA Government for specific purposes; and
—   transfers from the Commonwealth to WA’s Public Transport Authority’s Asset Investment Program.
    For the purposes of this report, it is assumed that every dollar retained in the Commonwealth and
    State Consolidated Funds represent indirect benefits to the extent that government funding priorities –
    in this case active and public transport infrastructure and services2 – indirectly benefit WA motorists. In
    estimating the indirect benefits to WA motorists from public transport-related infrastructure, ACIL Allen
    has not quantified the scale of the impact on congestion on WA’s road network, which is outside the
    scope of this study.

    Direct Benefits to WA Motorists
    In 2019-20, it is estimated that the Commonwealth will collect $3,091 million from WA motorists, of
    which $754 million is estimated will be transferred to the State Government and a further $60 million to

    1 Active transport infrastructure is classified as bikeways and footpaths that are part of road and rail infrastructure projects.
    2 Total spending on active and public transport infrastructure and services in WA is not accounted for in this report. Rather, the retained
    revenue of the Commonwealth and State governments (after direct expenditure on WA motorists has been allocated) is the assumed
    contributions from WA motorists to the provision of active and public transport related infrastructure and services.

                                                                                                                                             i
                           BENEFITS TO WESTERN AUSTRALIAN MOTORISTS FROM TAXES, FEES AND CHARGES
Local Government and the Main Roads WA AIP ($467 million)3. The majority of the revenue collected
by the Commonwealth Government from WA motorists is estimated to be retained in its Consolidated
Fund ($1,810 million).
The State Government is estimated to directly collect a further $1,522 million in 2019-20, which after
top up payments from the Commonwealth Government ($754 million) will be transferred to State
Government departments ($2,143 million) and Local Government ($133 million). Figure ES 1 below
shows that in 2019-20, the State Government is estimated to raise more revenue than they spend on
WA motorists, with $423 million returned to the State’s Consolidated Fund.
FIGURE ES 1 FLOW OF TOTAL REVENUE GENERATED FROM WA MOTORISTS AND TOTAL RELATED
DIRECT ROAD NETWORK SPENDING ON WA MOTORISTS, 2019-20, $ MILLION
Note: Figures may be subject to rounding.
SOURCE: ACIL ALLEN CONSULTING, CONSECUTIVE COMMONWEALTH BUDGET PAPERS, MID-YEAR ECONOMIC AND FISCAL OUTLOOK 2019-20,
CONSECUTIVE STATE BUDGET PAPERS, CONSECUTIVE WALGA REPORTS ON LOCAL GOVERNMENT ROAD ASSETS AND EXPENDITURE, DEPARTMENT
OF ENVIRONMENT AND ENERGY, ATO, ABS CAT. 6471.0, ABS CAT. 9314.0, ABS CAT. 3101.0, FEDERAL CHAMBER OF AUTOMOTIVE INDUSTRIES
3Over $1,000 million of transfers from the Commonwealth to the State are tied to the Tonkin Highway and Bunbury Outer Ring Road
projects.
ii
BENEFITS TO WESTERN AUSTRALIAN MOTORISTS FROM TAXES, FEES AND CHARGESLocal Government is estimated to spend $935 million on roads on 2019-20, which is principally funded
from local government fees and charges ($742 million) with the remainder coming from the
Commonwealth ($60 million) and the State ($133 million) governments.
Overall, ACIL Allen estimates that WA motorists will receive $3,123 million in direct benefits from all
levels of government in 2019-20, which represents 58 per cent of the estimated total revenue
collected by all levels of government from taxes, fees and charges levied on WA motorists in that year
($5,355 million).
By estimating the flow of funds by each level of government, ACIL Allen is able to estimate the value
of spend that directly benefits WA motorists per dollar collected from WA motorists.
Overall, for every dollar in Commonwealth, State and Local Government taxes, fees and charges paid
by WA motorists in 2019-20, $0.58 is estimated to be returned directly to benefit WA motorists in the
form of motoring related infrastructure and services (refer to Figure ES 2).
For every dollar collected by the Commonwealth Government (total collections of $3,091 million), it is
estimated that $0.41 will be returned to directly benefit WA motorists through the transfers to the State
Government, Local Governments or to the Main Roads AIP (total transfers of $1,281 million) in
2019-20.
FIGURE ES 2 DIRECT ROAD NETWORK SPENDING ON WA MOTORISTS PER DOLLAR OF REVENUE
GENERATED FROM WA MOTORISTS, 2019-20
TOTAL SPENDING THAT DIRECTLY BENEFITS WA COMMONWEALTH SPENDING THAT DIRECTLY
MOTORISTS BENEFITS WA MOTORISTS
$0.08 $0.41
Revenue retained Commonwealth
by the State spending that
directly benefits
$0.58 WA motorists
$0.34 Total spending that $0.59
directly benefits
Revenue WA motorists Revenue
retained by the retained by the
Commonwealth Commonwealth
Note: Figures may be subject to rounding.
SOURCE: ACIL ALLEN CONSULTING, CONSECUTIVE COMMONWEALTH BUDGET PAPERS, MID-YEAR ECONOMIC AND FISCAL OUTLOOK 2019-20,
CONSECUTIVE STATE BUDGET PAPERS, CONSECUTIVE WALGA REPORTS ON LOCAL GOVERNMENT ROAD ASSETS AND EXPENDITURE, DEPARTMENT
OF ENVIRONMENT AND ENERGY, ATO, ABS CAT. 6471.0, ABS CAT. 9314.0, ABS CAT. 3101.0, FEDERAL CHAMBER OF AUTOMOTIVE INDUSTRIES
Figure ES 3 shows that the total direct benefit to WA motorists per dollar collected from the taxes,
fees and charges it pays has averaged $0.61 since 2007-08, peaking at $0.68 in 2012-13. In 2019-20,
total direct benefits per dollar collected are estimated to be below this long term average, at $0.58.
Over the remainder of the estimates period, the total direct benefit to WA motorists per dollar collected
is estimated to average $0.48 per annum, falling to a low of $0.46 by 2021-22 and a peak of $0.51 in
2022-23. The expected decline over the estimates period to 2021-22 is due to a decrease in the
State’s allocation to the Main Roads AIP but is partially offset in 2022-23 by an increase in the
Commonwealth’s allocation to Main Road’s AIP.
The total direct benefits to WA motorists per dollar collected from the taxes levied by the
Commonwealth has averaged $0.33 per annum, peaking at $0.57 in 2014-15. In 2019-20, total direct
benefits per dollar collected are estimated to reach $0.41. Over the remainder of the estimates period,
the Commonwealth direct benefit to WA motorists per dollar collected is estimated to average
$0.46 per annum, a low of $0.42 in 2020-21 and a peak of $0.52 in 2022-23. This is due to a larger
allocation of Commonwealth funds to Main Roads’ AIP and an increase in Commonwealth transfers to
the State Government (ie Road investment component).
iii
BENEFITS TO WESTERN AUSTRALIAN MOTORISTS FROM TAXES, FEES AND CHARGESOn a per motorist basis, ACIL Allen estimates that in 2019-20 each of WA’s 1.9 million4 motorists paid
$2,750 to all levels of government in the form of taxes, fees and charges, with $1,604 directly returned
to each motorist in the form of road related infrastructure and services.
FIGURE ES 3 DIRECT ROAD NETWORK DIRECT SPENDING ON WA MOTORISTS PER DOLLAR OF
REVENUE GENERATED FROM WA MOTORISTS, HISTORIC AND FORECAST
$1.00 Estimates
Commonwealth direct benefits for WA motorists, per dollar raised
2020-21 to 2022-23 Commonwealth Average
Total direct benefits for WA motorists, per dollar raised
$0.80
2020-21 to 2022-23 Total Average
$0.60
$0.40
$0.20
$0.00
2007-08 2010-11 2013-14 2016-17 2019-20 2022-23
Note: Figures may be subject to rounding.
SOURCE: ACIL ALLEN CONSULTING, CONSECUTIVE COMMONWEALTH BUDGET PAPERS, MID-YEAR ECONOMIC AND FISCAL OUTLOOK 2019-20,
CONSECUTIVE STATE BUDGET PAPERS, CONSECUTIVE WALGA REPORTS ON LOCAL GOVERNMENT ROAD ASSETS AND EXPENDITURE, DEPARTMENT
OF ENVIRONMENT AND ENERGY, ATO, ABS CAT. 6471.0, ABS CAT. 9314.0, ABS CAT. 3101.0, FEDERAL CHAMBER OF AUTOMOTIVE INDUSTRIES
Indirect Benefits to WA Motorists
The direct flow of funds diagram above (Figure ES 1) shows how each level of government raises
revenue from WA motorists and how it flows back to directly benefit WA motorists through the
provision of motoring related infrastructure and services.
Figure ES 4 below also shows how the Commonwealth and State government’s retained revenue
from WA motorists also indirectly benefits WA motorists through the provision of active and public
transport infrastructure and related services, which help to manage congestion on WA’s road network
through the provision of alternative modes of transport.
Figure ES 4 shows that of the total revenue collected by WA motorists that is retained by the
Commonwealth in its Consolidated Fund in 2019-20, ($1,810 million), this helps to fund further
transfers from the Commonwealth to the State Government for active and public transport projects
($65 million) and to the PTA’s AIP ($327 million), with the remaining $1,419 million to be retained in
the Consolidated Fund.
4 Excludes learners permits. As at 31 December 2018.
iv
BENEFITS TO WESTERN AUSTRALIAN MOTORISTS FROM TAXES, FEES AND CHARGESFIGURE ES 4 FLOW OF REVENUES GENERATED FROM WA MOTORISTS AND TOTAL DIRECT AND
INDIRECT BENEFITS FOR WA MOTORISTS, 2019-20, $ MILLION
Note: Figures may be subject to rounding.
SOURCE: ACIL ALLEN CONSULTING, CONSECUTIVE COMMONWEALTH BUDGET PAPERS, MID-YEAR ECONOMIC AND FISCAL OUTLOOK 2019-20,
CONSECUTIVE STATE BUDGET PAPERS, CONSECUTIVE WALGA REPORTS ON LOCAL GOVERNMENT ROAD ASSETS AND EXPENDITURE, DEPARTMENT
OF ENVIRONMENT AND ENERGY, ATO, ABS CAT. 6471.0, ABS CAT. 9314.0, ABS CAT. 3101.0, FEDERAL CHAMBER OF AUTOMOTIVE INDUSTRIES
v
BENEFITS TO WESTERN AUSTRALIAN MOTORISTS FROM TAXES, FEES AND CHARGESThe State Government is estimated to retain revenue of $423 million from WA motorists in 2019-20,
for other government priorities including the provision of active and public transport related
infrastructure and services5. For the purpose of this study, ACIL Allen has assumed this amount is a
$423 million is transferred to the PTA as part of the PTA’s total appropriation.
Based on this stylised flow of funds, ACIL Allen estimates that WA motorists supported the provision
of active and public transport related infrastructure and services to the value of $814 million in
2019-20, which supports the provision of alternative modes of transport and in turn helping to manage
congestion on WA’s road network. This represented 36 per cent of the total revenue retained from
taxes, fees and charges levied on WA motorists by the Commonwealth and State governments
($2,233 million) in 2019-20.
By following the direct and indirect flow of funds by each level of government, ACIL Allen is able to
estimate the value of direct and indirect benefits that WA motorists receive per dollar collected from
WA motorists. This is represented in Figure ES 5 below.
Overall, for every dollar in Commonwealth, State and Local Government taxes, fees and charges paid
by WA motorists in 2019-20, an estimated $0.58 is directly returned to WA motorists in the form of
motoring related infrastructure and services, and an estimated $0.15 is indirectly returned to WA
motorists in the form of active and public transport infrastructure and related services.
For every dollar in taxes paid by WA motorists to the Commonwealth Government in 2019-20, an
estimated $0.41 is directly returned to WA motorists in the form of motoring related infrastructure and
services, and an estimated $0.13 is indirectly returned to WA motorists in the form of active and public
transport infrastructure and related services.
FIGURE ES 5 DIRECT AND INDIRECT BENEFITS FOR WA MOTORISTS, PER DOLLAR OF REVENUE
GENERATED FROM WA MOTORISTS, 2019-20
TOTAL DIRECT AND INDIRECT BENEFITS TO WA MOTORISTS COMMONWEALTH DIRECT AND INDIRECT BENEFITS TO WA
MOTORISTS
$0.27
$0.46
Revenue retained by Revenue retained by
$0.41
the Commonwealth $0.58 the Commonwealth Commonwealth
Total spending spending that
that directly directly benefits
benefits WA WA motorists
motorists
$0.15
Commonwealth
Total spending that spending that indirectly
indirectly benefits WA
motorists
benefits WA motorists $0.13
Note: Figures may be subject to rounding.
SOURCE: ACIL ALLEN CONSULTING, CONSECUTIVE COMMONWEALTH BUDGET PAPERS, MID-YEAR ECONOMIC AND FISCAL OUTLOOK 2019-20,
CONSECUTIVE STATE BUDGET PAPERS, CONSECUTIVE WALGA REPORTS ON LOCAL GOVERNMENT ROAD ASSETS AND EXPENDITURE, DEPARTMENT
OF ENVIRONMENT AND ENERGY, ATO, ABS CAT. 6471.0, ABS CAT. 9314.0, ABS CAT. 3101.0, FEDERAL CHAMBER OF AUTOMOTIVE INDUSTRIES
Figure ES 6 below shows that the total direct and indirect benefits to WA motorists from the taxes,
fees and charges it pays has averaged $0.66 since 2007-08, peaking at $0.82 in 2017-18. Over the
estimates period, the total direct and indirect benefit to WA motorists is estimated to average
$0.76 per annum, falling to $0.73 in 2020-21 before peaking at $0.77 in 2021-22 and 2022-23.
The direct and indirect benefits to WA motorists from the taxes levied by the Commonwealth has
averaged $0.36 per annum since 2007-08, peaking at $0.68 in 2017-18. Over the estimates period,
the Commonwealth direct and indirect benefit is estimated to average $0.59 per annum, falling to a
low of $0.54 by 2020-21 and peaking at $0.73 in 2021-22. Total benefits to WA’s motorists are
estimated to decline over the estimates period due to a smaller allocation of funding from the
5 Total spending on active and public transport infrastructure and services in WA is not accounted for in the modelling. Rather, the retained
revenue of the Commonwealth and State governments (after direct expenditure on WA motorists has been allocated) is the assumed
contributions from WA motorists to the provision of active and public transport related infrastructure and services.
vi
BENEFITS TO WESTERN AUSTRALIAN MOTORISTS FROM TAXES, FEES AND CHARGESCommonwealth to Main Road’s AIP to 2020-21 before recovering in 2021-22 due to higher
Commonwealth transfers to State Government (ie Road investment component).
On a per motorist basis, ACIL Allen estimates that in 2019-20 each of WA’s 1.9 million6 motorists paid
$2,750 to all levels of government in the form of taxes, fees and charges, with $2,022 directly and
indirectly returned to each motorist in the form of road, active and public transport related
infrastructure and services.
FIGURE ES 6 DIRECT AND INDIRECT BENEFITS FOR WA MOTORISTS PER DOLLAR OF REVENUE
GENERATED FROM WA MOTORISTS, HISTORIC AND FORECAST
$1.00 Estimates
Commonwealth direct and indirect benefits for WA motorists, per dollar raised
2020-21 to 2022-23 Commonwealth Average
$0.90
Total direct and indirect benefits for WA motorists, per dollar raised
2020-21 to 2022-23 Total Average
$0.80
$0.70
$0.60
$0.50
$0.40
$0.30
$0.20
$0.10
$0.00
2007-08 2010-11 2013-14 2016-17 2019-20 2022-23
Note: Figures may be subject to rounding.
SOURCE: ACIL ALLEN CONSULTING, CONSECUTIVE COMMONWEALTH BUDGET PAPERS, MID-YEAR ECONOMIC AND FISCAL OUTLOOK 2019-20,
CONSECUTIVE STATE BUDGET PAPERS, CONSECUTIVE WALGA REPORTS ON LOCAL GOVERNMENT ROAD ASSETS AND EXPENDITURE, DEPARTMENT
OF ENVIRONMENT AND ENERGY, ATO, ABS CAT. 6471.0, ABS CAT. 9314.0, ABS CAT. 3101.0, FEDERAL CHAMBER OF AUTOMOTIVE INDUSTRIES
6 Excludes learners permits. As at 31 December 2018.
vii
BENEFITS TO WESTERN AUSTRALIAN MOTORISTS FROM TAXES, FEES AND CHARGES1 INTRODUCTION INTRODUCTION
1
Each year, ACIL Allen Consulting (ACIL Allen) is commissioned to prepare a report for the RAC WA
detailing the taxes, fees and charges paid by WA motorists compared to the spending by all levels of
government on roads and activities that directly benefits WA motorists.
The findings presented in this report assist the RAC WA in advocating for a fairer distribution of
funding from the revenue collected from WA motorists to enhance the safety and efficiency of WA's
road networks, and address the maintenance backlog.
1.1 About This Report
In developing this report, ACIL Allen has traced the flow of revenue generated from WA motorists by
the Commonwealth, State and Local governments, and how these revenue flows are returned as
direct and indirect benefits to WA motorists in the absence of any hypothecation of motorist taxes,
fees and charges.
For the purpose of this report, ACIL Allen has defined direct benefits as the amount of spending
directly on the provision of motoring related infrastructure and services that directly benefit WA
motorists. For example, the amount of spending by:
— Main Roads Asset Investment Program;
— Main Roads;
— Department of Transport; and
— Local Governments.
Indirect benefits have been defined as the amount of spending on the provision of active and public
transport related infrastructure and services that indirectly benefit WA motorists, by providing
alternative modes of transport and helping to manage congestion on WA’s road network. For example:
— transfers from the Commonwealth to the WA Government for specific purposes; and
— transfers from the Commonwealth to WA’s Public Transport Authority’s Asset Investment Program.
For the purposes of this report, it is assumed that every dollar retained in the Commonwealth and
State Consolidated Funds represent indirect benefits to the extent that government funding priorities –
in this case active and public transport infrastructure and services7 – indirectly benefit WA motorists. In
estimating the indirect benefits to WA motorists from transport-related infrastructure, ACIL Allen has
not quantified the scale of the impact on congestion on WA’s road network, which is outside the scope
of this study.
7 Total spending on active and public transport infrastructure and services in WA is not accounted for in the modelling. Rather, the retained
revenue of the Commonwealth and State governments (after direct expenditure on WA motorists has been allocated) is the assumed
contributions from WA motorists to the provision of active and public transport related infrastructure and services.
8
BENEFITS TO WESTERN AUSTRALIAN MOTORISTS FROM TAXES, FEES AND CHARGESEach of these benefits streams are detailed throughout this report, based on data collected from
Commonwealth and WA Budget papers, the Australian Bureau of Statistics (ABS), the Western
Australian Local Government Association (WALGA), the Australian Taxation Office (ATO), Innovation
and Science, Commonwealth Department of Environment and Energy and the Federal Chamber of
Automotive Industries.
1.2 Report Structure
This report is structured as follows:
— Section 2 contains estimates of revenue collected from WA motorists by the Commonwealth, State
and WA Local governments.
— Section 3 contains estimates of spending on road networks in WA by the Commonwealth, State and
Local governments.
— Section 4 contains key conclusions and identifies the relationship between revenue collected from
WA motorists and spending on WA’s road networks.
— Section 5 contains estimates of spending on active and public transport in WA by the Commonwealth
and State governments.
— Section 6 estimates the degree to which revenue collected from WA motorists supports spending on
WA’s active and public transport network.
— Appendix A contains further details on the provision of spending on WA’s transport infrastructure
including roads, active and public transport networks.
— Appendix B contains data table of the figures presented in this report.
— Appendix C contains further details on ACIL Allen methodology for estimates in this report.
1.3 List of Acronyms
Acronym Definition
ABS Australian Bureau of Statistics
ACIL Allen ACIL Allen Consulting
AIP Asset Investment Program
ATO Australian Taxation Office
CPI Consumer Price Index
Commonwealth (Government) Commonwealth Government of Australia
GST Goods and Services Tax
Local (Government) Western Australian Local Governments
MV Motor Vehicle
PTA Western Australian Public Transport Authority
RAC WA Royal Automobile Club of Western Australia
State (Government) State Government of Western Australia
WA Western Australia
WALGA Western Australian Local Government Association
9
BENEFITS TO WESTERN AUSTRALIAN MOTORISTS FROM TAXES, FEES AND CHARGES2 GOVERNMENT
REVENUE GOVERNMENT REVENU E
2
Motorists pay a range of taxes, fees and charges associated with their vehicle.
The Commonwealth Government collects motor vehicle related revenue primarily through the
following heads of revenue:
— GST: raised from motor vehicle related transactions such as the purchase of motor vehicles and fuel;
— luxury car tax: paid on the purchase of new cars for which the value exceeds the Government’s
luxury car threshold8;
— excise duty on petrol and diesel: taxes paid on the purchase of petrol and diesel; and
— passenger motor vehicle customs duty: paid on imported vehicles on entry into Australia.
The State Government collects motor vehicle related revenue through various fees and charges,
including:
— vehicle licence duties: collected when a vehicle is licenced or a vehicle licence is transferred;
— motor vehicle registrations: collected for the ongoing registration of motor vehicles;
— “other fees”: including licences and associated fees, taxes from oversized motor vehicles and motor
vehicle recording fees; and
— Perth Parking Levy: is paid by all owners of non-residential parking bays within the Perth Parking
Management Area (constituting the Perth CBD and sections of West Perth, East Perth and
Northbridge). It is designed to manage the level of private parking in the Perth CBD, with the revenue
generated from this levy reinvested into a range of transport initiatives, including the free Central Area
Transport (CAT) bus system, cycle paths and for funding a proportion of the Perth Busport.
The other State Government tax that is paid by WA motorists is Insurance Duty, but this has not been
included in this analysis as the revenue generated from motor vehicle insurance policies is not
separately collected by the State Government, or able to be identified separately from all other
dutiable insurance policies.
For local governments, they receive revenues in the form of grants from the Commonwealth and
State Governments, which is in turn supplemented by its own source revenues including council rates,
fees, charges for services, loan funds, and from Accumulated Reserves.
This section contains ACIL Allen’s estimates of the total motor vehicle related government revenue
generated from WA motorists.
8 Current thresholds are $75,526 for fuel efficient vehicles and $67,525 for other vehicles. See, https://www.ato.gov.au/Rates/Luxury-car-tax-
rate-and-thresholds/.
10
BENEFITS TO WESTERN AUSTRALIAN MOTORISTS FROM TAXES, FEES AND CHARGES2.1 Commonwealth Government Revenue
As the Commonwealth Government does not provide estimates of its taxes generated in each State or
Territory, ACIL Allen has developed estimates based on a set of core assumptions.
— Motorist related GST collections have been estimated based on the Consumer Price Index (CPI)
weightings for motor vehicle related items (produced by the ABS), with WA’s share of this revenue
then based on the weighted average share of WA’s population, fuel consumption and car sales.
— The share of luxury car tax collected by the Commonwealth from WA motorists has been estimated
based on the weighted average share of WA’s new car sales.
— The share of excise duty on petrol and diesel collected by the Commonwealth from WA motorists has
been estimated based on the weighted average share of petrol and diesel consumption in WA.
— The share of passenger motor vehicle customs duty collected by the Commonwealth from WA
motorists has been estimated based on the weighted average share of new car sales in WA.
The level of revenue collected by the Commonwealth from WA motorists is presented below in
Figure 2.1.
FIGURE 2.1 COMMONWEALTH VEHICLE RELATED REVENUE GENERATED FROM WA MOTORISTS,
HISTORIC AND PROJECTED, $ BILLION
$4.0b Estimates
Luxury car tax Passenger MV customs
Excise duty petrol Excise duty on diesel
$3.5b
Motorist related GST collections
$3.0b
$2.5b
$2.0b
$1.5b
$1.0b
$0.5b
$0.0b
2007-08 2010-11 2013-14 2016-17 2019-20 2022-23
Note: Figures may be subject to rounding.
SOURCE: ACIL ALLEN CONSULTING, CONSECUTIVE COMMONWEALTH BUDGET PAPERS, DEPARTMENT OF ENVIRONMENT AND ENERGY, ATO, ABS
CAT. 6471.0, ABS CAT. 9314.0, ABS CAT. 3101.0, FEDERAL CHAMBER OF AUTOMOTIVE INDUSTRIES
In 2019-20, ACIL Allen has estimated the Commonwealth will collect $3,091 million in revenue from
WA motorists, which represents an increase of 4.3 per cent from 2018-19 estimates. Excise duties on
diesel9 are estimated to make up the largest share of the Commonwealth’s total revenue collected
from WA motorists ($1,487 million or 48 per cent).
The derived level of GST collected in WA on motorist-related items is estimated to make up the next
largest component ($835 million), followed by excise duties on petrol ($692 million), taxes on luxury
cars ($41 million) and custom duties on passenger motor vehicles ($35 million).
9Note: excise duties on diesel are calculated as the net amount collected from WA motorists, the net amount includes ACIL Allen’s estimate
of the diesel excise rebate to WA motorists.
11
BENEFITS TO WESTERN AUSTRALIAN MOTORISTS FROM TAXES, FEES AND CHARGESOver the remainder of the estimates period, total Commonwealth Government revenue attributed to
WA motorists is estimated to grow by an average of 4.3 per cent per annum to $3,503 million by
2022-2310.
2.2 State Government Revenue
The level of revenue collected by the State Government across the major heads of revenue is
presented in Figure 2.2 below. The revenue estimates have been primarily sourced from consecutive
State Budget papers.
FIGURE 2.2 STATE VEHICLE RELATED REVENUE GENERATED FROM WA MOTORISTS, HISTORIC
AND PROJECTED, $ BILLION
$1.8b Estimates
Perth Parking Levy
Other State Government Revenue
$1.6b
Motor Vehicle Licence Duty
Motor Vehicle Registration Fee
$1.4b
$1.2b
$1.0b
$0.8b
$0.6b
$0.4b
$0.2b
$0.0b
2007-08 2010-11 2013-14 2016-17 2019-20 2022-23
Note: Figures may be subject to rounding.
Other: includes taxes from oversized motor vehicles and motor vehicle recording fees.
SOURCE: ACIL ALLEN CONSULTING, CONSECUTIVE STATE BUDGET PAPERS
ACIL Allen estimates the State will collect $1,522 million from WA motorists in 2019-20, which is an
increase of 2.6 per cent from the previous year. Motor vehicle registration fees are the largest
component of total motor vehicle related revenue raised by the State (67.5 per cent), with total fees
increasing by 3.6 per cent to $1,027 million in 2019-20.
Motor Vehicle Licence Duties are estimated will increase by 1.4 per cent in 2019-20 to $373 million,
with revenues generated from the Perth Parking Levy estimated to increase by 1.2 per cent to
$59 million.
Over the remainder of the estimates period, total revenue collected by the State Government from WA
motorists is estimated to increase on average by 5.1 per cent per annum to $1,765 million by 2022-23.
2.3 Local Government Funding for Road Expenditure
ACIL Allen has estimated that Local Government funding for road expenditure as the difference
between transfers from the WA Local Government Grants Commission and total Local Government
road network expenditure in any one year, to avoid double counting. These estimates are presented
below in Figure 2.3.
Sources of funding for Local Governments budgets include:
10 ACIL Allen estimates based on Commonwealth Budget papers.
12
BENEFITS TO WESTERN AUSTRALIAN MOTORISTS FROM TAXES, FEES AND CHARGES— local council rates;
— local council fees;
— loan funds;
— local government charges for services;
— internal transfers from Accumulated Reserves; and
— transfers from the WA Local Government Grants Commission (via the Commonwealth and State
governments).
FIGURE 2.3 LOCAL GOVERNMENT FUNDING FOR ROAD EXPENDITURE, HISTORIC AND
PROJECTED, $ BILLION
$0.8b Estimates
$0.7b
$0.6b
$0.5b
$0.4b
$0.3b
$0.2b
$0.1b
$0.0b
2007-08 2010-11 2013-14 2016-17 2019-20 2022-23
Note: Figures may be subject to rounding.
SOURCE: ACIL ALLEN CONSULTING, CONSECUTIVE WALGA REPORT ON LOCAL GOVERNMENT ROAD ASSETS AND EXPENDITURE, CONSECUTIVE
STATE BUDGET PAPERS, CONSECUTIVE COMMONWEALTH BUDGET PAPERS
ACIL Allen estimates that in 2019-20, Local Governments will allocate funding of $742 million for road
expenditure, a seven per cent increase from the previous year. Over the remainder of the estimates
period, Local Government allocations are projected to fall on average by just under one per cent per
annum to $694 million by 2022-23.
2.4 Total Revenue
Figure 2.4 below presents the total revenue collected by all levels of government from WA motorists.
In 2019-20, it is estimated that $5,355 million in total revenue will be collected from WA motorists, an
increase of 4.2 per cent from 2018-19. Over the remainder of the estimates period, total revenue is
estimated to grow on average by 3.6 per cent per annum to $5,962 million by 2022-23.
The Commonwealth consistently raises more revenue from WA motorists than both State and Local
governments. In 2019-20, it is estimated that Commonwealth taxes will account for 58 per cent of total
revenues collected from WA motorists, followed by the State Government (28 per cent) and Local
Government (14 per cent).
13
BENEFITS TO WESTERN AUSTRALIAN MOTORISTS FROM TAXES, FEES AND CHARGESFIGURE 2.4 TOTAL VEHICLE RELATED REVENUE GENERATED FROM WA MOTORISTS, HISTORIC
AND PROJECTED, $ BILLION
$6.0b
Commonwealth Government revenue Estimates
State Government revenue
Local Government funding
$5.0b
$4.0b
$3.0b
$2.0b
$1.0b
$0.0b
2007-08 2010-11 2013-14 2016-17 2019-20 2022-23
Note: Figures may be subject to rounding.
SOURCE: ACIL ALLEN CONSULTING, CONSECUTIVE COMMONWEALTH BUDGET PAPERS, CONSECUTIVE STATE BUDGET PAPERS, CONSECUTIVE
WALGA REPORTS ON LOCAL GOVERNMENT ROAD ASSETS AND EXPENDITURE, DEPARTMENT OF INDUSTRY, INNOVATION AND SCIENCE,
DEPARTMENT OF ENVIRONMENT AND ENERGY, ATO, ABS CAT. 6471.0, ABS CAT. 9314.0, ABS CAT. 3101.0, FEDERAL CHAMBER OF AUTOMOTIVE
INDUSTRIES
14
BENEFITS TO WESTERN AUSTRALIAN MOTORISTS FROM TAXES, FEES AND CHARGES3 PROVISION OF
MOTORING
RELATED
INFRASTRUCTURE
AND SERVICES PROVI SION OF MOT ORING REL ATED INFR ASTRUCTUR E AND SER VICES
3
While the largest share of revenue generated from WA motorists is collected by the Commonwealth, it
is the State and Local governments that are primarily responsible for the provision of motoring related
infrastructure and services that directly benefit WA motorists. The Commonwealth instead transfers
funding to the State and Local governments as either transfers for specific projects or as block grants
to the State Government’s Consolidated Fund.
3.1 Commonwealth Spending
Total transfers to WA are estimated to total $1,281 million in 2019-20 which is estimated to be some
five per cent less than 2018-19 (Figure 3.1).
FIGURE 3.1 COMMONWEALTH GOVERNMENT TRANSFERS TO THE STATE, HISTORIC AND
PROJECTED, $ BILLION
$2.0b Estimates
Transfer to Local Governments
$1.8b
Transfer to Main Roads AIP
$1.6b
Transfer to State Government
$1.4b
$1.2b
$1.0b
$0.8b
$0.6b
$0.4b
$0.2b
$0.0b
2007-08 2010-11 2013-14 2016-17 2019-20 2022-23
Note: Figures may be subject to rounding.
SOURCE: ACIL ALLEN CONSULTING, MID-YEAR ECONOMIC AND FISCAL OUTLOOK 2019-20, CONSECUTIVE COMMONWEALTH BUDGET PAPERS,
CONSECUTIVE STATE BUDGET PAPERS
15
BENEFITS TO WESTERN AUSTRALIAN MOTORISTS FROM TAXES, FEES AND CHARGESThis is driven by a nine per cent decrease (or $47 million) in Commonwealth Government transfers to
the Main Roads Asset Investment Program (AIP), and an estimated 49 per cent reduction (or
$58 million) in transfers to Local Government from the Commonwealth.
Commonwealth transfers to the State’s Consolidated Fund are estimated to increase by 4.9 per cent
to $754 million11 in 2019-20, while transfers to Local Government are estimated to decrease by
49 per cent to $60 million.
Over the remainder of the estimates period, total Commonwealth transfers are expected to trend
upwards to a peak of $1,828 million in 2022-23, which represents an average increase of
12.8 per cent per annum over the remainder of the estimates period. This is expected to be driven by
transfers to Main Roads AIP (up by an average of $84 million or 24 per cent per annum), the State
Government (up by an average of $73 million or nine per cent per annum) and the Local Government
(up by $25 million or 39 per cent per annum).
3.2 State Government Spending
The State Government is responsible for the largest share of the total expenditure for motoring related
infrastructure and services in WA. The largest share of this spending is directed to Main Roads,
making up an estimated 77 per cent of total expenditure in 2019-20 (see Figure 3.2 below). Further
details on the Main Roads expenditure areas is presented in Appendix A.
Total spending by the State is estimated to increase by 14 per cent to $1,853 million in 2019-20. After
reaching this peak, spending is estimated to decrease on average by 6.2 per cent per annum over the
estimates period to $1,494 million by 2022-23, as a result of the scaling down of the State’s AIP and
corresponding shift to spending on the Public Transport Authority’s (PTA) AIP.
FIGURE 3.2 WA GOVERNMENT ROAD NETWORK SPENDING, HISTORIC AND PROJECTED, $
BILLION
$2.4b
Transfer to Local Government Estimates
Department of Transport
Main Roads Services
$2.0b
Main Roads - Asset Investment Program
$1.6b
$1.2b
$0.8b
$0.4b
$0.0b
2007-08 2010-11 2013-14 2016-17 2019-20 2022-23
Note: Figures may be subject to rounding.
SOURCE: ACIL ALLEN CONSULTING, CONSECUTIVE COMMONWEALTH BUDGET PAPERS, CONSECUTIVE STATE BUDGET PAPERS
11Commonwealth Budget Paper 3, Part 2: Payments for specific purposes, National Partnership payments for infrastructure. This has been
updated to reflect the National Partnership payments for infrastructure as per the Mid-Year Economic and Fiscal Outlook 2019-20.
16
BENEFITS TO WESTERN AUSTRALIAN MOTORISTS FROM TAXES, FEES AND CHARGES3.2.1 Main Roads – Asset Investment Program
The State Government’s transfer to the Main Roads AIP in 2019-20 is estimated to total
$798 million12, representing an increase of 11.3 per cent from 2018-19. The funding increase is
expected to come from a combination of capital appropriations, agency borrowings, internal funds and
balances and Commonwealth transfers. Through the reminder of the estimates period to 2022-23, the
State Government is estimated to fund a smaller share of Main Roads’ AIP when compared to the
Commonwealth (see Figure 3.1 above).
3.2.2 Main Roads – Services
Transfers to the services arm of Main Roads is estimated to total $628 million11 in 2019-20,
representing an increase of 22 per cent from 2018-19. Transfers to Main Roads Services are
estimated to peak at $628 million in 2019-20, before returning to average $574 million for the reminder
of the estimates period. The peak in 2019-20 is driven by an 83 per cent increase ($112 million) in
spending on Main Roads’ Road Efficiency Improvements program and a 213 per cent ($68 million)
increase in the Infrastructure for community access program (see Appendix A.1.1 for further details).
3.2.3 Department of Transport
Transfers to the Department of Transport are estimated to total $294 million11 in 2019-20, representing
a decrease of 1.1 per cent from 2018-19. Over the remainder of the estimates period, transfers to the
Department of Transport are estimated to decrease on average by 3.2 per cent per annum to
$266 million by 2022-23.
See Appendix A.2for further information on the Department of Transport’s expenditure.
3.2.4 Local Governments
The State transfers funding to Local Governments through the Local Government Grants Commission.
In 2019-20, the estimated total transfer from the State will be $133 million, an increase of 25 per cent
on 2018-19. Over the remainder of the estimates period, it is estimated funding will decrease on
average by 6.6 per cent per annum to $108 million by 2022-23. In 2019-20, the State Government will
also transfer a one-off additional $10 million for the Local Government Commodity Freight Routes
program (see Appendix A.3 for further details).
3.3 Local Government Spending
Spending by Local Government is estimated to total $742 million in 2019-2013, an increase of
seven per cent on 2018-19. Over the remainder of the estimates period, spending by Local
Government is estimated to decline on average by 2.2 per cent per annum to $694 million by 2022-23.
See Appendix A.3 for further information on Local Government’s expenditure.
12 These figures include block transfers from the Commonwealth Government ($741 million in 2019-20). This figure also includes funds
expenditure by the Road Safety Commission. The Commission is currently administered by the WA Police Force, but funded by the Road
Trauma Trust Account, which is administered by the Department of Transport.
13 ACIL Allen estimation for 2019-20 based on Commonwealth and State budget papers and on WALGA’s report on Local Government Road
Assets and Expenditure.
17
BENEFITS TO WESTERN AUSTRALIAN MOTORISTS FROM TAXES, FEES AND CHARGESFIGURE 3.3 LOCAL GOVERNMENT ROAD NETWORK SPENDING, HISTORIC AND PROJECTED, $
BILLION
$0.8b Estimates
$0.7b
$0.6b
$0.5b
$0.4b
$0.3b
$0.2b
$0.1b
$0.0b
2007-08 2010-11 2013-14 2016-17 2019-20 2022-23
Note: Figures may be subject to rounding.
SOURCE: ACIL ALLEN CONSULTING, CONSECUTIVE COMMONWEALTH BUDGET PAPERS, CONSECUTIVE STATE BUDGET PAPERS, CONSECUTIVE
WALGA REPORTS ON LOCAL GOVERNMENT ROAD ASSETS AND EXPENDITURE
3.4 Total Spending
Figure 3.4 below presents total spending by all levels of government that directly benefit WA
motorists. Overall, it is estimated that a total of $3,123 million will be spent by all levels of government
on activities that directly benefit WA motorists. The State Government is estimated to be responsible
for the largest share of spending, followed by the Commonwealth14 and Local Government.
In 2019-20, it is estimated the State Government will spend a total of $1,853 million15 on the provision
of motoring related infrastructure and services that directly benefit WA motorists, an increase of
13.8 per cent from the previous year. At the same time, Commonwealth spending is estimated to
decline by 16.5 per cent to $527 million and spending by Local Government is estimated to increase
by 6.9 per cent to $742 million16.
Over the remainder of the estimates period, total spending is estimated to decrease by 16 per cent in
2020-21 and 2021-22 relative to 2019-20 levels, before increasing by 15 per cent to $3,043 million in
2022-23. These trends are largely due to a fall in State Government spending in 2020-21
($420 million) and an increase in Commonwealth funding in 2022-23 ($348 million). Despite these
changes, the State Government will still make up the largest share of spending across the estimates
period (averaging 54 per cent of total spending).
14 Commonwealth Government estimates do not include block transfers in this section and is to eliminate double counting. This is because
block transfers cannot be accounted for in any State government departments, however, form part of the overall spending by the
departments.
15 ACIL Allen estimation based on Commonwealth and State budget papers and on WALGA’s report on Local Government Road Assets and
Expenditure.
16 To ensure there in no double counting, this figure does not include expenditure as a result of transfers from Commonwealth and State
governments.
18
BENEFITS TO WESTERN AUSTRALIAN MOTORISTS FROM TAXES, FEES AND CHARGESFIGURE 3.4 TOTAL ROAD NETWORK SPENDING, HISTORIC AND PROJECTED, $ BILLION
$3.5b Estimates
Commonwealth Governmemnt
State Government Departments
$3.0b
Local Government
$2.5b
$2.0b
$1.5b
$1.0b
$0.5b
$0.0b
2007-08 2010-11 2013-14 2016-17 2019-20 2022-23
Note: Figures may be subject to rounding.
SOURCE: ACIL ALLEN CONSULTING, CONSECUTIVE COMMONWEALTH BUDGET PAPERS, CONSECUTIVE STATE BUDGET PAPERS, CONSECUTIVE
WALGA REPORT ON LOCAL GOVERNMENT ROAD ASSETS AND EXPENDITURE
19
BENEFITS TO WESTERN AUSTRALIAN MOTORISTS FROM TAXES, FEES AND CHARGES4 REVENUE AND
DIRECT
SPENDING
COMPARISONS REVENUE AND DIR ECT SPENDING COM PARI SONS
4
This section details the flow of revenues that are raised by all levels of government from WA
motorists, and how they flow back to directly benefit WA motorists as a result of the spending by all
levels of government on the provision of motoring related infrastructure and services.
4.1 Total Revenue and Direct Spending
Figure 4.1 presents a comparison between the total amount of revenue collected from WA motorists
and the total amount spent that directly benefits WA motorists.
FIGURE 4.1 TOTAL VEHICLE RELATED REVENUE GENERATED FROM WA MOTORISTS AND
RELATED DIRECT ROAD NETWORK SPENDING ON WA MOTORISTS, HISTORIC AND
PROJECTED, $ BILLION
$6.0b
Commonwealth Government revenue Estimates
State Government revenue
Local Government funding
$5.0b
Total spend on WA motorists
$4.0b
$3.0b
$2.0b
$1.0b
$0.0b
2007-08 2010-11 2013-14 2016-17 2019-20 2022-23
Note: Figures may be subject to rounding.
SOURCE: ACIL ALLEN CONSULTING, CONSECUTIVE COMMONWEALTH BUDGET PAPERS, CONSECUTIVE STATE BUDGET PAPERS, CONSECUTIVE
WALGA REPORTS ON LOCAL GOVERNMENT ROAD ASSETS AND EXPENDITURE, DEPARTMENT OF INDUSTRY, INNOVATION AND SCIENCE,
DEPARTMENT OF ENVIRONMENT AND ENERGY, ATO, ABS CAT. 6471.0, ABS CAT. 9314.0, ABS CAT. 3101.0, FEDERAL CHAMBER OF AUTOMOTIVE
INDUSTRIES
20
BENEFITS TO WESTERN AUSTRALIAN MOTORISTS FROM TAXES, FEES AND CHARGESThe Commonwealth consistently raises more revenue from WA motorists than both State and Local
governments. In 2019-20, it is estimated that of the $5,355 million collected from WA motorists,
57.7 per cent ($3,091 million) will come from Commonwealth taxes, $1,522 million (or 28.4 per cent)
to be collected by the State Government and $742 million (or 13.9 per cent) collected by Local
Government. By comparison, it is estimated that total expenditure on WA motorists will reach
$3,123 million in 2019-20.
Over the remainder of the estimates period, ACIL Allen has estimated that total revenue from WA
motorists will increase on average by 3.6 per cent per annum to $5,962 million by 2022-23. By
contrast, total spending that directly benefits WA motorists is estimated to fall slightly over the
estimates period, to $3,043 million by 2022-23 (Figure 4.1).
4.2 Flows of Total Revenue and Total Direct Spending
To understand how each level of government is raising revenue from WA motorists and how it is being
spent to directly benefit WA motorists, ACIL Allen has developed a flow of funds diagram represented
in Figure 4.2 below. The flow of funds diagram is shown for 2019-20 but can be replicated for any
year.
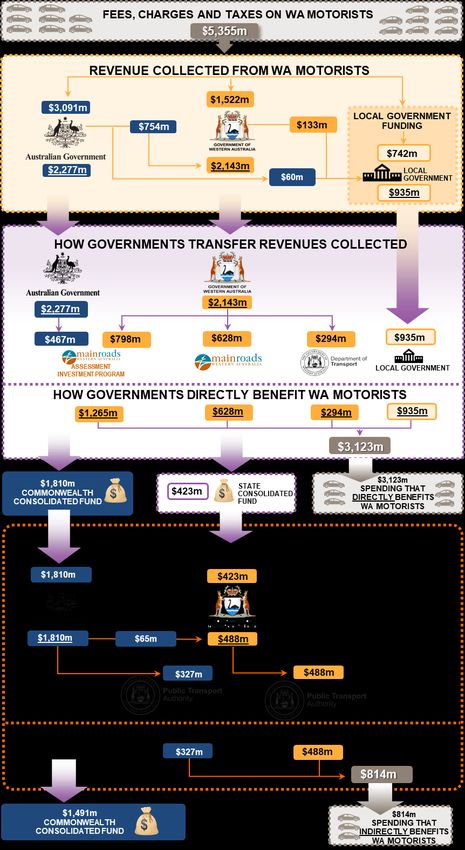
The diagram shows that in 2019-20, the Commonwealth is expected to collect the majority of total
revenue from WA motorists ($3,091 million), and then transfer amounts to the State Government
($754 million), Local Government ($60 million) and the Main Roads WA AIP ($467 million). The
majority of the revenue collected by the Commonwealth Government from WA motorists is retained in
its Consolidated Fund ($1,810 million).
The State Government is estimated to collect the next largest share of revenue ($1,522 million), which
after top up payments from the Commonwealth Government ($754 million), is transferred to State
Government departments ($2,143 million) and Local Government ($133 million). The diagram shows
that in 2019-20, the State Government is estimated to raise more revenue than they spend on WA
motorists, with $423 million returned to the State’s Consolidated Fund.
WA Local Governments are estimated to spend $935 million on roads in 2019-20, which is principally
funded from local government fees and charges ($742 million), with the remainder coming in the form
of grants from the Commonwealth ($60 million) and the State Government ($133 million).
Overall, ACIL Allen estimates that WA motorists will receive $3,123 million in direct benefits from all
levels of government in 2019-20, representing 58.3 per cent of the total revenue collected by all levels
of government from taxes, fees and charges levied on WA motorists ($5,355 million). This is explored
further in the next section.
21
BENEFITS TO WESTERN AUSTRALIAN MOTORISTS FROM TAXES, FEES AND CHARGESFIGURE 4.2 FLOW OF TOTAL REVENUE GENERATED FROM WA MOTORISTS AND TOTAL RELATED
DIRECT ROAD NETWORK SPENDING ON WA MOTORISTS, 2019-20, $ MILLION
Note: Figures may be subject to rounding.
SOURCE: ACIL ALLEN CONSULTING, CONSECUTIVE COMMONWEALTH BUDGET PAPERS, MID-YEAR ECONOMIC AND FISCAL OUTLOOK 2019-20,
CONSECUTIVE STATE BUDGET PAPERS, CONSECUTIVE WALGA REPORTS ON LOCAL GOVERNMENT ROAD ASSETS AND EXPENDITURE, DEPARTMENT
OF ENVIRONMENT AND ENERGY, ATO, ABS CAT. 6471.0, ABS CAT. 9314.0, ABS CAT. 3101.0, FEDERAL CHAMBER OF AUTOMOTIVE INDUSTRIES
4.3 Direct Returns to Western Australian Motorists
By estimating the flow of funds by each level of government, ACIL Allen is able to estimate the value
of spend that directly benefits WA motorists per dollar collected from WA motorists.
Overall, for every dollar in Commonwealth, State and Local Government taxes, fees and charges paid
by WA motorists in 2019-20, $0.58 is estimated to be returned directly to benefit WA motorists in the
form of motoring related infrastructure and services (refer to Figure 4.3).
For every dollar collected by the Commonwealth Government (total collections of $3,091 million), it is
estimated that $0.41 will be returned to directly benefit WA motorists through the transfers to the State
22
BENEFITS TO WESTERN AUSTRALIAN MOTORISTS FROM TAXES, FEES AND CHARGESGovernment, Local Governments or to the Main Roads AIP (total transfers of $1,281 million) in
2019-20.
FIGURE 4.3 DIRECT ROAD NETWORK SPENDING ON WA MOTORISTS PER DOLLAR OF REVENUE
GENERATED FROM WA MOTORISTS, 2019-20
TOTAL SPENDING THAT DIRECTLY BENEFITS WA COMMONWEALTH SPENDING THAT DIRECTLY
MOTORISTS BENEFITS WA MOTORISTS
$0.08 $0.41
Revenue retained Commonwealth
by the State spending that
directly benefits
$0.58 WA motorists
$0.34 Total spending that $0.59
directly benefits
Revenue WA motorists Revenue
retained by the retained by the
Commonwealth Commonwealth
Note: Figures may be subject to rounding.
SOURCE: ACIL ALLEN CONSULTING, CONSECUTIVE COMMONWEALTH BUDGET PAPERS, MID-YEAR ECONOMIC AND FISCAL OUTLOOK 2019-20,
CONSECUTIVE STATE BUDGET PAPERS, CONSECUTIVE WALGA REPORTS ON LOCAL GOVERNMENT ROAD ASSETS AND EXPENDITURE, DEPARTMENT
OF ENVIRONMENT AND ENERGY, ATO, ABS CAT. 6471.0, ABS CAT. 9314.0, ABS CAT. 3101.0, FEDERAL CHAMBER OF AUTOMOTIVE INDUSTRIES
Figure 4.4 shows that the total direct benefit to WA motorists per dollar collected from the taxes, fees
and charges it pays has averaged $0.61 since 2007-08, peaking at $0.6817 in 2012-13. In 2019-20,
total direct benefits per dollar collected are estimated to be below this long term average, at $0.5818.
Over the remainder of the estimates period, the total direct benefit to WA motorists per dollar collected
is estimated to average $0.48 per annum, falling to a low of $0.4619 by 2021-22 and a peak of $0.51 in
2022-23.
The total direct benefits to WA motorists per dollar collected from the taxes levied by the
Commonwealth has averaged $0.33 per annum, peaking at $0.5720 in 2014-15. In 2019-20, total
direct benefits per dollar collected are estimated to reach $0.41. Over the remainder of the estimates
period, the Commonwealth direct benefit to WA motorists per dollar collected is estimated to average
$0.46 per annum, a low of $0.4221 in 2020-21 and a peak of $0.5222 in 2022-23. This is due to a larger
allocation of Commonwealth funds to the Main Roads AIP and an increase in Commonwealth
transfers to the State Government (ie Road investment component).
Total direct benefits to WA’s motorists per dollar raised has averaged $0.61 since 2007-08 and is
expected to be $0.58 per dollar raised in 2019-20. This return is expected to decline over the
estimates period due to a decrease in the State’s allocation to Main Roads’ AIP but is offset in
2022-23 by an increase in the Commonwealth’s allocation to Main Road’s AIP.
Compared to last year’s forward estimates period, the direct benefits to WA motorists from the
Commonwealth have increased by an average of $493 million per annum23 due to increases in
transfers to the Main Roads’ AIP and to the State Government.
On a per motorist basis, ACIL Allen estimates that in 2019-20 each of WA’s 1.9 million24 motorists
paid $2,750 to all levels of government in the form of taxes, fees and charges, with $1,604 directly
returned to each motorist in the form of road related infrastructure and services.
17 Total collections of $4,117 million and total spending of $2,793 million.
18 Total collections of $5,355 million and total spending of $3,123 million.
19 Total collections of $5,696 million and total spending of $2,647 million.
20 Commonwealth collections of $2,444 million and Commonwealth spending of $1,399 million.
21 Commonwealth collections of $3,191 million and Commonwealth spending of $1,332 million.
22 Commonwealth collections of $3,503 Commonwealth spending of $1,828 million.
23 Comparing the average between 2018-19 and 2021-22 in the 2018-19 report, and the average between 2019-20 and 2022-23 in the
2019-20 report. This includes any updates included in the Mid-Year Economic and Fiscal Outlook 2019-20.
24 Excludes learners permits. As at 31 December 2018.
23
BENEFITS TO WESTERN AUSTRALIAN MOTORISTS FROM TAXES, FEES AND CHARGESYou can also read