Supplement of Attribution of N2O sources in a grassland soil with laser spectroscopy based isotopocule analysis - Biogeosciences
←
→
Page content transcription
If your browser does not render page correctly, please read the page content below
Supplement of Biogeosciences, 16, 3247–3266, 2019
https://doi.org/10.5194/bg-16-3247-2019-supplement
© Author(s) 2019. This work is distributed under
the Creative Commons Attribution 4.0 License.

Supplement of
Attribution of N2 O sources in a grassland soil with laser spectroscopy
based isotopocule analysis
Erkan Ibraim et al.

Correspondence to: Erkan Ibraim (erkan.ibraim@empa.ch)

The copyright of individual parts of the supplement might differ from the CC BY 4.0 License.
1. N2O fluxes with coupled flux chambers and GC-ECD

SI Figure 1 N2O fluxes at the intensively managed grassland site De-Fen determined with five automated chambers and
N2O analysis by GC-ECD. Vertical dashed lines indicate the mowing (blue) and the manure applications (red).

1.1. Comparison of N2O mole fractions and N2O emission rates

N2O concentrations 2 m above ground analysed by TREX-QCLAS show a significant correlation (p-value < 0.05)
with (N2O) obtained with the coupled flux-chamber and GC-ECD (SI Figure 2).

SI Figure 2 Comparison of N2O mole fractions measured with the TREX-QCLAS system and the N2O fluxes measured
with the coupled flux-chambers and GC-ECD system. The figure on the right depicts the comparison of noon-to-noon
average values as obtained with the two measurement systems shown on the left. The r-squared value and the p-value
are given.

 1
2. Source signatures

2.1. Miller and Tans (2003) analysis

SI Figure 3 Background N2O mixing ratios and isotopic composition used for the Miller-Tans analysis. Pale blue crosses
represent all data points; points falling within the lowest 5% of a moving 1-day window were used for the baseline
retrieval (dark blue circles). The 5-day smoothed background is shown in red with the shaded region indicating 1 stand-
ard deviation.

A Miller and Tans (2003) analysis as performed by Harris et al. (2017) was conducted to retrieve source signatures
with a independent method in order to verify the Keeling (1958, 1961) plot-derived results. For the first third of
the measurement period source signatures calculated with the Keeling (1958, 1961) plot approach did not pass the
selection criteria due to lack of N2O build up and Miller and Tans (2003) derived source signatures are rather
scattered. In periods with reasonable N2O fluxes, there is a very good agreement between the two methods.

2.2. Illustratory example for the SP vs. Δδ15Nbulk and SP vs. Δδ18O plots

SI Figure 4 Illustration of the two concepts behind the two mapping approaches used in the main document. The source
signatures of fungal denitrification- and nitrification-derived N2O (FD/ N) and bacterial denitrification- and nitrifier
denitrification-derived N2O (BD/ ND) are indicated with rectangles according to the values given in Table 4. The shaded
area represents the mixing region of the two domains. As exemplary values, the average source signatures for our meas-
urements are given with the orange star. Red arrows denote the path of partial N2O reduction to N2, while black arrows
indicate the direction of mixing with FD/ N-derived N2O. Solid arrows indicate scenario 1 (first reduction, then mixing),
while dashed arrows indicate scenario 2 (first mixing, then reduction). (a) SP versus Δδ15N map according to Koba et
al. (2009), where Δδ15N = δ15N-NO3- – δ15N-N2O (b) SP versus Δδ18O of soil-emitted N2O according to Lewicka-Szczebak
et al. (2017), where Δδ18O = δ18O-N2O – δ18O-H2O.
SI Figure 4 illustrates the SP vs. Δδ15Nbulk and SP vs. Δδ18O plots with the average source signatures (given as
orange stars). The two rectangles labelled with FD/ N and BD/ ND indicate the expected source signatures of
fungal denitrification/ nitrification (FD/ N) derived N2O and bacterial denitrification/ nitrifier-denitrification (BD/
ND) derived N2O. Source signatures falling into the grey shaded area correspond to a N2O mainly derived by a
mix of the two process domains. Red arrows indicate the path of source-signature changes due to partial N2O
reduction, while black arrows indicate source signature changes due to mixing of N2O originating from the two
process domains. In principle, two scenarios are possible to interpret the measured source signatures (Lewicka-
Szczebak et al., 2017). Scenario 1: BD/ ND derived N2O is partially reduced to N2, then the residual N2O is mixed
with FD/ N derived N2O. Scenario 2: BD/ ND derived N2O is mixed with FD/ N derived N2O first and then partial
N2O reduction to N2 occurs. The rate of N2O reduction is calculated with the Rayleigh approach (described in
detail in the main manuscript), while the rate of mixing is assumed linearly proportional to the length of the mixing
vectors (vmix).

2.3. N2O-to-N2 reduction rates of individual events determined with different ap-
 proaches and using different scenarios

SI Figure 5 Left: Fraction of remaining N2O after the N2O reduction as estimated with different approaches and as-
suming different scenarios (rN2O refers to residual N2O after N2O reduction to N2; sc11 = Koba approach scenario 1,
sc12 = Koba approach scenario 2, sc21 = Lewicka-Szczebak approach scenario 1, and sc22 = Lewicka-Szczebak ap-
proach scenario 2). Dashed lines correspond to the 1:1 line. While the blue fit corresponds to the linear regression of all
data points (n=12), the red fit was carried out only for rN2O values smaller than 0.4, i.e. for cases with high N2O reduc-
tion rates. Right: distribution of the rN2O values given with boxplots.
SI Figure 6 Fraction of remaining N2O after N2O reduction plotted against WFPS, where rN2O has been calculated
using different approaches and assuming different scenarios (rN2O refers to residual N2O after N2O reduction to N2.
Explanation of suffix: sc11 = Koba approach scenario 1, sc12 = Koba approach scenario 2, sc21 = Lewicka-Szczebak
approach scenario 1, and sc22 = Lewicka-Szczebak approach scenario 2)

SI Figure 7 Fraction of remaining N2O after N2O reduction plotted against ambient temperature, where rN2O has been
calculated using different approaches and assuming different scenarios (rN2O refers to residual N2O after N2O reduc-
tion to N2. Explanation of suffix: sc11 = Koba approach scenario 1, sc12 = Koba approach scenario 2, sc21 = Lewicka-
Szczebak approach scenario 1, and sc22 = Lewicka-Szczebak approach scenario 2)
SI Figure 8 left: Fraction of N2O originating from fungal denitrification or nitrification (rNit), determined based on the
mapping approach according to Lewicka-Szczebak et al. (2017) (rNit2; referred to as approach 2) versus rNit as deter-
mined based on the mapping approach according to the Koba et al. (2009) approach (rNit1; referred to as approach 1).
Right: boxplots of rNit1 and rNit2. The medians of rNit1 and rNit2 are 0.37 and 0.41, respectively, indicating 37 and 41
% of FD/N derived N2O on the total emissions.

2.4. Contribution of FD/ N and BD/ ND to the total emissions

SI Figure 9 Blue bars indicate the fraction of FD/ N derived N2O on the total N2O emissions for individual emission
events, while red bars refer to the fraction of BD/ND derived N 2O.
3. FLEXPART-COSMO simulations with local micro meteorological inputs

SI Figure 10 Simulation of concentration accumulation events with FLEXPART-COSMO. Observation data were ob-
tained with TREX-QCLAS (black), while Sim Local (red) and Sim Nest (green) refer to values simulated with
FLEXPART-COSMO assuming horizontally homogenous fluxes of (N2O) in the local domain shown in Figure 1 and
in a larger domain (16 km x 16 km), respectively. Fluxes were taken as the mean flux observed in the chamber meas-
urements as shown in the lower panel.
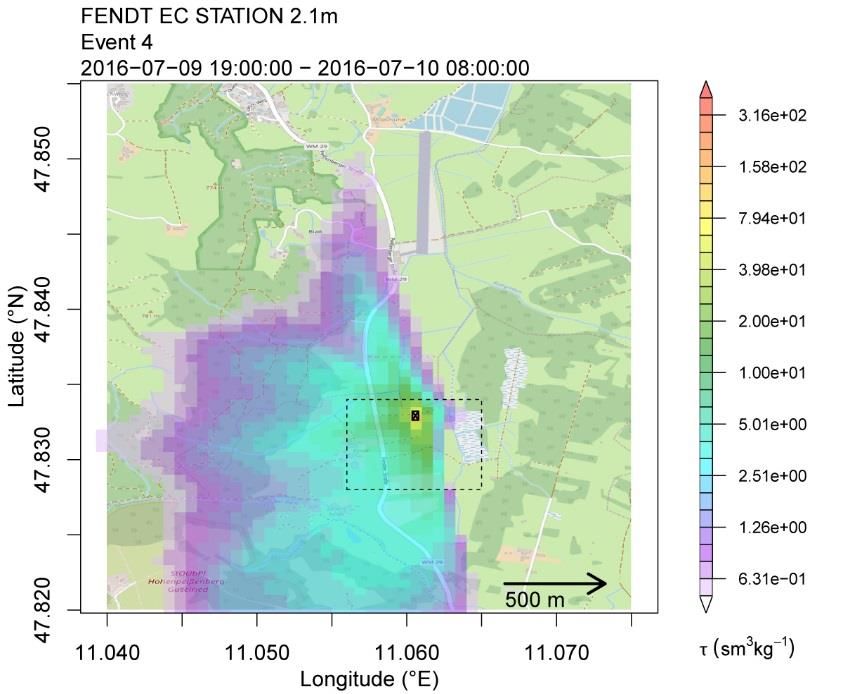
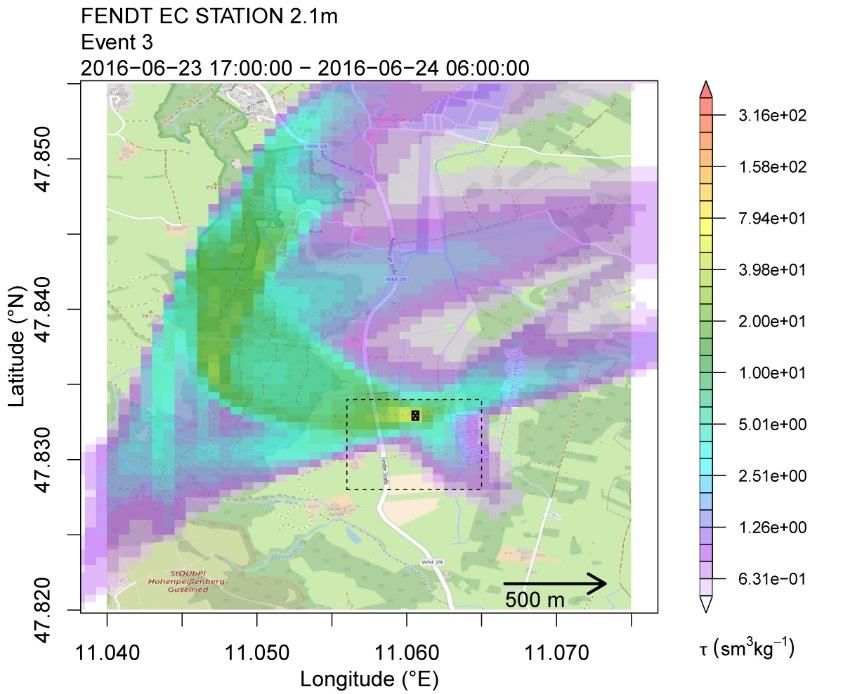
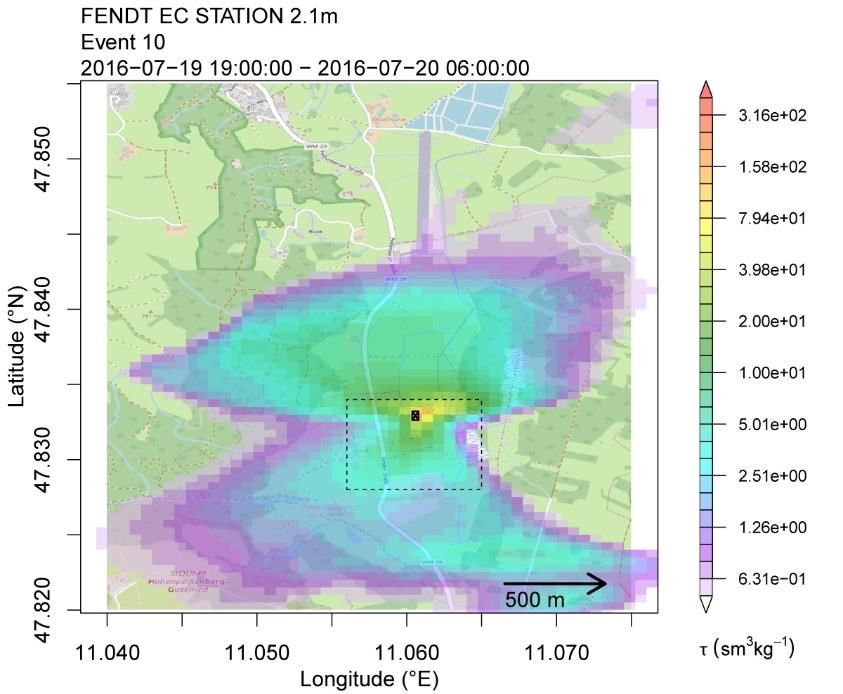
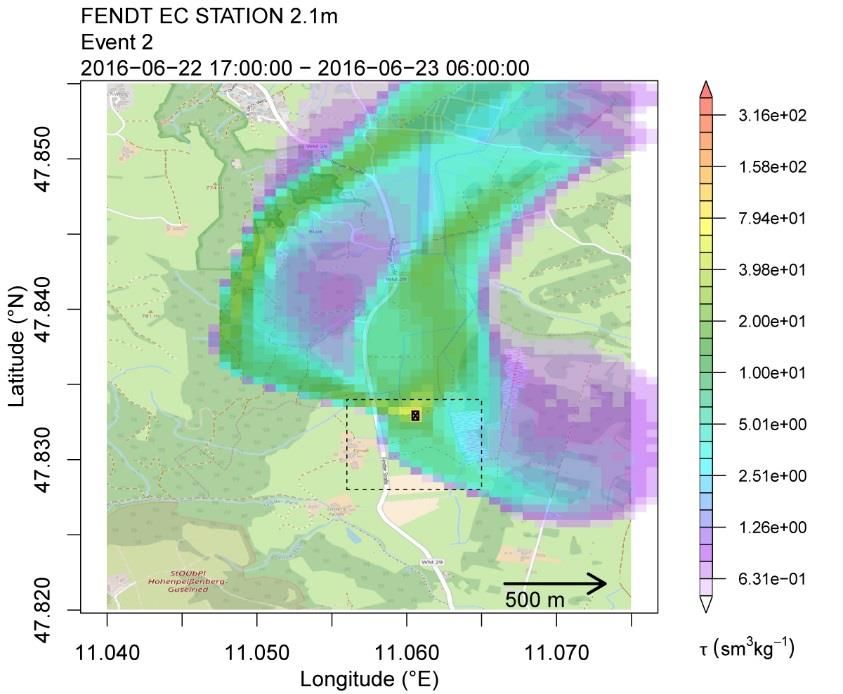
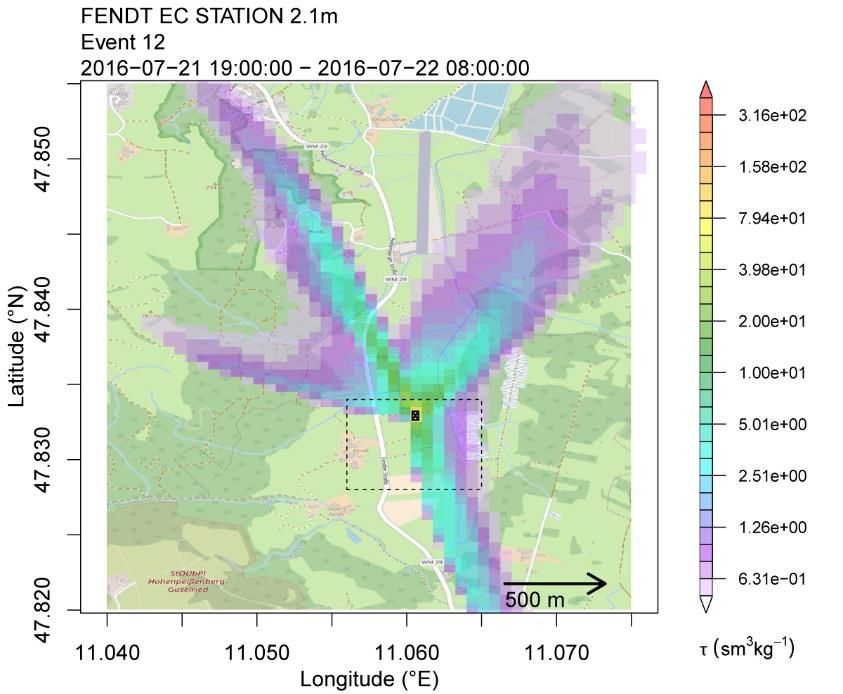
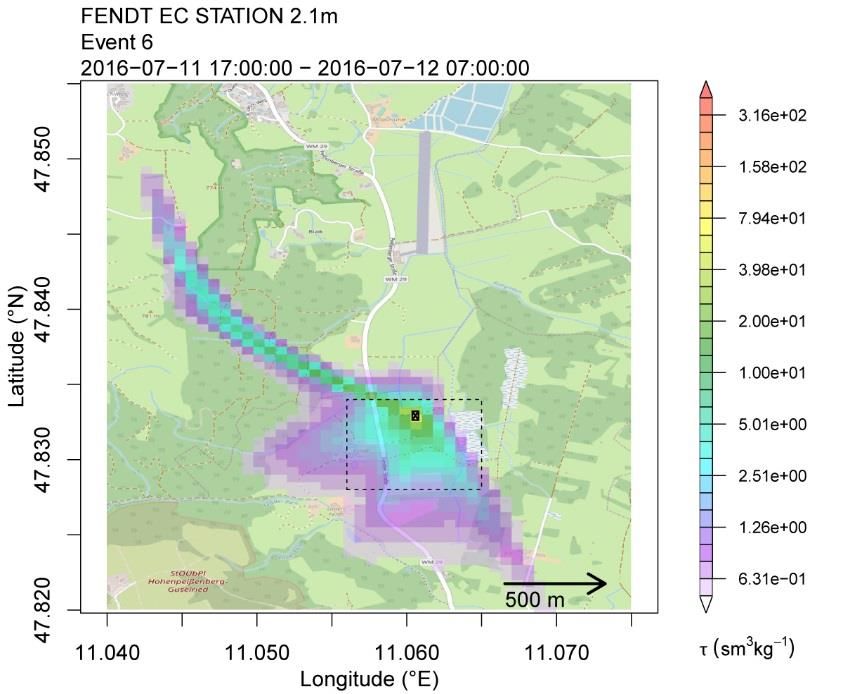
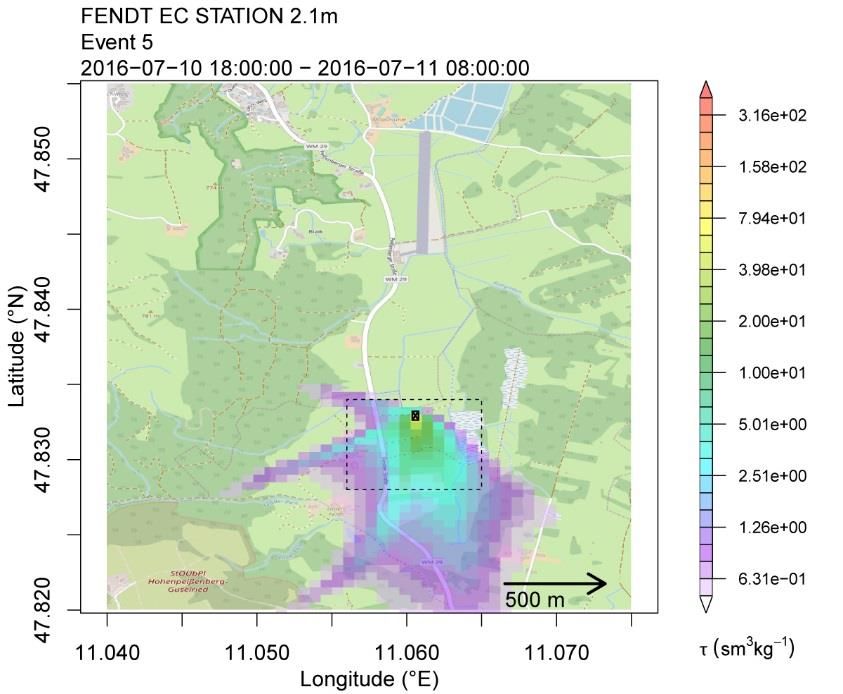
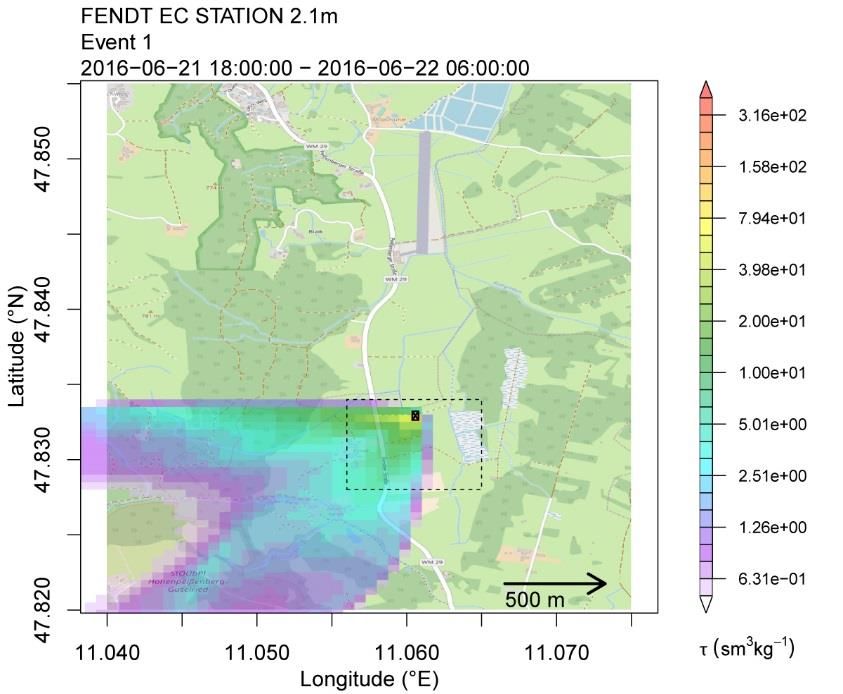
3.1. Footprints of individual events
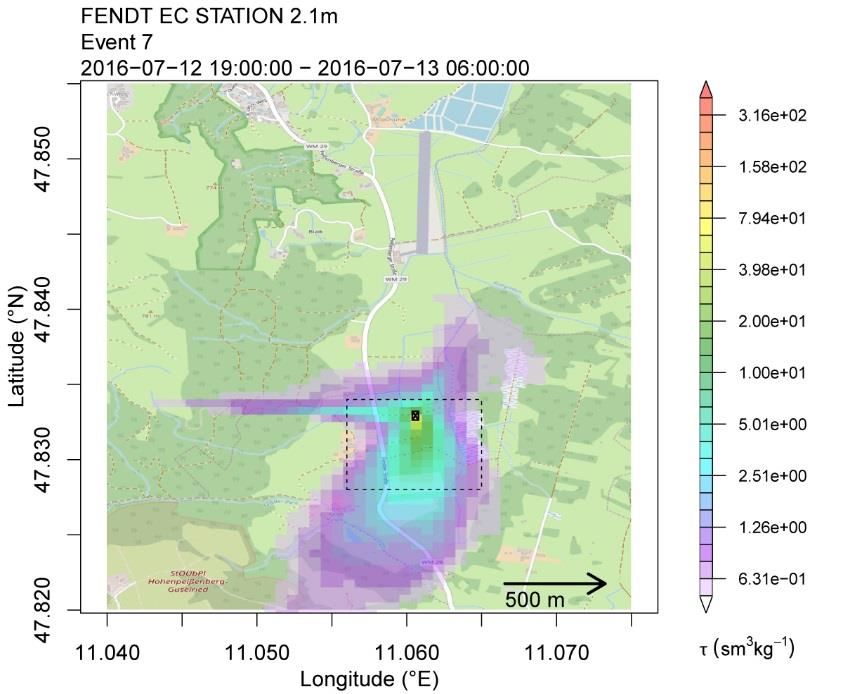
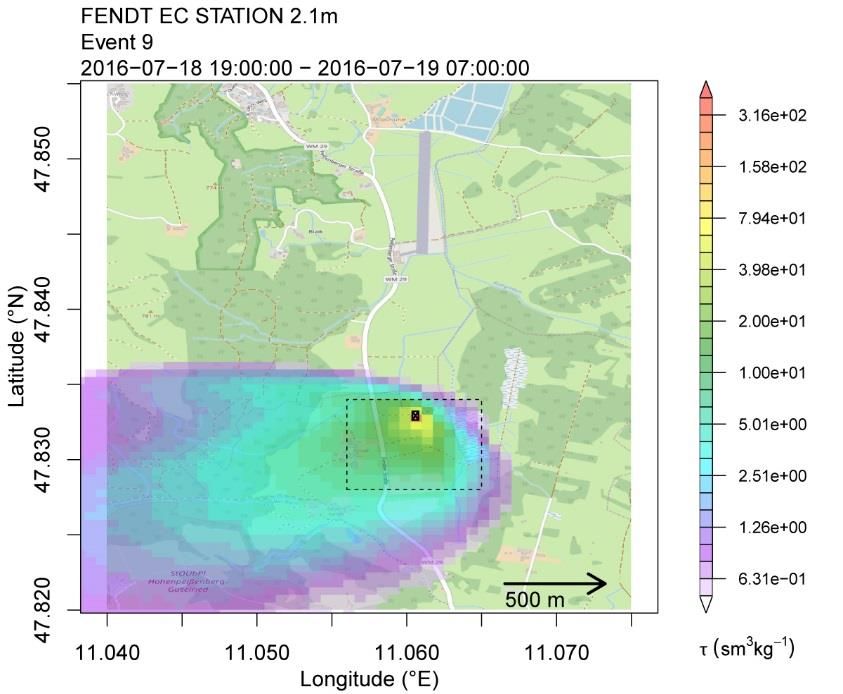
SI Figure 11 Individual footprints of the 12 accumulation events
1. References

Harris, E., Henne, S., Hüglin, C., Zellweger, C., Tuzson, B., Ibraim, E., Emmenegger, L., and Mohn, J.: Tracking nitrous oxide
 emission processes at a suburban site with semicontinuous, in situ measurements of isotopic composition, Journal of
 Geophysical Research: Atmospheres, 122, 1850-1870, 10.1002/2016JD025906, 2017.
Keeling, C. D.: The Concentration and Isotopic Abundances of Atmospheric Carbon Dioxide in Rural Areas, Geochimica Et
 Cosmochimica Acta, 13, 322-334, Doi 10.1016/0016-7037(58)90033-4, 1958.
Keeling, C. D.: The Concentration and Isotopic Abundances of Carbon Dioxide in Rural and Marine Air, Geochim.
 Cosmochim. Acta, 24, 277-298, Doi 10.1016/0016-7037(61)90023-0, 1961.
Koba, K., Osaka, K., Tobari, Y., Toyoda, S., Ohte, N., Katsuyama, M., Suzuki, N., Itoh, M., Yamagishi, H., Kawasaki, M.,
 Kim, S. J., Yoshida, N., and Nakajima, T.: Biogeochemistry of nitrous oxide in groundwater in a forested ecosystem
 elucidated by nitrous oxide isotopomer measurements, Geochim. Cosmochim. Acta, 73, 3115-3133,
 10.1016/j.gca.2009.03.022, 2009.
Lewicka-Szczebak, D., Augustin, J., Giesemann, A., and Well, R.: Quantifying N 2O reduction to N2 based on N2O isotopocules
 - validation with independent methods (helium incubation and 15N gas flux method), Biogeosciences, 14, 10.5194/bg-
 14-711-2017, 2017.
Miller, J. B., and Tans, P. P.: Calculating isotopic fractionation from atmospheric measurements at various scales, Tellus (B
 Chem. Phys. Meteorol.), 55, 207-214, 10.1034/j.1600-0889.2003.00020.x, 2003.
You can also read